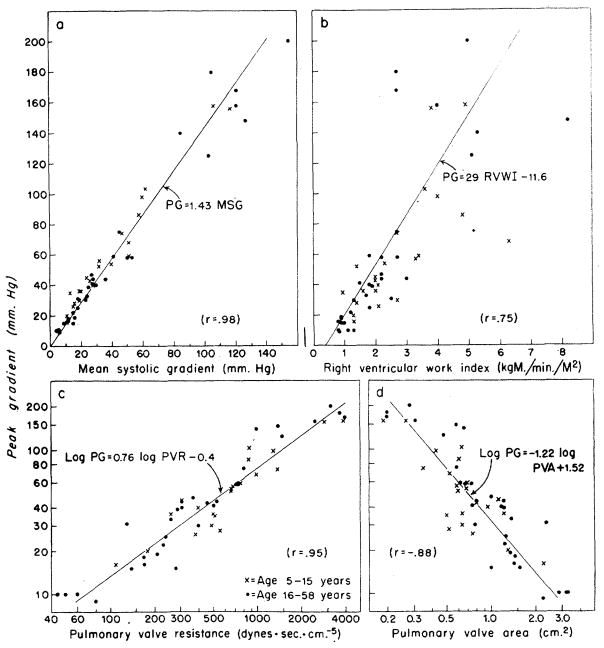
Figure 1.
Correlation of peak gradient (PG) across the pulmonary valve with other hemodynamic data from patients with pulmonary stenosis and an intact ventricular septum. The correlation coefficient (r) and the equation for the linear regression line representing the relationship between any two variables are given in each panel, each variable being represented by the first letters of its name, such as, MSG for mean systolic gradient.

