

Abstract
The maintenance in the long run of a positive carbon balance under very low irradiance is a prerequisite for survival of tree seedlings below the canopy or in small gaps in a tropical rainforest. To provide a quantitative basis for this assumption, experiments were carried out to determine whether construction cost (CC) and payback time for leaves and support structures, as well as leaf life span (i) differ among species and (ii) display an irradiance-elicited plasticity. Experiments were also conducted to determine whether leaf life span correlates to CC and payback time and is close to the optimal longevity derived from an optimization model. Saplings from 13 tropical tree species were grown under three levels of irradiance. Specific-CC was computed, as well as CC scaled to leaf area at the metamer level. Photosynthesis was recorded over the leaf life span. Payback time was derived from CC and a simple photosynthesis model. Specific-CC displayed only little interspecific variability and irradiance-elicited plasticity, in contrast to CC scaled to leaf area. Leaf life span ranged from 4 months to >26 months among species, and was longest in seedlings grown under lowest irradiance. It was always much longer than payback time, even under the lowest irradiance. Leaves were shed when their photosynthesis had reached very low values, in contrast to what was predicted by an optimality model. The species ranking for the different traits was stable across irradiance treatments. The two pioneer species always displayed the smallest CC, leaf life span, and payback time. All species displayed a similar large irradiance-elicited plasticity.
Keywords: Carbon balance, construction cost, functional diversity, leaf life span, payback time, photosynthesis, tropical rainforest
Introduction
Beneath the canopy or in small gaps, survival of individual seedlings depends on their ability to maintain a positive balance between carbon assimilation (through photosynthesis) and losses (through respiration for construction and maintenance of assimilating and support tissues, and for the replacement of lost tissues), even under very low irradiance (Givnish, 1988; Valladares and Niinemets, 2008). Several approaches may be used to assess whole seedling carbon balance. Measurements of gas exchange at the seedling level as well as structure–function models provide reliable estimates of net carbon assimilation/respiration at different time scales (Le Roux et al., 2001). Instant carbon balance, although it documents the ability of saplings to assimilate more carbon than used by respiration, is not sufficient to assess survival of plants. Indeed, it does not take into account nocturnal respiration, or the turnover of organs such as leaves or roots, or the cost associated with the construction of new organs (Givnish, 1988; Messier et al., 1999). In contrast, cost–benefit analyses are based on the cost of deploying the assimilating area and the supporting organs, and on the net carbon gain (or respiration) of these organs integrated over their whole life span (Chabot and Hicks, 1982; Givnish, 1988; Poorter et al., 2006).
Leaf construction cost (CC) is the amount of energy required for deploying the assimilating leaf area (for abbreviations and symbols used in the text, see Table 1). Specific-CC (i.e. per unit mass) displays some interspecific variability due to changes in biochemical composition (Penning De Vries et al., 1974; Poorter, 1994; Barthod and Epron, 2005; Poorter and Bongers, 2006): carbohydrates imply a smaller cost than proteins and lipids, lignins, and phenolics (Poorter and Villar, 1997). CC reported to leaf area is also constrained by structure: a large leaf mass to area ratio (LMA) increases the CC of a given assimilating area. At the metamer (or growth unit) level, large differences in CC occur as a consequence of large differences in LMA and in the supporting tissue/assimilating leaf area ratio (Poorter and Rozendaal, 2008). Cost–benefit analyses need explicitly to integrate CC of support tissues such as petioles, twigs, branches, and roots (Barthod and Epron, 2005), as well as their turnover rate (or their life span).
Table 1.
List of abbreviations and symbols
| RGR | Relative height growth rate; cm cm−1 year−1 |
| Construction costs (CC): | |
| CCLm | Specific construction cost of leaf lamina; g glucose g−1 DW |
| CCPm | Specific construction cost of petiole and main vein (or rachis); g glucose g−1 DW |
| CCSm | Specific construction cost of stem; g glucose g−1 DW |
| CCLa | Construction cost of leaf lamina scaled to leaf area; g glucose m−2 |
| CCmetm | Specific construction cost of the metamer; g glucose g−1 DW |
| CCmeta | Construction cost of the metamer scaled to leaf area; g glucose m−2 |
| Structural traits: | |
| LMA | Leaf mass to area ratio; g m−2 |
| PMA | Petiole mass to leaf area ratio; g m−2 |
| SMA | Stem (internode) mass to leaf area ratio; g m−2 |
| MMA | Metamer mass to leaf area ratio; g m−2 |
| Thickness | Leaf thickness; μm |
| Density | Leaf density (LMA/thickness); g cm−3 |
| Chla | Leaf chlorophyll content; μmol Chl m−2 |
| Na | Area-based leaf nitrogen; mg N m−2 |
| Nm | Leaf nitrogen content; mg g−1 |
| Nmetm | Metamer nitrogen content; mg g−1 |
| Cm | Leaf carbon content ; mg g−1 |
| Ash | Total ash content; mg g−1 |
| Functional traits: | |
| Asatm | Mass-based light-saturated net CO2 assimilation rate; nmol CO2 g−1 s−1 |
| Asata | Area-based light-saturated net CO2 assimilation rate; μmol CO2 m−2 s−1 |
| Aest | Daily carbon gain of the newly expanded leaf; μmol CO2 g−1 d−1 |
| Rdm | Mass-based CO2 production by non-photorespiratory respiration; nmol CO2 g−1 s−1 |
| LLS | Leaf life span; d |
| PBT | Payback time for the construction cost of the leaf; d |
| PBTmet | Payback time for the construction cost of the whole metamer; d |
| b | Leaf age at which photosynthesis rates approach nil values; d |
| Lopt | Optimum leaf longevity; d |
| Loptmet | Optimum leaf longevity based on the construction cost of the metamer; d |
Time-integrated carbon gain is usually compared with CC to compute a payback time for leaf area deployment (PBT; Williams et al., 1989; Poorter, 1994; Poorter et al., 2006). PBT is expected to be shorter than leaf life span (LLS); it was for instance less than half the LLS even at low irradiance in a large range of species (Poorter et al., 2006). Under climates with little seasonal constraints, such as tropical rainforests, LLS displays a large interspecific variation as well as some degree of plasticity. Shade-tolerant species often display a longer LLS (Reich et al. 2004; Poorter and Bongers, 2006). As a general hypothesis, it is assumed that LLS is larger in species growing in resource-limited environments (Hikosaka, 2005; Vincent, 2006). Leaves a with long LLS frequently also display a larger LMA (Coley, 1983; Reich et al., 1997). In order to survive under very low irradiance, saplings need to maximize the benefit–cost ratio by limiting the cost for the deployment of leaf area, by maximizing the life span of the assimilating leaf area, or by both.
A large irradiance-elicited plasticity has been evidenced for many leaf traits involved in carbon assimilation (Givnish, 1988; Valladares et al., 2000; Rozendaal et al., 2006; Coste et al., 2010). In contrast, specific-CC displayed only a small irradiance-elicited plasticity in temperate forest trees (Barthod and Epron, 2005). Specific-CC is sometimes lower in shade- than in sun-exposed leaves (Williams et al., 1989; Niinemets, 1999), but the opposite trend may also be observed (Sims and Pearcy, 1994; Baruch et al., 2000). Specific-CC was 1–5% smaller in shade compared with sun-acclimated leaves of 23 species, due mainly to decreased levels of soluble phenolics (Poorter et al., 2006). In addition to changes in specific-CC, plastic responses of CC may result from changes in the supporting tissue/assimilating area ratio. There is still a lack of a quantitative assessment of the respective contribution of specific-CC and of the support tissue/assimilating leaf area ratio to the overall plasticity of CC of whole metamers. Plastic responses of LLS have also been evidenced, with sometimes contradictory responses to environment. For instance, shading applied to whole individuals usually results in increased LLS, while partial shading decreases the LLS in the shaded sectors (Hikosaka, 2005).
Potential carbon gain over leaf life depends on the photosynthetic capacity of young tissues, but also on the rate of decline of actual photosynthesis with leaf ageing, particularly visible in long-lived leaves (Mediavilla and Escudero, 2003). The decline is due to ontogenic changes of photosynthetic capacity in ageing leaves as well as to increased self-shading resulting from continuing growth (Ackerly, 1999).
The determinants of LLS in the absence of severe external constraints (e.g. low temperatures or long dry season) are still poorly understood. In particular, it is still not clear whether leaves are shed while their net carbon balance is still large, or only when it reaches very low values (Ackerly, 1999; Anten and Poorter, 2009). Optimality models predict that, in order to maximize whole tree carbon gain, leaves are shed as soon as their carbon gain falls below the potential gain of a younger leaf. This time corresponds to the optimal leaf longevity (Lopt; Kikuzawa, 1991, 1995). Implicit assumptions in this model are: (i) photosynthetic activity of individual leaves declines with time; and (ii) a given individual can only retain a fixed number of leaves. Lopt is constrained by CC, photosynthetic capacity, and age-induced decline of photosynthetic activity. In contrast, Ackerly (1999) proposed an alternative model in which shoot extension is maximized. In this case, the main prediction is that leaves are shed only once their net carbon assimilation rate drops to almost zero. There are currently only few data sets available to test these contradicting predictions. Recently, Reich et al. (2009) showed that leaves were only shed when photosynthesis was close to zero in a range of Australian species.
The aim of this study was to build a cost–benefit analysis for saplings of several tropical rainforest species, taking into account interspecific differences as well as irradiance-elicited plasticity. Thirteen species from French Guiana, with widely different values of LMA, including a few pioneers growing only in large forest gaps as well as shade-tolerant understorey species, were used to test the following hypotheses: (i) CC of leaves and support tissues differ among species due to differences in specific-CC, and in structure (biomass to leaf area ratio); (ii) CC of leaves and support structures displays a large irradiance-elicited plasticity, due to changes in structure and not in specific-CC; (iii) the PBT of leaves and support structures is much shorter than the actual LLS even under the lowest irradiance levels tested; (iv) LLS displays interspecific differences as well as irradiance-elicited plasticity; it is larger than optimal leaf longevity computed from a C-optimization model; and (v) LLS is more closely correlated to the rate of decline of photosynthesis during leaf life than to the actual construction cost or maximal photosynthesis of young leaves.
These hypotheses were tested by growing seedlings under three levels of relative irradiance (∼5, 10. and 20%). Specific-CC was computed from C, N, and mineral content (Poorter, 1994), photosynthetic carbon gain over the LLS was recorded, and PBT was estimated with a simple photosynthesis model. LLS was recorded by monitoring expansion and shedding of leaf cohorts over 26 months.
Materials and methods
Plant material
Saplings of 13 tree species were grown from December 2003 to July 2006 in Kourou, French Guiana (5°10'N, 52°40'W) under three levels of relative irradiance provided by neutral shading nets. The species encompassed light-requiring pioneers and species with varying levels of shade tolerance (Table 2). Saplings were grown from seeds or from young seedlings collected in forests around Kourou, and planted during July 2003 in 30.0 l pots with a 1/2 (v/v) mix of sand and soil from a nearby forest. All saplings were fertilized during July 2004, with 40 g slow release Multicote (N/P/K, 17/17/17). They were sprayed with a systemic insecticide (Lannate, Du Pont de Nemours, France) and, whenever required, with a contact insecticide (Endosulfan, Thiodan 35CE, Bayer) and a fungicide (Ortiva, Syngenta, Belgium). As a result, herbivory by mammals and insects was totally avoided. The saplings were irrigated daily with drip irrigation to maintain volumetric soil water between 20% and 32%.
Table 2.
List of the studied species, with the abbreviations used in the figures, the phylogenic position, the ecological status. and the form of leaves (simple or compound)
| Species name | Codes | Family | Ecological status | Leaf type |
| Bagassa guianensis J.B. Aublet | Bg | Moraceae | Pioneera | Simple |
| Cecropia obtusa Trécul. | Co | Cecropiaceae | Pioneera | Simple |
| Carapa procera A.P. De Candolle | Cp | Meliaceae | Heliophilic/non-pioneera | Compound |
| Tachigali melinonii (Harms) Barneby | Tm | Caesalpiniaceae | Heliophilic/non-pioneera | Compound |
| Amanoa guianensis J.B. Aublet | Ag | Euphorbiaceae | Shade tolerant | Simple |
| Eperua falcata J.B. Aublet | Ef | Caesalpiniaceae | Shade tolerant | Compound |
| Hymenaea courbaril Linnaeus | Hc | Caesalpiniaceae | Shade tolerant | Compound |
| Pouteria sp. J.B. Aublet | Ps | Sapotaceae | Shade tolerant | Simple |
| Pradosia cochlearia (Lecomte) Pennington | Pc | Sapotaceae | Shade tolerant | Simple |
| Protium opacum Swart | Po | Burseraceae | Shade tolerant | Compound |
| Sextonia rubra (Mez) van der Werff | Sr | Lauraceae | Shade tolerant | Simple |
| Symphonia globulifera Linnaeus f. | Sg | Clusiaceae | Shade tolerant | Simple |
| Vouacapoua americana J.B. Aublet | Va | Caesalpiniaceae | Shade tolerant | Compound |
According to Molino and Sabatier (2001).
Irradiance above the saplings was recorded and described in Coste et al. (2010). Mean values of relative irradiance and of daily cumulated photon flux in the PAR were 4.7, 9.0, and 19.5%, and 2.3, 4.6, and 10.0 mol m−2 d−1, respectively, which corresponds approximately to small, medium, and large forest gaps. Daily mean climate was: air temperature, 29.1 °C (min/max: 23.9/33.3 °C); relative humidity, 72.6% (min/max 61/92%); soil temperature during the day, 24.7 °C (min/max 21.4/30.6 °C); and soil temperature during the night, 24.4 °C (min/max 21.7/28.3 °C). Seasonality in French Guiana is only really marked by changes in rainfall (which is of little importance for potted and irrigated trees). These values were therefore extrapolated over the year for a first estimate of photosynthetic carbon gain by leaves.
Sampling
All traits were recorded on 10 individuals per species and treatment. Metamers (i.e. growth units) were harvested on the primary growth axis during January 2006 (except Cecropia obtusa and Bagassa guianensis that were harvested during March 2005). Each metamer, harvested on the main stem, included a stem internode and a single fully expanded young leaf and petiole (or rachis for compound leaves). In B. guianensis and Symphonia globulifera, the two opposite leaves attached to each node were harvested. From one to six metamers were sampled per individual, depending on the amount of biomass available for analyses. Leaf lamina area (cm2) was recorded with a portable diode-array planimeter LiCor 3000A (LiCor Inc, Lincoln, NE, USA). Samples were dried at 60 °C (48 h for leaf lamina and variable durations for stem and petiole). Total nitrogen (Nm) and carbon content (Cm) was measured with an elemental analyser (ThermoQuest NA 1500 NCS, Carlo Erba, Italy) on homogenized powder from each compartment. Ash content was measured after combustion in a muffle furnace at 550 °C for 3 h.
Estimation of CC
Specific-CC was calculated following Vertregt and Penning De Vries (1987), and Poorter (1994):
| (1) |
where CCm is specific-CC (g glucose g−1 DW); Cm is total carbon; Min is mineral content; and Norg is organic nitrogen content. An additional cost for nitrate reduction in non-photosynthetic tissues was taken into account (5.325×Norg). Min and Norg were approximated respectively by ash (Ash) and total nitrogen content (Nm). This computation assumes all nitrogen is absorbed as nitrate. Specific-CC was estimated for leaves, petioles, and stems (CCLm, CCPm, and CCSm, respectively); leaf CC was also reported to leaf area (CCLa, g glucose m−2).
CC of a metamer, scaled to leaf area (CCmeta) or to mass (CCmetm), was computed as:
| (2) |
| (3) |
where SMA, PMA, and LMA are the ratio of stem, petiole, or lamina mass versus leaf area of the metamer; and bmS, bmP, and bmL are the biomass of stem, petiole, and lamina.
Estimation of LLS
LLS was estimated as the mean time between development and shedding of a cohort of leaves on the main axis. To mark a given cohort, the youngest leaf on the main axis was labelled on 11 March 2004 and leaf production was monitored every second week until 28 July 2004, when the latest developed leaf was marked. The survival of leaves was recorded at regular intervals in the cohorts during 78 d (18 censuses) and leaf shedding was followed. LLS was computed as described in Navas et al. (2003, see figure 1). Unfortunately, leaf shedding was not complete at the end of the experiment in several species, therefore: (i) LLS was assumed to be >780 d when >50% of the cohort were shed; and (ii) LLS was computed only for the shed leaves with the assumption ‘first developed–first shed’, when >50% of the cohort was shed. Median LLS was used to characterize a given treatment×species combination.
Fig. 1.

Cumulated leaf production (open circles) and shedding (filled circles) in a cohort used to compute leaf life span (LLS) for an individual of Cecropia obtusa (115 d) and of Sextonia rubra (518 d). LLS is computed as the area between the two curves divided by the mean time span between production and shedding. The horizontal line marks the arbitrary limit of the cohort.
CO2 assimilation and PBT
Light-saturated net CO2 assimilation rate (Asat, μmol m−2 s−1) was measured at regular intervals on a single leaf per individual. A portable photosynthesis chamber was used (CIRAS-1, PP-System, Hitchin, UK, with a 2.5 cm2 Parkinson leaf-clamp chamber). The microclimate in the chamber was: CO2, 380±3.7 μmol mol−1, PPFD, 700 μmol m−2 s−1; air temperature, 31±1.7 °C; and vapour pressure deficit, 1.5±0.4 kPa. Asat measurements were repeated during May 2004, September–November 2004, January–March 2005, April–June 2005, and May 2006.
To compute daily net C gain, a simple model was used (Poorter et al. 2006). First, net CO2 assimilation was estimated as a function of the irradiance response modelled as:
| (4) |
where ϕ is the apparent quantum yield; I is the irradiance; Asat is the light-saturated net CO2 assimilation rate; and θ is the curvature of the non-rectangular hyperbola.
Light response curves recorded in all species were used to adjust a mean value [± the 95% confidence interval (CI)] of 0.048±0.003 mol C mol−1 photons for ϕ and 0.797±0.033 for θ. Therefore, ϕ=0.05 mol C mol−1 photons and θ=0.80 was used in all species.
Irradiance measured during September 2004 and November 2004 was used to compute a mean daily irradiance curve at 15 min intervals in the different treatments. The curve was used as representative of a typical day for Kourou, together with a constant temperature of 30 °C and a 12/12 h day/night alternation. Given the slow growth of most of the species, the irradiance at leaf level was assumed to be the same (i.e. no corrections were made for leaf angles or for increasing self-shading). Equation 4 was used to compute A over 15 min steps. The daily carbon gain for young, fully expanded leaves was estimated for each individual as the sum of all A values minus the night time respiration, assumed to be 0.07 times the daily net assimilation (Givnish, 1988), and corrected for LMA to express A on a leaf mass, or metamer mass basis depending on the calculation. This yielded the estimated specific daily carbon gain of a leaf, Aest, μmol g−1 d−1.
PBT (d) was computed as the ratio of CC versus the specific daily carbon gain as:
| (5) |
where 72/180 is the ratio of the molar mass of glucose and carbon in glucose and 12 is the molar mass of carbon. PBT was computed for leaf lamina as well as for the whole metamer.
Optimal leaf longevity
Lopt (Kikuzawa, 1995; Kikuzawa and Ackerly, 1999) was computed as:
| (6) |
where Aest is the specific daily carbon gain of young leaves; and b is the time when Aest declines to zero.
b was estimated from the time course of Asat. It was assumed that the decline was linear and that Asat was a stable fraction of Aest. PBT and Lopt were computed for leaf lamina as well as for whole metamers.
Statistical analyses
All statistical analyses were performed with STATISTICA (Kernel Version 7.0, StatSoft, Tulsa, OK, USA). Data were log transformed when required to respect the conditions for normality and variance homogeneity (tested with the Shapiro–Wilk and Levene tests). Differences among species, treatments, and interactions were analysed by a two-way analysis of variance (ANOVA) using a full factorial design. All regressions and principal component analyses (PCAs) were applied to mean values for each species/treatment combination. To test whether species ranking was stable among treatments, Kendall's coefficient of concordance (τ) was computed. A variance analysis was used to identify the main source of variation of PBT, PBTmet, Lopt, and Loptmet first under 20% relative irradiance and then across treatments. The total variance was decomposed into (i) interspecific variance (Varinter) and (ii) intraspecific variance (Varintra). Equations 5 and 6 were used, and CC was decomposed into specific cost (per unit mass) and LMA (to obtain CC per unit leaf area):
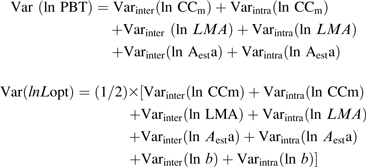 |
It was assumed that the interaction factors were negligible and that the variances were additive. As can be seen in Table 3, the interaction factors were small when compared with the main effect, and interfere only marginally in this analysis.
Table 3.
Results from a two-way ANOVA for the effects of two factors, species (13 levels) and relative irradiance (three levels) and their interaction. See table 1 for symbols and abbreviations. N=8–10 individuals per species×irradiance treatments. F-values and probability are displayed (*P ≤0.05; **P ≤0.01, and ***P ≤0.001). All variables were log10 transformed prior to the analysis, with the exception of specific-CC and LMA. Mean values (± 95% CI) are displayed for the three irradiance levels. Significant differences at P <0.05 are indicated with different letters. Kendall's coefficient of concordance τ is provided for mean species values between 5% and 20% relative irradiance.
| Species (S) | Irradiance (I) | Sp×I | 5% | 10% | 20% | τ (20% versus 5%) | |
| Specific-CC lamina (g g−1) | 98.6*** | 16.5*** | 3.42*** | 1.47±0.02 a | 1.50±0.02 b | 1.46±0.02 a | 0.64** |
| Specific-CC petioles (g g−1) | 173*** | 25.2*** | 4.01*** | 1.31±0.02 a | 1.34±0.02 b | 1.34±0.02 b | 0.77*** |
| Specific-CC stem (g g−1) | 37.6*** | 4.48*** | 1.56 | 1.29±0.02 a | 1.29±0.02 a | 1.31±0.02 b | 0.62** |
| Specific-CC metamer (g g−1) | 111*** | 5.57*** | 2.98*** | 1.39±0.02 a,b | 1.48±0.04 a | 1.38±0.02 b | 0.77*** |
| LMA (g m−2) | 86.6*** | 271*** | 6.61*** | 45.8±2.3 a | 56.4±3.2 b | 73±4.2 c | 0.85*** |
| PMA (g m−2) | 296*** | 168*** | 3.08*** | 13.2±1.1 a | 17.3±1.5 b | 22.6±2.4 c | 0.87*** |
| SMA (g m−2) | 29.3*** | 74.5*** | 4.52*** | 23.7±5.4 a | 39.0±9.4 b | 75.5±15 c | 0.67** |
| MMA (g m−2) | 38.7*** | 150*** | 4.23*** | 80.0±8.0 a | 108±12 b | 166±18 c | 0.56** |
| CC of lamina (g m−2) | 93.0*** | 231*** | 3.51*** | 67.1±3.2 a | 84.3±4.7 b | 106±6.2 c | 0.69*** |
| CC of metamers (g m−2) | 50.4*** | 162*** | 4.07*** | 107±9.8 a | 143±15 b | 210±22 c | 0.67** |
| Mean leaf area (cm2) | 354*** | 6.70*** | 2.35*** | 432±80 a | 468±87 a | 412±81 b | 0.95*** |
| Asata (μmol m−2 s−1) | 26.9*** | 49.6*** | 2.56*** | 5.36±0.4 a | 6.14±0.4 b | 7.53±0.3 c | 0.46* |
| Asatm (nmol g−1 s−1) | 37.8*** | 6.51** | 2.39*** | 124±9.3 a | 119±10 a,b | 111±9.4 b | 0.56** |
| Aest m (μmol g−1 d−1) | 57.6*** | 249*** | 4.67*** | 1.46±0.1 a | 2.08±0.1 b | 2.62±0.2 c | 0.62** |
| Leaf life span (d)a | _ | _ | _ | >780 | >780 | 446 | 0.66** |
| b (d) | _ | _ | _ | 678±53 | 635±41 | 479±28 | 0.21 |
| PBT of lamina (d) | 54.4*** | 237*** | 4.44*** | 37.6±2 a | 27.0±2 b | 21.3±2 c | 0.28 |
| Lopt (d) | 321*** | 544*** | 15.4*** | 223±12 a | 182±10 b | 141±7.5 c | 0.44* |
| PBT of metamers (d) | 36.2*** | 37.5*** | 4.29*** | 60.0±5.5 a | 45.8±5.0 b | 41.0±4.7 c | 0.38 |
| Lopt for metamers (d) | 190*** | 120*** | 6.28*** | 265±23 a | 225±21 b | 186±15 c | 0.44* |
Median value of LLS for each irradiance level instead of mean values.
Linear regression and PCA were applied to median value of LLS under the highest irradiance for 10 species only: in the other treatments, LLS could not be estimated due to lack of leaf shedding.
Results
Construction cost
The leaf mass-to-area ratio (LMA) varied 3-fold across species under 20% relative irradiance (38.2–119.3 g m−2), while individual leaf area ranged from 27 to 1447 cm2 (Table 3 and Fig. 2). Metamer mass to leaf area ratio and its components varied similarly. Significant interspecific differences were observed in C, N, and ash content among leaf lamina, petioles, and stems (not shown).
Fig. 2.

Effects of relative irradiance on: (a) leaf mass to area ratio (LMA, g m−2); specific construction costs (g glucose g−1) of (b) leaf lamina (CCLm) and (c) whole metamers (CCmetm); (d) metamer mass to leaf area ratio (MMA, g m−2); construction cost scaled to leaf area (g glucose m−2) of (e) leaf lamina (CCLa) and (f) metamers (CCmeta). Means (±95% CI) for the 13 studied species (see Table 2 for a list of abbreviations) and for three levels of relative irradiance: 5% (filled squares), 10% (shaded squares), and 20% (open squares).
Specific-CC was larger in leaf lamina (1.48±0.01 g glucose g−1, mean ± 95% CI) than in petioles (1.33±0.01) and stems (1.29±0.01). Specific-CC varied across species at leaf lamina and metamer level (1.25–1.55 g glucose g−1 for the latter; Table 3, Fig. 2). When scaled to leaf area, CC displayed an even larger interspecific variability. It ranged from 52.5±5.3 (B. guianensis) to 183±28.4 g glucose m−2 (Pouteria sp.) for leaf lamina, and from 127±25.9 g glucose m−2 (B. guianensis) to 416±93.4 g glucose m−2 (Pradosia cochlearia) for whole metamers (Fig. 2).
An irradiance-elicited plasticity was detected for some components of CC. Specific-CC of leaf lamina, petioles, and stems did not display any consistent trend with irradiance due to a large interaction with species effects. For instance, in B. guianensis, specific-CC was 1.45±0.05 g glucose g−1 under the lowest and 1.37±0.08 g glucose g−1 under the highest irradiance, while in Vouacapoua americana it remained stable at 1.63±0.06 g glucose g−1. Petiole, stem, and lamina mass to leaf area ratio displayed a large irradiance-elicited plasticity and increased with irradiance in all species. This effect resulted in large increases of CC of leaves and metamers with relative irradiance (Table 3, Fig. 2). Kendall's coefficient of concordance (τ) between the extreme irradiance treatments was always highly significant (Table 3). Nevertheless, interactions were detected for several variables, but they usually remained much smaller than the main effects.
Net CO2 assimilation and PBT
Area- (Asata) and mass-based (Asatm) light-saturated net CO2 assimilation ranged from 3.8 to 10.9 μmol m−2 s−1 and from 72.9 to 184 nmol g−1 s−1 across species in the highest relative irradiance treatment. The highest Asatm was found in Hymenaea courbaril, B. guianensis, and C. obtusa, and the lowest in Pouteria sp. and P. cochlearia. Asata increased with irradiance (Fig. 3c). while Asatm showed no consistent trend (Table 3). The estimated specific daily carbon gain of young leaves, Aest (μmol CO2 g−1 d−1), increased greatly with irradiance in addition to an important interspecific variability (Table 3).
Fig. 3.

Variation with relative irradiance of (a) leaf life span (LLS, days), (b) metamer payback time (PBTmet, days), (c) area-based light-saturated net CO2 assimilation rate of young leaves (Asata, μmol m−2 s−1), (d) time when the photosynthesis rate becomes zero, b (days), and (e) optimal leaf longevity (Loptmet, days). Values are given for the 13 studied species (see Table 2 for abbreviations) and for three levels of relative irradiance: black, 5%; grey, 10%; and white, 20%. Mean values (±95% CI) for all parameters except LLS, for which medians are displayed. The end of the experiment is indicated by a line at 780 d.
PBT of leaf lamina and of metamers displayed a large interspecific variability and an even larger irradiance-elicited plasticity. As expected, both were shorter under the highest irradiance (Table 3, Fig. 3b). PBT for metamers ranged from 24.4±4.4 d (H. courbaril) to 81.5±14.7 d (P. cochlearia). Significant interactions occurred between species and irradiance effects, and Kendall's τ for the comparison of lowest and highest irradiance was not significant. These interaction effects were the largest recorded across the whole data set.
In the long run, Asata declined with time, and dropped to almost zero at a time b that depended on species and relative irradiance (Fig. 4). Under the lowest irradiance, b ranged between 190 d (C. obtusa) and 1341 d (Eperua falcata, Fig. 3d).
Fig. 4.

Course of light-saturated net CO2 assimilation rate (Asata, μmol CO2 m−2 s−1) with leaf age (days) in Amanoa guianensis grown under three relative irradiance levels (∼5, 10, and 20%). Linear regressions yielded values of the time when Asat declined to zero (b, days) of 549, 489, and 455 d under 5, 10, and 20% relative irradiance.
Leaf life span
In many leaf cohorts, only a small fraction of the leaves was shed at the end of the experiment. LLS was therefore >780 d in 10 of the species under the lowest irradiance, and exceeded the duration of the experiment (Fig. 3a). In the two pioneers (B. guianensis and C. obtusa), LLS remained below 200 d whatever the irradiance. None of the leaves of the heliophilic C. procera, of the shade-tolerant Pouteria sp., and of V. americana was shed after 780 d. Among the 13 species, 3, 6, and 10 did not shed any leaves under the highest, medium, and smallest irradiance. LLS was always much larger than PBT under all levels of relative irradiance.
Optimal leaf longevity
Under high irradiance, Lopt computed from leaf lamina CC ranged from 64 d (B. guianensis) to 208 d (V. americana, Table 2). It increased under lower irradiance but remained always much larger than PBT. When computed from whole metamer CC it was much larger and ranged from 97 d (B. guianensis) to 257 d (P. cochlearia) under the highest irradiance. It increased with LMA, whatever the irradiance, and was negatively correlated to area-based but not to mass-based values of Asat or to area-based values of CCmet (Table 4). In all species, irrespective of relative irradiance, computed Lopt was shorter than recorded LLS (Fig. 3).
Table 4.
Pearson's correlation coefficients between leaf life span (LLS, d) or optimum leaf longevity computed for whole metamers (Loptmet), and leaf traits
| LLS (n=10) | Loptmet | |||
| Relative irradiance | 20% | 5% | 10% | 20% |
| Trait | ||||
| LMA (g m−2) | 0.55 | 0.80*** | 0.75** | 0.59* |
| MMA (g m−2) | 0.49 | 0.73** | 0.45 | 0.38 |
| Specific-CC lamina (g g−1) | 0.30 | –0.01 | –0.09 | 0.30 |
| Specific-CC petioles (g g−1) | 0.82** | 0.75** | 0.52 | 0.64* |
| Specific-CC stem (g g−1) | 0.81** | 0.72** | 0.27 | 0.62* |
| Specific-CC metamer (g g−1) | 0.56 | 0.30 | 0.38 | 0.46 |
| Area-based CC metamer (g m−2) | 0.61 | 0.77** | 0.67* | 0.60* |
| Specific Asat (nmol g−1 s−1) | –0.66* | –0.73** | –0.71** | –0.89*** |
| Nm (mg g−1) | –0.78** | –0.80*** | –0.78** | –0.76** |
| Area-based Asat (nmol m−2 s−1) | –0.24 | 0.07 | –0.38 | –0.44 |
| Lamina PBT (d) | 0.67* | 0.77** | 0.90*** | 0.87*** |
| Metamer PBT (d) | 0.61 | 0.71** | 0.86*** | 0.78*** |
| b (d) | 0.83** | 0.87*** | 0.87*** | 0.71** |
| Lamina-based Lopt (d) | 0.85** | _ | _ | _ |
| Metamer-based Lopt (d) | 0.87*** | _ | _ | _ |
For the three levels of relative irradiance (5, 10, and 20%), simple linear regressions were applied using species means for each variable. For LLS, the regression was only computed for the 10 species at 20% relative irradiance for which LLS could be estimated.
Probabilities are indicated as: *P ≤0.05; **P ≤0.01; ***P ≤0.001.
Sensitivity analyses of PBT and Lopt
A sensitivity analysis (decomposition of the variance) revealed that, under 20% relative irradiance, 94.2% of the variance of leaf lamina PBT was explained by the variance of LMA (Table 5). Under a given relative irradiance, the interspecific variance was the largest contributor, while across irradiance treatments, the intra-specific variance that represents the irradiance-elicited plasticity of LMA, was the largest contributor. Similarly, 51% of the variance of whole metamer PBT was explained by the variance of specific-CC of metamers under 20% relative irradiance, and 77% across all irradiance treatments, which again shows the importance of irradiance-elicited plasticity of structure (i.e. of specific-CC of metamers and of LMA). Area-based photosynthetic carbon gain as well as specific-CC of tissues always played a minor role in the variance of PBT.
Table 5.
Percent of total variance of (i) payback-time for leaf lamina (PBT) or metamers (PBTmet) and (ii) optimal leaf longevity for leaf lamina (Lopt) and metamers (Loptmet), that is explained by the variance of specific construction cost of leaf lamina or metamers (CCLm or CCmetm), daily net CO2 assimilation (Aesta), leaf mass-to-area ratio (LMA) or time-span till light saturated CO2 assimilation reaches 0 (b). Inter-specific, intra-specific and total contributions were identified. Results obtained (A) under 20% relative irradiance and (B) under all irradiance treatments.
| 20% relative irradiance | Leaf lamina | ||||||
| PBT | Lopt | ||||||
| CCLm | Aesta | LMA | CCLm | Aesta | LMA | b | |
| Interspecific component | 3.23 | 0.60 | 79.2 | 1.34 | 0.25 | 32.7 | 58.7 |
| Intraspecific component | 1.36 | 0.62 | 15.0 | 0.56 | 0.26 | 6.20 | _ |
| Total | 4.59 | 1.22 | 94.2 | 1.90 | 0.51 | 38.9 | 58.7 |
| Metamer | |||||||
| PBTmet | Lopt met | ||||||
| CCmetm | Aesta | LMA | CCmetm | Aesta | LMA | b | |
| Interspecific component | 30.9 | 0.31 | 40.8 | 17.9 | 0.18 | 23.5 | 42.2 |
| Intraspecific component | 20 | 0.32 | 7.73 | 11.5 | 0.18 | 4.5 | – |
| Total | 50.9 | 0.63 | 48.5 | 29.4 | 0.36 | 28.0 | 42.2 |
| All treatments | Leaf lamina | ||||||
| PBT | Lopt | ||||||
| CCLm | Aesta | LMA | CCLm | Aesta | LMA | b | |
| Interspecific component | 0.16 | 0.27 | 3.12 | 0.01 | 0.02 | 0.24 | 0.54 |
| Intraspecific component | 8.62 | 7.36 | 80.5 | 0.67 | 0.57 | 6.22 | 91.7 |
| Total | 8.77 | 7.63 | 83.6 | 0.68 | 0.59 | 6.46 | 92.3 |
| Metamer | |||||||
| PBTmet | Loptmet | ||||||
| CCmetm | Aesta | LMA | CCmetm | Aesta | LMA | b | |
| Interspecific component | 0.31 | 0.07 | 0.78 | 0.08 | 0.02 | 0.20 | 0.44 |
| Intraspecific component | 77 | 1.83 | 20 | 19.4 | 0.46 | 5.04 | 74.4 |
| Total | 77.3 | 1.90 | 20.8 | 19.5 | 0.48 | 5.23 | 74.8 |
The variance of Lopt was mainly explained by that of b under all conditions. LMA contributed significantly under a 20% relative irradiance, and very little across irradiance treatments. b was slightly less predominant at the metamer level, and specific-CC contributed significantly, but still much less than b. Area-based photosynthetic carbon gain played no detectable role in the variance of Lopt.
Interspecific correlations among traits
Under 20% relative irradiance LLS was recorded for 10 species. It was tightly and positively correlated to Lopt and b among species (Table 4, Fig. 5) and negatively to mass-based Asat and Nm. No correlation was evidenced with area-based Asat. LLS was only loosely correlated with CC (no correlation except with specific-CC of petioles and stems). Similarly, LLS was loosely correlated with leaf lamina PBT, and not at all with whole metamer PBT or LMA. Under 10% relative irradiance, LLS was only recorded for six species, but the strong correlation between LLS and b observed under the highest irradiance treatment was maintained.
Fig. 5.

Relationship between b, the delay until the net CO2 assimilation rate under saturating irradiance (Asat) declines to zero, and LLS, the leaf life span, under two levels of relative irradiance: triangles, 20%; squares, 10%. LLS could not be estimated in the three treatments (see Fig. 3a). Only the species for which LLS data was available in the highest (n=10) and intermediate (n=6) irradiance treatment were used in a regression analysis.
Lopt displayed correlation patterns different from those of LLS. In contrast to LLS, it was tightly correlated with LMA, particularly under low irradiance. It was also tightly correlated with PBT, Asatm, and much less with CC of lamina and of whole metamers (Table 4).
A PCA was applied to the data of the 10 species that produced estimates of LLS under high irradiance. This was done at the leaf lamina level [variables: LMA, Nm, Asatm, specific-CC, b, and LLS; supplementary variables: PBT, Lopt, and relative growth rate (RGR)] and at the metamer level (variables: MMA, Nmetm, specific-CC, b, LLS, and Asatm; supplementary variables: PBTmet, Loptmet, and RGR; Fig. 6 and Appendix 1). The first two axes explained 88% of the observed variability for lamina and 89% for metamers. For leaf lamina, the main contributors to axis 1 were Nm and Asatm (positive) and LMA and LLS (negative), and specific-CC was the main contributor to axis 2. For metamers, the main contributors to axis 1 were Nmetm and Asatm (positive) and LLS (negative), and CCmetm was the main contributor to axis 2. Species with high LLS displayed low Asatm and Nm. b was less tightly correlated with axis 1 but still had a very significant impact on LLS. The distribution of species on the factor plane clearly separated C. obtusa and B. guianensis from the other species. The latter were spread along axis 2, with little variation of LLS.
Fig. 6.

Principal component analysis of seven traits for 10 studied species, under a relative irradiance level of 20%. Traits were recorded at leaf lamina level (A) or metamer level (B). Traits were: leaf mass to area ratio (LMA), metamer mass to leaf area ratio (MMA), leaf thickness, leaf density, mass-based light-saturated assimilation rate (Asatm), total N content per unit leaf (Nm), or metamer dry mass (Nmetm), specific-CC of leaf lamina (CCLm) or metamer (CCmetm), and leaf life span (LLS). Additional variables (with asterisks) were payback time (PBT or PBTmet), optimal leaf longevity (Lopt or Loptmet), and the relative growth rate (RGR). Projection of the variables on the factor planes (1×2, left) and of the species on the same plane (right). Pioneer species are indicated by filled circles. For species abbreviations see Table 2. For eigenvalues and factor scores see Appendix 1.
Discussion
CC for leaves and metamers: interspecific variability and irradiance-elicited plasticity
The cost for deploying leaf area depends on the specific-CC of (i) leaf tissues (ii) and of support structures (e.g. petiole, twigs); and (iii) on dimensional properties such as the supporting biomass/leaf area ratio. Specific-CC was close to values reported by Poorter and Villar (1997) and higher in leaf lamina than in petioles and stems, probably due to a higher protein content (Poorter et al., 2006). Specific-CC varied among species by ±9% under a given irradiance, possibly due to differences in protein, lignin, and mineral contents (Gary et al., 1998; Barthod and Epron, 2005). Pioneer species such as C. obtusa and B. guianensis did not differ from the other species in this respect, which was unexpected and contradicts some earlier results. For instance, Williams et al. (1989) explored the variability within a genus (Piper sp.) and found larger specific-CC in the species growing in gaps than in the understorey.
In comparison, the irradiance-elicited plasticity of specific-CC was very small, and differed among species. The most frequent trend was a very moderate increase or stability with irradiance. Earlier findings evidenced slight increases (<10% between extreme values; Poorter et al., 2006) or stability (Williams et al., 1989; Niinemets, 1999; Barthod and Epron, 2005). Irradiance-elicited changes may be due to: (i) Nm (and the associated cost for nitrate reduction); Nm declined slightly with increasing irradiance possibly due to a dilution effect by accumulating carbohydrates; (ii) lignin content which increases with irradiance at the expense of cellulose and hemicelluloses (Niinemets and Kull, 1998); and (iii) non-structural carbohydrate accumulating under high irradiance and decreasing specific-CC (Griffin et al., 1996). As a result, these independent variations among different compounds probably cause specific-CC to be almost insensitive to irradiance (Villar et al., 2006).
When scaled to leaf area, leaf and metamer CC displayed a large interspecific variability (by a factor of 4 under 20% relative irradiance) and increased dramatically with irradiance. This was the result of a large and well documented plasticity in LMA (Givnish, 1988; Valladares et al., 2000; Rozendaal et al., 2006), and of the variation of the ratio of petiole mass or stem mass to leaf area (3.4–41.2 g m−2 and 12.1– 211 g m−2, respectively). It can be concluded that the supporting tissue/assimilating area ratio, and not the tissue composition (i.e. specific-CC), is the main source of plasticity in area-based CC. The amplitude of the response to irradiance differed slightly among species, although Kendall's τ remained significant. The two pioneers, C. obtusa and B. guianensis, displayed the lowest area-based leaf and metamer CC but exhibited a similar plasticity to shade-tolerant species.
The observed interspecific differences, and in particular the lower CC recorded in the two pioneers, were to a large extent due to differences in the supporting tissue/leaf area ratio rather than to differences in specific-CC. The observed irradiance-elicited plasticity in leaf and metamer CC was almost exclusively due to changes in the supporting tissue/leaf area ratio.
PBT for leaves and metamers
The computation of PBT implied several simplifying asumptions: (i) the time stability of the irradiance of leaves, which underestimates the potential self-shading due to the accumulation of new leaves; (ii) a constant photosynthetic capacity while it declined with leaf age (see Fig. 4), but probably not fast enough to affect the estimates significantly; (iii) the neglect of potential photosynthesis of support organs; and (iv) the setting of metamer respiration during the night to 7% of the net diurnal carbon gain.. The impact of the two first assumptions was probably small given the slow growth of most species and the relative short time span covered by the computation. Photosynthesis by support tissues, although not negligible, generally has only a minor impact on whole plant carbon assimilation (Damesin, 2003). The assumption about respiration is probably more critical, but, given the small amount of available data in tropical species, there was no way to use more specific data. The values displayed in this study are therefore rather reliable, particularly for comparison purposes.
There are to date only a few explicit PBT computations in the literature. Poorter et al. (2006) obtained values of ∼60 d for shade leaves of temperate deciduous trees, and much shorter values for leaves growing under high irradiance. The present values are significantly longer, probably due to the low irradiance received by the saplings in the present experiment, as well as to the relatively low photosynthetic capacity displayed by the leaves. The longest PBT was 110 d (Amanoa guianensis under the lowest irradiance).
Three components may explain the inter- and intraspecific variability of leaf lamina and metamer PBT: (i) specific-CC; (ii) actual photosynthesis; and (iii) structure (the supporting tissue/leaf area ratio). Despite the existing interspecific variability of photosynthetic capacity (see also Coste et al., 2005, 2010) and of specific-CC, the main driver for the variability of PBT was the leaf area to support structure ratio. Even the small contribution of the specific-CC of metamers was not due to differences in tissue specific-CC, but to differences in the fraction of support organs that display smaller specific-CC than lamina.
When all irradiance treatments were merged, the intraspecific component of the variance (i.e. the irradiance-elicited plasticity) became a major component of the general variance at the leaf and metamer scale. Again, the contribution of area-based photosynthetic assimilation was small (<10%). LMA was still the dominant contributor at the leaf level, and the larger contribution of specific-CC at the metamer level was due to changes in structure as discussed above. The results therefore support the assumption that the interspecific variability as well as the irradiance-elicited plasticity of PBT were mostly due to the variability of the support tissues/photosynthetic area ratio, with a very small contribution of specific-CC. Similarly, area-based photosynthetic capacity had only a minor impact on PBT.
The range of relative irradiance levels used in the experiment was small (5–20%). Under a larger range, the weight of photosynthetic capacity would have increased, but it is unlikely that it would have overcome that of the relative contribution of support/assimilating tissues. This conclusion confirms and extends that of Poorter et al. (2006) who considered only leaf lamina.
Actual LLS
LLS may reach several years in some tropical rainforest tree species (Reich et al., 2004; Poorter and Bongers, 2006; Vincent, 2006), and, hence, LLS was longer than the 26 months of the experiment in several species. Despite this shortcoming, a large interspecific variability of LLS was evidenced in co-occurring species. LLS never exceeded 200 d in the two pioneers, while it ranged from 300 d to >780 d in the other species. Reich et al. (2004) found the median LLS to range from 76 d (Cecropia ficifolia) to 1693 d (Protium spp.) in adult Amazonian trees. Such a variability is paralleled by an interspecific variability of the rate of leaf production and height growth. Fast growing trees are expected to display smaller LLS due to the rapid onset of self-shading (Reich et al., 2004; Poorter and Bongers, 2006). However, no correlation was found between height growth and LLS, at least under the highest irradiance (data not shown).
LLS displayed a large irradiance-elicited plasticity in all species and increased under low irradiance. Longer LLS under low irradiance reveals slower ageing and a slower decrease in photosynthetic metabolism (Vincent, 2006), which in turn could be related to N dynamics in leaves. For instance, a faster resorption of leaf N, under N limitation, results in smaller LLS (Marty et al., 2009, 2010). Similarly, Laclau et al. (2008) showed that K fertilization of a Eucalypt plantation resulted in longer LLS which triggered enhanced productivity. Unfortunately, the present data do not allow any further speculation about the signal triggering changes in LLS among irradiance treatments. Investigations of N dynamics in leaves as well as local irradiance and their impact on LLS would be required.
Despite the large variability in LLS among species and biomes, a general trade-off has been evidenced between trait values favouring nutrient conservation (long LLS and high LMA) versus a quick acquisition of resources (high Nm, photosynthesis rate, and respiration). In general, species with large LMA achieve greater average LLS in a variety of habitats (Chabot and Hicks, 1982; Reich et al., 1997). In the present case, LLS was not correlated to LMA under high irradiance, possibly due to the small number of species. The data set did not allow testing of the correlation under the lowest irradiance. Earlier predictions suggested specific-CC and LLS to be correlated, due to the cost for the secondary compounds involved in defence against herbivory that enable survival of leaves in the long run (Chabot and Hicks, 1982). This was not the case here, as LLS was independent of specific-CC at the lamina and metamer level, as in Williams et al. (1989).
Values of PBT for lamina, but not metamers, matched the variability of LLS, in contrast to earlier observations (Navas et al., 2003). Anyway, PBT for metamers was much smaller than LLS even under the lowest irradiance; mean values represented only 12% and 13% of LLS under 20% and 15% relative irradiance. None of the species was in danger of a severe imbalance between carbon use and assimilation. Much smaller levels of irradiance would be required to see the time-integrated carbon balance drop below zero. It would nevertheless be very useful to integrate carbon use by stems and roots to obtain a more integrated view of whole sapling carbon balance, and of the adaptation/acclimation to shade.
LLS was significantly correlated to the two parameters describing photosynthetic carbon assimilation over leaf life: the mass-based photosynthetic capacity of young leaves (Asatm) and the rate of decline of this capacity with leaf ageing, described by b, the time lag after which Asatm is close to zero. Such a decline in carbon assimilation with time is caused by: (i) ontogenic changes of photosynthetic capacity in ageing leaves and (ii) the rates at which new leaves are produced and overshadow older ones. Few data are available to test the relative contribution of ageing versus self shading on b (Ackerly, 1999).
The observed negative correlation between Asatm and LLS supports the hypothesis of a trade-off between mass-based photosynthetic capacity and LLS probably mediated by the mass-based N content (Reich et al., 1997; Givnish, 2002). Nevertheless, some of the species with LLS >780 d also displayed large photosynthetic capacities. Photosynthetic capacity at young stages may therefore not be the main determinant of LLS, while b could play a major role. Indeed, under the highest irradiance, values of b ranged from 186 d (in the pioneer species) to 850 d, and mean values of b/LLS were ∼1.2 under 20% and 10% relative irradiance. Values of b were tightly correlated with LLS as predicted earlier (Kitajima et al., 1997, 2002), and b therefore seems to be an excellent predictor of LLS.
Optimality of LLS?
Lopt for leaf lamina or whole metamers ranged from 64 d to 208 d for the former and from 98 d to 260 d for the latter. Lopt was tightly correlated to LLS. Moreover, b was the main source of variation among species for Lopt for leaf lamina or whole metamers: the rate of decline of carbon gain is probably the most important factor for Lopt, as it is for LLS. Nevertheless, contrary to model predictions, Lopt was very small compared with LLS in all species and irradiance treatments (∼50%), similar to what was reported by Ackerly (1999) and Kikuzawa and Ackerly (1999).
There are indeed some shortcomings in this widely cited optimality model. Structural leaf carbohydrates are not retranslocable, whereas this resource should be re-allocated among leaves to maintain a constant marginal return. The model ignores the impact of the rate of production of new leaves (source of overshading) on Asat and b. Ackerly (1999) proposed an optimization model based on leaf position-dependent assimilation, in which leaf production, rather than C gain, is maximized. This model predicts that leaves should be kept until the diurnal carbon balance declines to zero. Recently, Reich et al. (2009) found that leaves are shed only when they can no longer pay for (i) their own respiration and (ii) for the maintenance required to support their activities (respiration at the whole plant level). In consequence, leaves are shed when net photosynthetic assimilation is very low. In the present case, LLS was closer to b than to Lopt and this confirms the predictions of Ackerly (1999) and the findings of Reich et al. (2009). Data on whole plant carbon balance would nevertheless be required to settle the debate, and an improved understanding of the control of leaf senescence is required, as emphasized by Anten and Poorter (2009).
Conclusions
The CC of leaves and supporting tissues differed among species, but no clear ranking was detected between pioneer and shade-tolerant species. The variability in CC of metamers was largely due to the amount of supporting tissues per unit leaf area and not to the specific-CC of leaf lamina. LLS and PBT were almost independent of specific-CC. They displayed a large irradiance-elicited plasticity in all species and were larger in shaded individuals. PBT was correlated to LLS, but remained much smaller even under the lowest level of irradiance. LLS was tightly correlated with the rate of decline of photosynthetic capacity with age, and rather close to the age at which photosynthesis rates approached zero values. Furthermore, the results showed that leaves are shed when net photosynthetic assimilation is almost zero, which contradicts the optimization theory of Kikuzawa (1991).
Acknowledgments
SC was supported by a PhD grant from the French government. Jacqueline Marchand (UMR EEF) conducted all carbon, nitrogen, and ash analyses. Gregory Sonnier, Pascal Imbert, Laetitia Etienne, Saintano Dufort, Marcel Blaize, Jean-Louis De Kerpeztron, and Henry Grootfaam helped throughout the experiment at Kourou. Jean-Yves Goret and Christopher Baraloto (UMR ECOFOG) provided valuable help in the botanical identification of trees in the forest, and in the choice and the growth of species. Fruitful discussions with Eric Marcon, Christopher Baraloto, Tancrède Alméras, and François Morneau (UMR ECOFOG, Kourou), Pierre Montpied, and Irène Hummel (UMR EEF, Nancy) are gratefully acknowledged.
Appendix 1. Results of a principal component analysis of seven traits for 10 studied species, under a relative irradiance of 20%
Traits were recorded at the leaf lamina (A) or metamer level (B): factor scores of the variables, eigenvalues, and percentage variance were explained by the first two principal axis. The additional variables were not taken into account for the calculation of the eigenvalues.
| (A) Leaf lamina level | Factor 1 | Factor 2 | (B) Metamer level | Factor 1 | Factor 2 |
| Variable | Variable | ||||
| LMA | –0.847 | 0.444 | MMA | –0.656 | 0.714 |
| Nm | 0.921 | –0.255 | Nmetm | 0.785 | –0.538 |
| CCLm | –0.092 | –0.965 | CCme m | –0.373 | –0.906 |
| Asatm | 0.846 | –0.186 | Asatm | 0.800 | –0.117 |
| LLS | –0.895 | –0.283 | LLS | –0.955 | –0.203 |
| b | –0.794 | –0.536 | b | –0.763 | –0.592 |
| Supplementary variable | Supplementary variable | ||||
| PBT | –0.887 | 0.162 | PBTmet | –0.764 | 0.443 |
| Lopt | –0.952 | –0.221 | Loptmet | –0.956 | 0.034 |
| RGR | 0.742 | 0.013 | RGR | 0.666 | 0.118 |
| Eigenvalues | 3.72 | 1.59 | Eigenvalues | 3.32 | 2.03 |
| % variance | 62.0 | 26.6 | % variance | 55.3 | 33.8 |
References
- Ackerly D. Self-shading, carbon gain and leaf dynamics: a test of alternative optimality models. Oecologia. 1999;119:300–310. doi: 10.1007/s004420050790. [DOI] [PubMed] [Google Scholar]
- Anten NPR, Poorter H. Carbon balance of the oldest and most-shaded leaves in a vegetation: a litmus test for canopy models. New Phytologist. 2009;183:1–3. doi: 10.1111/j.1469-8137.2009.02888.x. [DOI] [PubMed] [Google Scholar]
- Barthod S, Epron D. Variations of construction cost associated to leaf area renewal in saplings of two co-occurring temperate tree species (Acer platanoides L. and Fraxinus excelsior L.) along a light gradient. Annals of Forest Science. 2005;62:545–551. [Google Scholar]
- Baruch Z, Pattison RR, Goldstein G. Responses to light and water availability of four invasive Melastomataceae in the Hawaiian islands. International Journal of Plant Sciences. 2000;161:107–118. doi: 10.1086/314233. [DOI] [PubMed] [Google Scholar]
- Chabot BF, Hicks DJ. The ecology of leaf life spans. Annual Review of Ecology and Systematics. 1982;13:229–259. [Google Scholar]
- Coley PD. Herbivory and defensive characteristics of tree species in a lowland tropical forest. Ecological Monographs. 1983;53:209–233. [Google Scholar]
- Coste S, Roggy JC, Imbert P, Born C, Bonal D, Dreyer E. Leaf photosynthetic traits of 14 tropical rain forest species in relation to leaf nitrogen concentration and shade tolerance. Tree Physiology. 2005;25:1127–1137. doi: 10.1093/treephys/25.9.1127. [DOI] [PubMed] [Google Scholar]
- Coste S, Roggy J-C, Sonnier G, Dreyer E. Similar irradiance-elicited plasticity of leaf traits in saplings of 12 tropical rainforest tree species with highly different leaf mass to area ratio. Functional Plant Biology. 2010;37:342–355. [Google Scholar]
- Damesin C. Respiration and photosynthesis characteristics of current-year stems of Fagus sylvatica: from the seasonal pattern to an annual balance. New Phytologist. 2003;158:465–475. doi: 10.1046/j.1469-8137.2003.00756.x. [DOI] [PubMed] [Google Scholar]
- Gary C, Bertin N, Frossard JS, Le Bot J. High mineral contents explain the low construction cost of leaves, stems and fruits of tomato plants. Journal of Experimental Botany. 1998;49:49–57. [Google Scholar]
- Givnish TJ. Adaptation to sun and shade: a whole plant perspective. Australian Journal of Plant Physiology. 1988;15:63–92. [Google Scholar]
- Givnish TJ. Adaptive significance of evergreen vs. deciduous leaves: solving the triple paradox. Silva Fennica. 2002;36:703–743. [Google Scholar]
- Griffin KL, Winner WE, Strain BR. Construction cost of loblolly and ponderosa pine leaves grown with varying carbon and nitrogen availability. Plant, Cell and Environment. 1996;19:729–739. [Google Scholar]
- Hikosaka K. Leaf canopy as a dynamic system: ecophysiology and optimality in leaf turnover. Annals of Botany. 2005;95:521–533. doi: 10.1093/aob/mci050. [DOI] [PMC free article] [PubMed] [Google Scholar]
- Kikuzawa K. A cost–benefit analysis of leaf habit and leaf longevity of trees and their geographical pattern. American Naturalist. 1991;138:1250–1263. [Google Scholar]
- Kikuzawa K. The basis for variation in leaf longevity of plants. Vegetatio. 1995;121:89–100. [Google Scholar]
- Kikuzawa K, Ackerly D. Significance of leaf longevity in plant. Plant Species Biology. 1999;14:39–45. [Google Scholar]
- Kitajima K, Mulkey SS, Samaniego M, Wright SJ. Decline of photosynthetic capacity with leaf age and position in two tropical pioneer tree species. American Journal of Botany. 2002;89:1925–1932. doi: 10.3732/ajb.89.12.1925. [DOI] [PubMed] [Google Scholar]
- Kitajima K, Mulkey SS, Wright SJ. Decline of photosynthetic capacity with leaf age in relation to leaf longevities for five tropical canopy tree species. American Journal of Botany. 1997;84:702–708. [PubMed] [Google Scholar]
- Laclau JP, Almeida JCR, Gonçalves JLM, Saint Andre L, Ventura M, Ranger J, Moreira RM, Nouvellon Y. Influence of nitrogen and potassium fertilization on leaf lifespan and allocation of above-ground growth in Eucalyptus plantations. Tree Physiology. 2008;29:111–124. doi: 10.1093/treephys/tpn010. [DOI] [PubMed] [Google Scholar]
- Le Roux X, Lacointe A, Escobar-Gutiérrez A, Le Dizès S. Carbon-based models of individual tree growth: a critical appraisal. Annals of Forest Science. 2001;58:469–506. [Google Scholar]
- Marty C, Lamaze T, Pornon A. Endogenous sink–source interactions and soil nitrogen regulate leaf life-span in an evergreen shrub. New Phytologist. 2009;183:1114–1123. doi: 10.1111/j.1469-8137.2009.02893.x. [DOI] [PubMed] [Google Scholar]
- Marty C, Lamaze T, Pornon A. Leaf life span optimizes annual biomass production rather than plant photosynthetic capacity in an evergreen shrub. New Phytologist. 2010;187:407–416. doi: 10.1111/j.1469-8137.2010.03290.x. [DOI] [PubMed] [Google Scholar]
- Mediavilla S, Escudero A. Leaf life span differs from retention time of biomass and nutrients in the crowns of evergreen species. Functional Ecology. 2003;17:541–548. [Google Scholar]
- Messier C, Doucet R, Ruel J-C, Claveau Y, Kelly C, Lechowicz MJ. Functional ecology of advance regeneration in relation to light in boreal forests. Canadian Journal of Forest Research. 1999;29:812–823. [Google Scholar]
- Molino J-F, Sabatier D. Tree diversity in tropical rain forests: a validation of the intermediate disturbance hypothesis. Science. 2001;294:1702–1704. doi: 10.1126/science.1060284. [DOI] [PubMed] [Google Scholar]
- Navas M-L, Ducout B, Roumet C, Richarte J, Garnier J, Garnier E. Leaf life span, dynamics and construction cost of species from Mediterranean old-fields differing in successional status. New Phytologist. 2003;159:213–228. doi: 10.1046/j.1469-8137.2003.00790.x. [DOI] [PubMed] [Google Scholar]
- Niinemets Ü. Energy requirement for foliage formation is not constant along canopy light gradients in temperate deciduous trees. New Phytologist. 1999;141:459–470. [Google Scholar]
- Niinemets Ü, Kull O. Stoichiometry of foliar carbon constituents varies along light gradients in temperate woody canopies: implications for foliage morphological plasticity. Tree Physiology. 1998;18:467–479. doi: 10.1093/treephys/18.7.467. [DOI] [PubMed] [Google Scholar]
- Penning De Vries FWT, Brunsting AHM, Van Laar HH. Products, requirements and efficiency of biosynthesis: a quantitative approach. Journal of Theoretical Biology. 1974;45:339–377. doi: 10.1016/0022-5193(74)90119-2. [DOI] [PubMed] [Google Scholar]
- Poorter H. Construction costs and payback time of biomass: a whole plant approach. In: Roy J, Garnier E, editors. A whole plant perspective on carbon–nitrogen interactions. The Hague, The Netherlands: Backhuys Publishers; 1994. pp. 111–127. [Google Scholar]
- Poorter H, Pepin S, Rijkers T, de Jong Y, Evans JR, Körner C. Construction costs, chemical composition and payback time of high- and low-irradiance leaves. Journal of Experimental Botany. 2006;57:355–371. doi: 10.1093/jxb/erj002. [DOI] [PubMed] [Google Scholar]
- Poorter H, Villar R. The fate of acquired carbon in plants: chemical composition and construction costs. In: Bazzaz FA, Grace J, editors. Plant resource allocation. San Diego: Academic Press; 1997. pp. 39–72. [Google Scholar]
- Poorter L, Bongers F. Leaf traits are good predictors of plant performance across 53 rain forest species. Ecology. 2006;87:1733–1743. doi: 10.1890/0012-9658(2006)87[1733:ltagpo]2.0.co;2. [DOI] [PubMed] [Google Scholar]
- Poorter L, Rozendaal DMA. Leaf size and leaf display of thirty-eight tropical tree species. Oecologia. 2008;158:35–46. doi: 10.1007/s00442-008-1131-x. [DOI] [PubMed] [Google Scholar]
- Reich PB, Falster DS, Ellsworth DS, Wright IJ, Westoby M, Oleksyn J, Lee TD. Controls on declining carbon balance with leaf age among 10 woody species in Australian woodland: do leaves have zero daily net carbon balances when they die? New Phytologist. 2009;183:153–166. doi: 10.1111/j.1469-8137.2009.02824.x. [DOI] [PubMed] [Google Scholar]
- Reich PB, Uhl C, Walters MB, Prugh L, Ellsworth DS. Leaf demography and phenology in Amazonian rain forest: a census of 40000 leaves of 23 trees species. Ecological Monographs. 2004;74:3–23. [Google Scholar]
- Reich PB, Walters MB, Ellsworth DS. From tropics to tundra: global convergence in plant functioning. Proceedings of the National Academy of Sciences, USA. 1997;94:13730–13734. doi: 10.1073/pnas.94.25.13730. [DOI] [PMC free article] [PubMed] [Google Scholar]
- Rozendaal DMA, Hurtado VH, Poorter L. Plasticity in leaf traits of 38 tropical tree species in response to light; relationships with light demand and adult stature. Functional Ecology. 2006;20:207–216. [Google Scholar]
- Sims DA, Pearcy RW. Scaling sun and shade photosynthetic acclimation of Alocasia macrorrhiza to whole-plant performance. 1. Carbon balance and allocation at different daily photon flux densities. Plant, Cell and Environment. 1994;17:881–887. [Google Scholar]
- Valladares F, Niinemets U. Shade tolerance, a key plant feature of complex nature and consequences. Annual Review of Ecology, Evolution, and Systematics. 2008;39:237–257. [Google Scholar]
- Valladares F, Wright SJ, Lasso E, Kitajima K, Pearcy RW. Plastic phenotypic response to light of 16 congeneric shrubs from a Panamanian rainforest. Ecology. 2000;81:1925–1936. [Google Scholar]
- Vertregt N, Penning De Vries FWT. A rapid method for determining the efficiency of biosynthesis of plant biomass. Journal of Theoretical Biology. 1987;128:109–119. [Google Scholar]
- Villar R, Robleto JR, De Jong Y, Poorter H. Differences in construction costs and chemical composition between deciduous and evergreen woody species are small as compared to differences among families. Plant, Cell and Environment. 2006;29:1629–1643. doi: 10.1111/j.1365-3040.2006.01540.x. [DOI] [PubMed] [Google Scholar]
- Vincent G. Leaf life span plasticity in tropical seedlings grown under contrasting light regimes. Annals of Botany. 2006;97:245–255. doi: 10.1093/aob/mcj023. [DOI] [PMC free article] [PubMed] [Google Scholar]
- Williams K, Field CB, Mooney HA. Relationships among leaf construction cost, leaf longevity, and light environment in rain forest plants of the genus. Piper. American Naturalist. 1989;133:198–211. [Google Scholar]