

Abstract
The data mining and pervasive sensing technologies found in smart homes offer unprecedented opportunities for providing health monitoring and assistance to individuals experiencing difficulties living independently at home. In order to monitor the functional health of smart home residents, we need to design technologies that recognize and track activities that people normally perform as part of their daily routines. One question that frequently arises, however, is how many smart home sensors are needed and where should they be placed in order to accurately recognize activities? We employ data mining techniques to look at the problem of sensor selection for activity recognition in smart homes. We analyze the results based on six data sets collected in five distinct smart home environments.
Keywords: Activity recognition, feature selection, feature construction, machine learning
1. Introduction
A convergence of technologies in data mining and pervasive computing as well as the increased accessibility of robust sensors and actuators has caused interest in the development of smart environments to emerge. Furthermore, researchers are recognizing that smart environments can assist with valuable functions such as remote health monitoring and intervention. The need for the development of such technologies is underscored by the aging of the population, the cost of formal health care, and the importance that individuals place on remaining independent in their own homes.
To function independently at home, individuals need to be able to complete Activities of Daily Living (ADLs) [18] such as eating, dressing, cooking, drinking, and taking medicine. Automating the recognition of activities is an important step toward monitoring the functional health of a smart home resident. When surveyed about assistive technologies, family caregivers of Alzheimer’s patients ranked activity identification and tracking at the top of their list of needs [19].
In response to this recognized need, researchers have designed a variety of approaches to model and recognize activities. The generally accepted approach is to model and recognize those activities that are frequently used to measure the functional health of an individual [25]. The challenge that researchers and practitioners face is deciding how many smart home sensors are needed and where they should be placed to perform this activity recognition task. This is not a straightforward decision. A greater density of sensors provides more pinpointed information on exactly where and when interactions with the environment occur. On the other hand, the addition of sensors imposes more energy consumption and cost constraints. In addition, when more sensors are used then the representation is more complex, thus a greater amount of training data is needed to accurately learn activity models. In this paper, we explore methods of selecting and positioning sensors in a smart environment and implement our approach in the context of the CASAS Smart Home project [17].
2. Related Work
We treat a smart environment as an intelligent agent that perceives the state of the resident and the physical surroundings using sensors and acts on the environment using controllers in such a way that the specified performance measured is optimized [3]. Researchers have generated ideas for designing smart environment software algorithms that track the location and activities of residents, that generate reminders, and that react to hazardous situations. A few smart environment projects with physical testbeds now exist [1][4][7][26]. Resulting from these advances, researchers are now beginning to recognize the importance of applying smart environment technology to health assistance and companies are recognizing the potential of this technology for a quickly-growing consumer base.
Activity recognition is not an untapped area of research. Because the need for activity recognition technology is great, researchers have explored a number of approaches to this problem. The approaches differ according to the type of sensor data that is used for classification and the model that is designed to learn activity definitions.
Sensor data
Researchers have found that different types of sensor information are effective for classifying different types of activities. When trying to recognize actions that involve repetitive body motions (e.g., walking, running), data collected from accelerometers positioned on the body has been used [13]. Other activities are not as easily distinguishable by body position and in these cases, researchers [14][16] observe the smart home resident’s interaction with objects of interest such as doors, windows, refrigerators, keys, and medicine containers. Other researchers, including Cook and Schmitter-Edgecombe [4], rely upon motion sensors as well as item sensors to recognize ADL activities that are being performed. In addition, some researchers such as Brdiczka et al. [2] video tape smart home residents and process the video to recognize activities, though this can introduce challenges for technology acceptance and the computational expense of processing the data.
Activity models
The number of machine learning models that have been used for activity recognition varies almost as greatly as the types of sensor data that have been tested. Naïve Bayes classifiers have been used with promising results for activity recognition [2][4][12] by identifying the activity that corresponds with the greatest probability to the set of sensor values that were observed. Other researchers, including Maurer et al. [13], have employed decision trees to learn logical descriptions of the activities. Gu, et al. [6] use the notion of emerging patterns to look for frequent sensor sequences that can be associated with each activity as an aid for recognition. Alternative approaches have been explored by other researchers to encode the probabilistic sequence of sensor events using Markov models, dynamic Bayes networks, and conditional random fields [4][10][14].
Here we focus not on the development of a new approach to activity recognition, but rather the selection and placement of sensors in a smart environment to minimize the number of sensors that are needed while maintaining or even improving activity recognition performance. While sensor selection is a relative new idea, it is closely related to the concept of feature selection in machine learning which has been extensively explored.
Feature selection algorithms are commonly categorized in the broad categories of wrapper approaches and filter approaches. Wrapper-based approaches [11] select features by searching through a space of possible features and evaluating each feature set using a specific machine learning model. Wrapper-based feature selection methods employ an optimization factor such as minimizing mean squared error [21][22]. Drawbacks to these approaches are the computational expense of learning and testing a model for each candidate feature set and the risk of overfitting the data. One approach to reducing computational expense is to first generate a model with all available features and then examine the model to see which variables were most influential in the model.
In contrast, filter-based approaches [10] search for the best representative set of features irrespective of any particular learning model. Because feature selection occurs outside the bounds of a particular model, quantitative measures need to be put in place to evaluate the set such as the mutual information measure employed by Torkkola [23] or feature value distances between the target class and near-hit/near-miss examples employed by the Relief algorithm [12].
In addition to selecting individual features of interest, researchers have also designed methods of select subsets of features that work well together [24] and expanding the feature set by constructing new features that represent clusters or combinations of existing features [5]. We draw from a number of these ideas to address the problem of sensor selection and placement in our smart environment research.
3. Datasets
To test our ideas, we collected sensor events from five physical smart environments. As can be seen in Table 1, the datasets exhibit a great deal of diversity. In addition, because some of the residents were younger adults, some were healthy older adults, some were older adults with dementia, and some were pets, the activities exhibit a great deal of diversity in their execution. In all but the Kyoto2 dataset, the residents lived in the space and performed their normal daily routines. During the data collection time, sensor events (representing a sensor reading initiated by the sensor itself or through periodic polling of the sensors) were generated by sensors in the smart environment following the syntax shown in Table 2. The activities that were monitored include as a minimum the following set:
Table 1.
Characteristics of the six datasets used for this study.
| Dataset | Kyoto1 | Kyoto2 | Cairo |
|---|---|---|---|
| Environment | Kyoto | Kyoto | Cairo |
| #Residents | 2 | 1 at a time, 20 participants total | 2+pet |
| #Sensors | 71 | 24 | 27 |
| #Sensor events | 138,039 | 5,312 | 647,487 |
| #Activities | 16 | 5 (scripted) | 10 |
| Dataset | Bosch1 | Bosch2 | Bosch3 |
| Environment | Bosch1 | Bosch2 | Bosch3 |
| #Residents | 1 | 1 | 1 |
| #Sensors | 32 | 32 | 32 |
| #Sensor events | 371,925 | 254,920 | 164,561 |
| #Activities | 11 | 11 | 11 |
Table 2.
Sample of collected sensor events. Each event is characterized by an event date, time, sensor ID, and sensor value.
| 02-27 | 12:49:53.802099 | M15 | ON |
| 02-27 | 12:49:54.24004 | M16 | ON |
| 02-27 | 12:49:55.470956 | M17 | ON |
| 02-27 | 12:49:57.548709 | M16 | OFF |
| 02-27 | 12:49:58.10558 | AD1-B | 0.0332818 |
| 02-27 | 12:49:59.197328 | M17 | OFF |
Sleep
Bed-toilet transition
Personal hygiene
Bathe
Meal preparation
Eat
Leave home
Take medicine
Clean house
Relax/Watch TV
As appropriate, additional activities were monitored that reflect the daily routines of the individuals, including studying and working at the computer. The exception to this format is the Kyoto2 dataset. In this case we recruited 20 undergraduate participants to perform the same set of five activities in the Kyoto testbed, which are:
Make a phone call to obtain a recipe
Wash hands
Cook following recipe
Eat and take medicine
Clean dishes
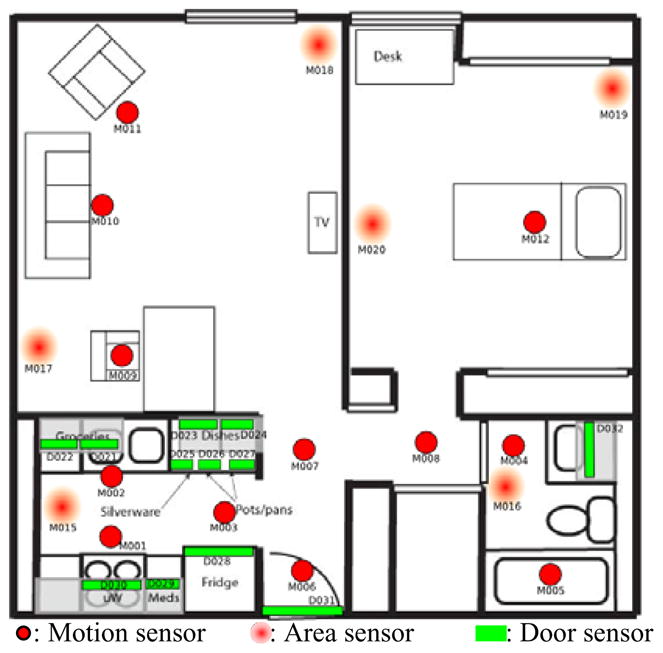
The first testbed, referred to as Kyoto and shown in Figure 1, is a two-bedroom apartment located on the Washington State University campus. The Kyoto apartment is equipped with motion sensors positioned on the ceiling 1 meter apart throughout the space (the filled circles in Figures 2 through 5 represent the locations of motion sensors in the space). In addition, we have installed sensors to provide ambient temperature readings, and custom-built analog sensors to provide readings for hot water, cold water, and stove burner use. Voice over IP captures phone usage, contact switch sensors monitor the open/closed status of doors and cabinets, and pressure sensors monitor usage of key items such as the medicine container, cooking tools, and telephone.
Figure 1.
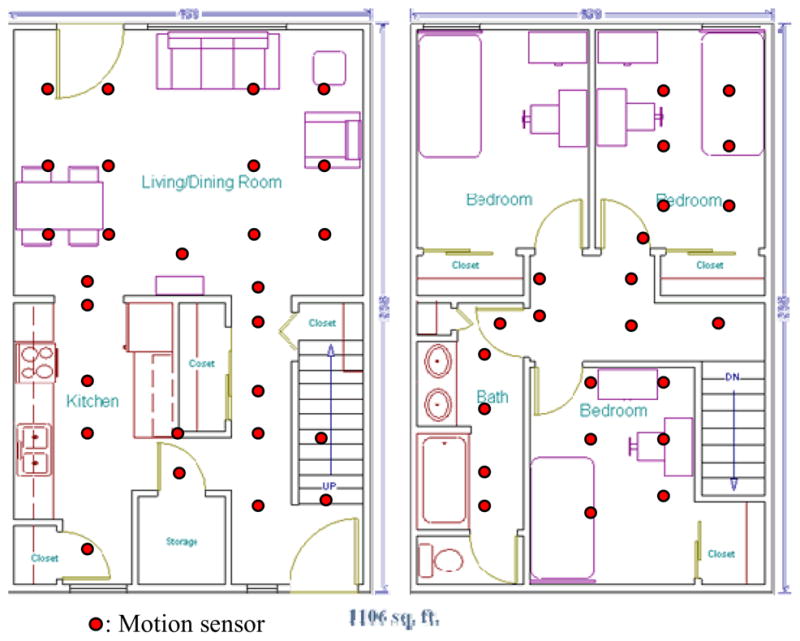
Kyoto smart apartment testbed.
Figure 2.
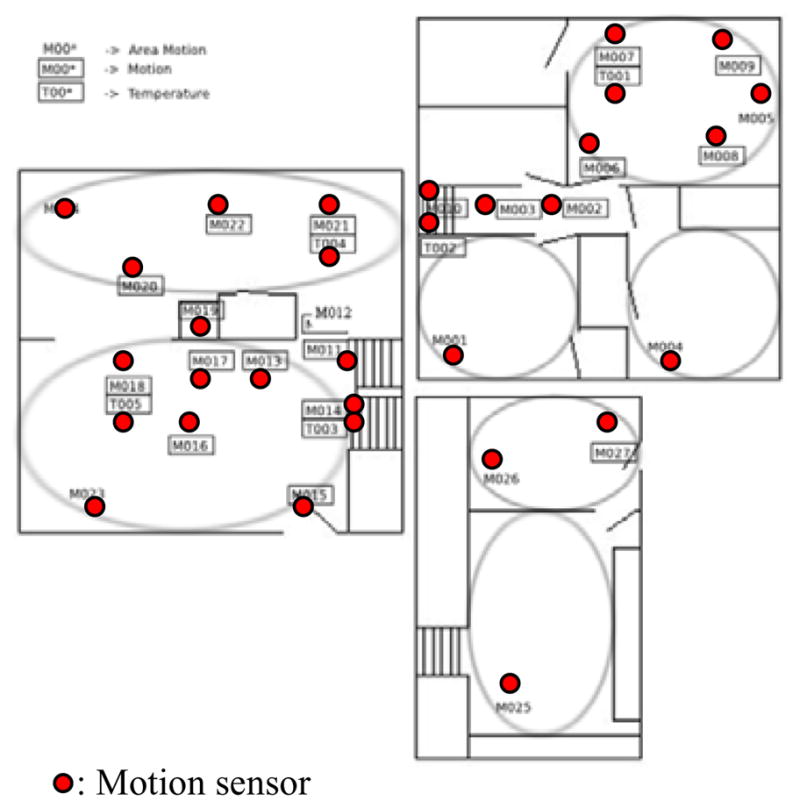
Cairo smart home which housed an older adult couple and a cat.
Figure 5.
Bosch3 smart apartment which housed a single older adult resident.
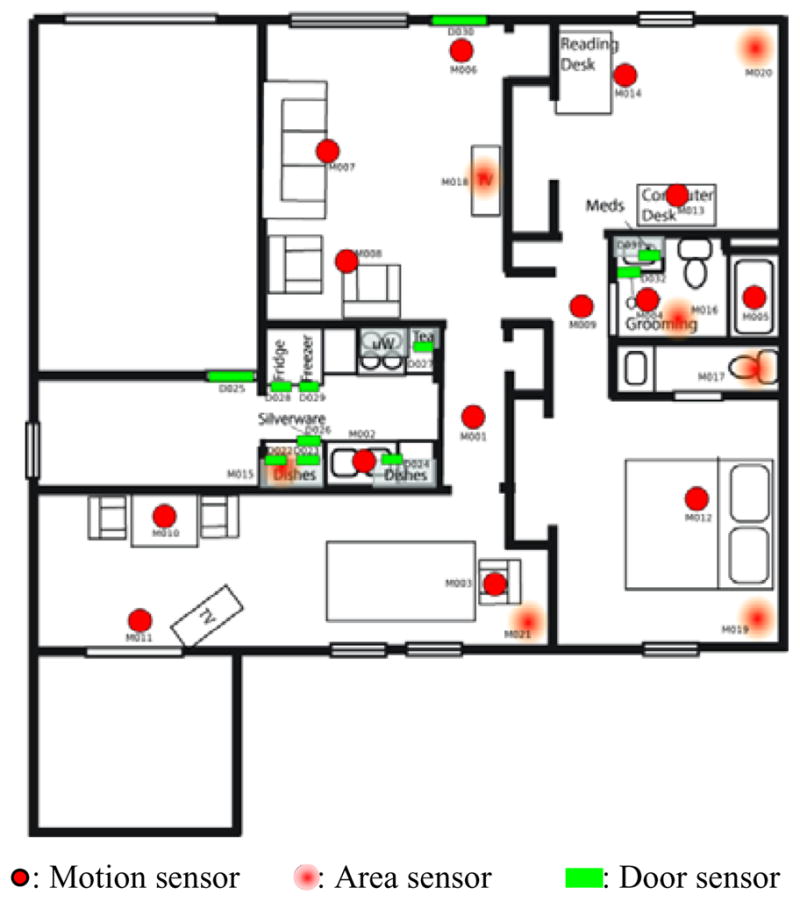
The second testbed, referred to as Cairo (see Figure 2), is a two-bedroom, two-story home. Here we monitored activities for two residents and a pet as they performed their daily activities over the course of two months. Environments three through five (see Figures 3–5) are three single-resident apartments (Bosch1, Bosch2, and Bosch3) that are part of a single assisted care facility. Each of these sites contains motion sensors throughout the space as well as door contact sensors in key areas. Sensor data for each of the environments is captured using a sensor network that was designed in-house and is stored in a SQL database. Our middleware uses a jabber-based publish/subscribe protocol as a lightweight platform and language-independent middleware to push data to client tools with minimal overhead and maximal flexibility.
Figure 3.
Bosch1 smart apartment which housed a single older adult resident.
4. ADL Recognition
In our approach we initially employ a hidden Markov model (HMM) to recognize possibly-interleaved activities from a stream of sensor events. A HMM is a statistical model in which the underlying data source is not itself observable but can be linked to another set of stochastic processes that produce the sequence of observed features. Because the model is Markovian, the conditional probability distribution of any hidden state depends only on the value of a finite number of preceding hidden states.
In our HMM we let the hidden states represent activities. We use our HMM to determine the hidden state sequence (y1y2..yt) that corresponds to the observed sensor event sequence (x1x2..xt). HMM requires two independence assumptions for tractable inference. The first is the Markov assumption that a future state yt depends only the current state yt-1 and not on past states, as shown in Equation 1.
| (1) |
The second assumption is that the observed variable (sensor event) at time t, xt, depends only on the current hidden state yt and not on other observed variables and past states, as shown in Equation 2.
| (2) |
The probability of the hidden state at time t can thus be calculated based on the sequence of sensor events through time t as shown in Equation 3. As this shows, the probability is based on the probability distribution over hidden states in the previous time step, the transition probability from the previous hidden state, and the emission probability of observing a sensor event while in a particular hidden state.
| (3) |
The transition probabilities and observation probabilities for our models are estimated by the relative frequency with which these relationships occur in the training data. An example hidden Markov model for the activities Prepare Meal, Medicine Dispenser, Watch DVD, and Write Birthday Card is shown in Figure 6. Given an input sequence of sensor events, our goal is to find the most likely sequence of hidden states, or activities, which could have generated the observed event sequence. We use the Viterbi algorithm [20] to identify this sequence of hidden states, which provides incremental method of calculating the probabilities in Equation 3. Additional explanation of the HMM-based activity recognition algorithm can be found in the literature [9].
Figure 6.

HMM for an activity recognition task with four hidden states (activities) and a set of observable nodes that correspond to possible sensor events.
The graphs in Figure 7 plot activities that are observed in the various smart homes over a period of time. The x axis indicates the hour of day and the y axis indicates the day within the observation period.
Figure 7.

Charted activity occurrences for six datasets (from top left, these are Bosch1, Bosch2, Bosch3, Kyoto1, Kyoto2, and Cairo).
5. Sensor Selection
We address three questions pertaining to the selection, placement, and focus of sensors in a smart environment that is used for activity recognition:
Which sensors from among an available set are needed to produce optimal activity recognition results?
Can sensors be clustered together to form a new, smaller set of sensors without sacrificing recognition accuracy?
Can insights be gleaned about sensor selection and placement in smart environments?
To address the first question, we want to design an approach to select sensors for use in a smart environment that will be effective for a variety of different activity recognition algorithms. As a result, in this study we employ the mutual information (MI) measure [15] to rank sensors. MI quantifies the mutual dependence of two variables, in this case sensor s and an activity A, by calculating the dependence between the joint distribution of the two variables and the distribution if the variables are independent. Drawing from filter-based sensor selection strategies, we systematically evaluate the effect of removing sensors with low MI values on activity recognition performance. In this case we are choosing sensors which best discriminate the activities. The calculation of an MI value for sensor s given a set of activities A is shown in Equation 4.
| (4) |
In the context of sensor selection, Equation 4 provides a method for quantifying the value of a particular sensor in recognizing a set of activities. When a sensor is removed, the corresponding sensor events are removed from the dataset as though the corresponding sensor was physically removed from the space. Using this method we can determine experimentally how many sensors are needed in a given space to recognize a specific set of activities.
The second question is analogous to the idea of feature construction in machine learning. In particular, when motion sensors are placed in a smart environment we manually restrict their range of observation in order to provide fine-grained resident localization in the space. If we merge the fields of view for neighboring sensors we can replace the pair of sensors with a single sensor associated with a larger field of view. Rather than predefine the number of sensors we want to include in the space, we automate the selection of a number of sensors as well as selection of specific sensors. We do this by performing hierarchical clustering on the sensors, selecting the set of clusters that yield the highest MI values and merging sensors within the clusters that share physical proximity in the space. If a set of sensors falls within the same cluster, we map the corresponding sensor IDs onto a new sensor ID that is the representative for the cluster. In this way the dataset reflects the sensor events that would be generated if the cluster of neighboring sensors was replaced by one sensor with a field of view that encompasses the entire neighborhood.
In the following section we summarize the results of applying these techniques to data collected in our smart environment testbeds. We analyze the data and the activity recognition results to make observations that allow us to answer the third question.
6. Experimental Results
We hypothesize that feature selection methods can be used to identify the number and placement of sensors to result in the best activity recognition accuracy. We also postulate that a larger number of sensors do not always result in better performance. Not only does an increase in sensors add to the cost of smart environment creation and maintenance and resource costs, but it can sometimes actually degrade performance. This is because the addition of more sensor variables increases the complexity of the concept to be learned, and more labeled training data is needed in order to learn the complex concept.
Figure 8 graphs activity recognition performance for each dataset when all of the sensors are used and when sensors are removed in order of nondecreasing MI value. As the graphs show, there is an eventual decrease in accuracy for each dataset as sensors are removed. This is to be expected, as a minimal number of distinct features are needed to learn an activity concept. However, the decrease does not always happen right away. In fact for both Kyoto datasets the accuracy stays constant even when up to 15 sensors are removed from consideration. In addition, in some cases accuracy increases as sensors are removed. For example, the accuracy increases from .857911 to .859831 when sensors are removed from the Bosch2 dataset. The percentage of sensors that can be removed without loss of accuracy ranges from 4% (for the Cairo dataset) to 67% (for the Kyoto2 dataset) with an average of 21%. These results are intuitive, because the Cairo dataset reflects a greater number of residents and activities with a fewer number of sensors covering the space than the Kyoto2 dataset.
Figure 8.
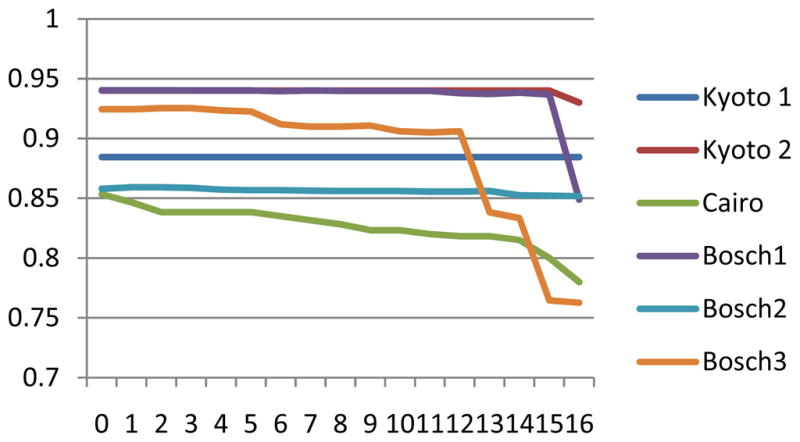
Activity recognition accuracy (vertical axis) as a function of the number of sensors that are removed from the environment (horizontal axis) for each of the datasets.
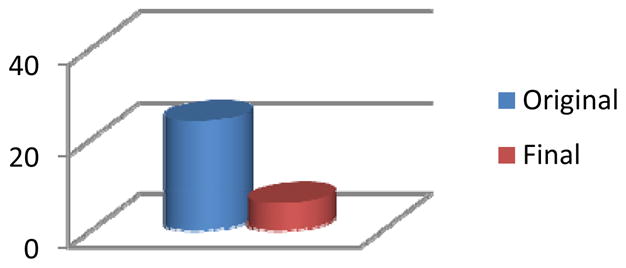
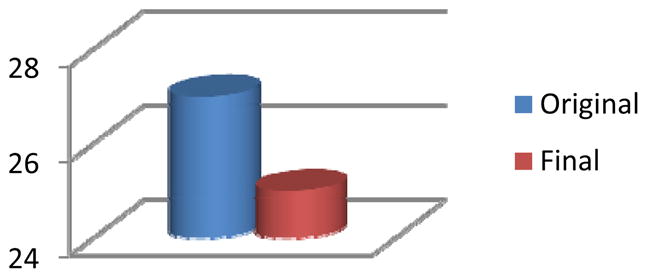
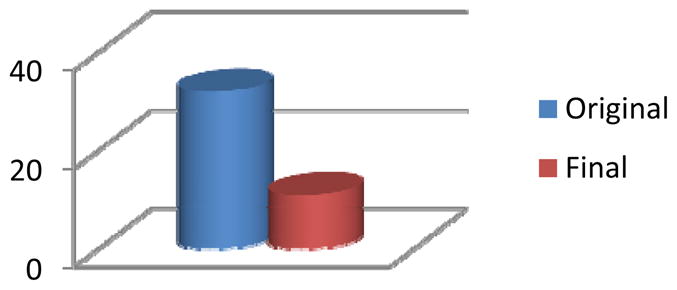
Next, we evaluate our clustering algorithm on the same six datasets. The results are graphed in Figures 9–14. This approach is different than sensor selection because the merged sensors act as one new sensor. The individual sensor information is not lost but no distinction is made between each of the sensors that are members of the same cluster.
Figure 9.
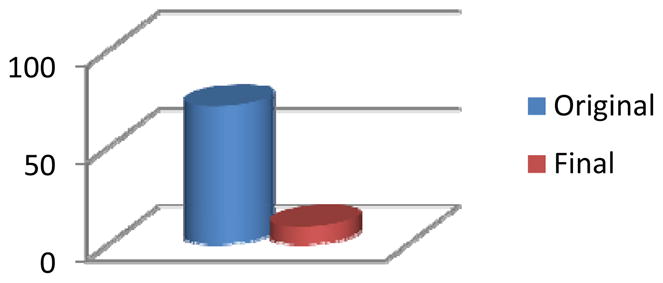
The original number of clusters found in the Kyoto1 environment and the final number of distinct clusters that result from the clustering algorithm without any decrease in recognition accuracy.
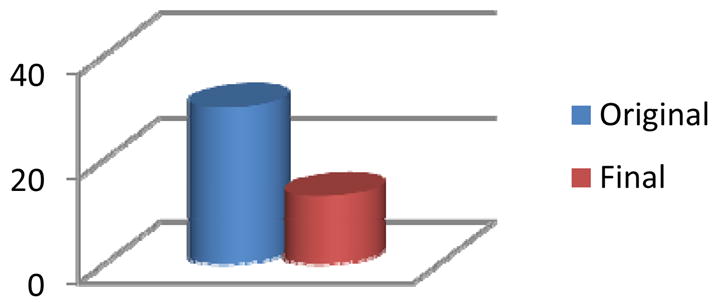
Figure 14.
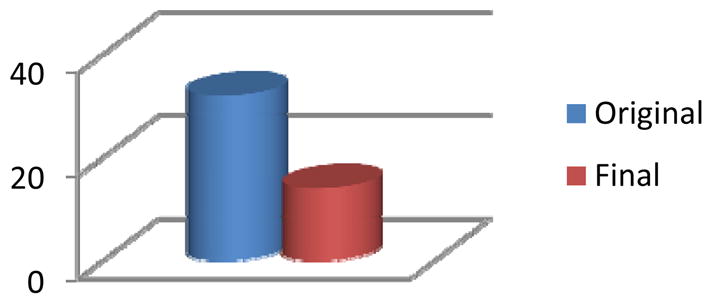
The original number of clusters found in the Bosch3 environment and the final number of distinct clusters that result from the clustering algorithm without any decrease in recognition accuracy.
Our criterion for terminating the clustering algorithm is a subsequent degradation in activity recognition accuracy. Figures 9–14 show a large reduction in the needed number of sensors for some of the environments. The percentage of sensors that can be removed using the clustering approach ranges from 7% (for Cairo) to 87% (for Kyoto) with an average of 58%. The greatest reduction occurs in the Kyoto testbeds, which is not surprising because this environment contains the greatest density of sensors. The environment also contains a number of special-purpose sensors for light, temperature, and water usage. Almost all of the special-purpose sensors were not removed in the feature selection step but were merged with other sensors in the clustering algorithm. As with the feature selection step, every one of the testbeds realizes an initial increase in recognition accuracy with the clustering algorithm. In each case, however, as more sensors are clustered the accuracy eventually declines.
7. Sensitivity to Recognition Algorithm
The results from the first set of experiments clearly indicate that the adage “the more the better” does not always apply to sensor selection for activity recognition. In fact, in these experiments not only were a large number of sensors not needed, but in many cases the algorithms performed better with a smaller number of sensors covering larger spaces.
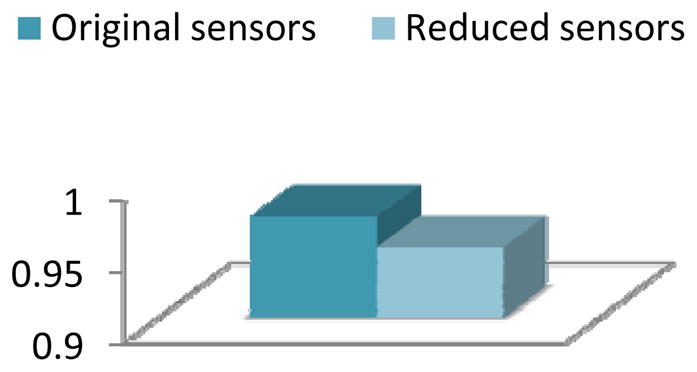
We next consider the question of whether the results of these experiments are specific for a particular type of modeling and recognition algorithm. In order to determine whether the results are generalizable to multiple learning algorithms, we run the activity recognition algorithm on these smart environment databases for three learning algorithms: the original hidden Markov model, a naïve Bayes classifier, and a linear-chain conditional random field classifier. In each case we test the performance of the algorithm using 3-fold cross validation and apply it to the database using the original set of sensors and using the final set of sensors as indicate by the sensor selection and clustering algorithms. If the results of these algorithms are generalizable then the accuracy of each of the algorithms will not degrade when they are applied to the smaller set of sensors.
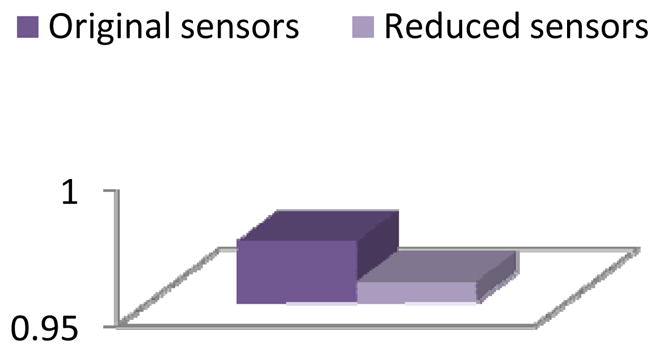
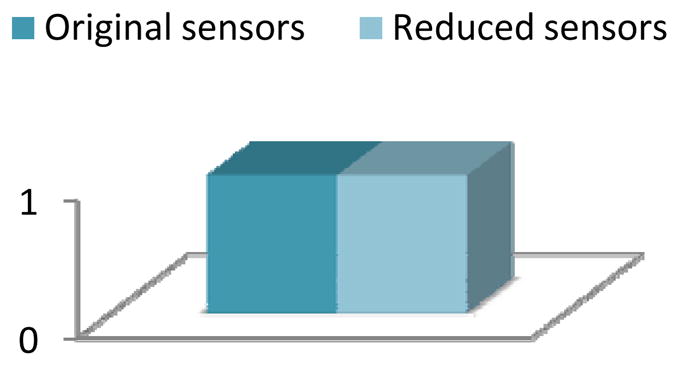
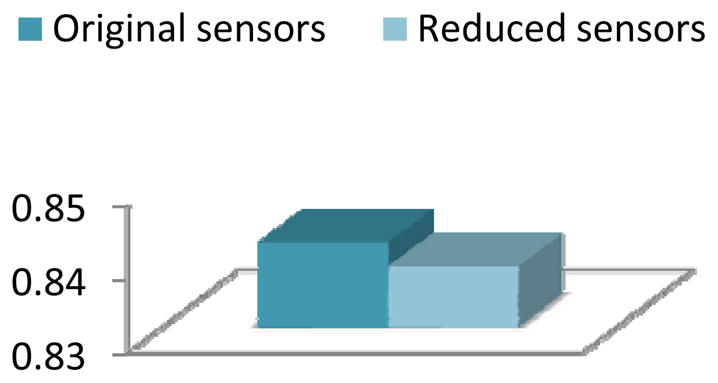
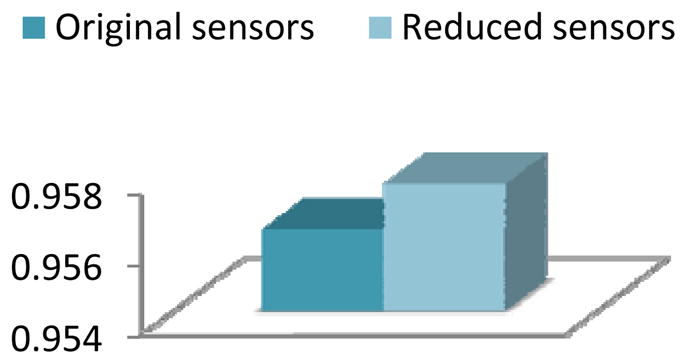
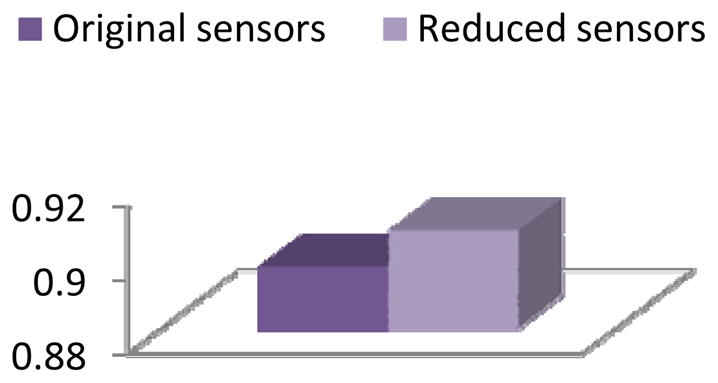
As the results in Figures 15–26 show, the reduction in sensors does not dramatically change the predictive accuracy for any of the classifiers or any of the datasets. The results sometimes degrade and sometimes improve. The largest decrease in accuracy results for the database in which the greatest reduction was made in the number of sensors. This indicates that sensor reduction should be applied more conservatively if the feature selection process is intended to be used for more than one model and not customized to a specific learning model.
Figure 15.
Activity recognition accuracy for the Kyoto 1 dataset with a naïve Bayes classifier applied before and after applying clustering-based feature selection and construction.
Figure 26.
Activity recognition accuracy for the Bosch-3 dataset with conditional random fields applied before and after applying clustering-based feature selection and construction.
8. Heuristics for Sensor Placement
Based on our observations in processing data from the smart environment testbeds, the following features have a noticeable influence on the learned activity model for a particular environment:
The size of the physical area that is covered by the sensor.
The number of other sensors (of any type) that overlap coverage areas with this sensor.
The amount of resident movement that occurs in this environment (labeled as low, medium, or high).
The type of sensor that is being considered.
Using these features to describe the sensors, we created a database of all of the sensors found in the five testbeds. We then labeled them as high value, medium value, or low value based on how quickly they were removed in our MI step or merged in our clustering step. We fed the database as input to a decision tree algorithm to see if it could learn the value of the sensors and also to see the rules that would be generated by the algorithm.
The decision tree algorithm learned these three classes with an accuracy of 0.67. The rules that were generated by the decision tree algorithm were fairly intuitive and actually make use of all of the features we listed above. The rules are summarized here as:
If there is little movement in the area, the value of the sensor is low; particularly if it is not a motion sensor (the value is medium for motion sensors when other sensors are nearby).
If there is a medium amount of movement in the area then the value of the sensor (of any type) is medium.
If there is a large amount of movement in the area then the value of a motion sensor is high, while the value of any other type of sensor is medium.
From these results we see that motion sensors in general provide the greatest value for activity recognition. In practice we have found that special-purposes sensors for water, light, door usage, burner usage, and phone usage assist in our tracking the steps of an activity but rarely provide discriminative power in differentiating between activities. These rules also indicate that rooms with a greater amount of movement need more sensors. The results of the feature selection and feature construction experiments are consistent with this rule: Sensors found in guest bedrooms and closets tended to be the first to be pruned, whereas sensors in the kitchen and living room/TV area were generally kept and not quickly merged with others.
The next experiment we would like to try in the future is to use these heuristics to not only select and to merge existing sensors but to actually change the exact position and coverage of sensors in a smart environment. It would also be useful to consider additional features in the selection process, such as the number and type of activities that need to be recognized and tracked.
9. Conclusions
In order to provide robust activity recognition and tracking capabilities for smart home residents, researchers need to consider techniques for identifying the activities to recognize and track. In this work we examine the issue of selecting and placing sensors in a smart home in order to maximize activity recognition accuracy but minimize the number of sensors that are purchased, installed and maintained. Our study results indicate that a larger number of sensors is not always desirable, not only for the sake of cost but even for recognition accuracy. Feature selection and construction techniques can be used to determine an optimal number of sensors for a particular environment and to generalize rules for initial section and placement of sensors.
Ultimately, we want to use our algorithm design as a component of a complete system that performs functional assessment of adults in their everyday environments. This type of automated assessment also provides a mechanism for evaluating the effectiveness of alternative health interventions. We believe these activity profiling techniques are valuable for providing automated health monitoring and assistance in an individual’s everyday environments.
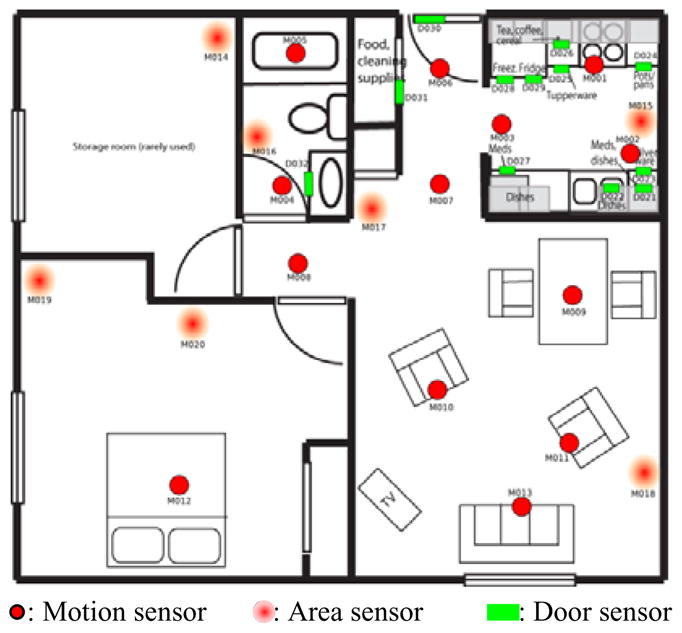
Figure 4.
Bosch2 smart apartment which housed a single older adult resident.
Figure 10.
The original number of clusters found in the Kyoto2 environment and the final number of distinct clusters that result from the clustering algorithm without any decrease in recognition accuracy.
Figure 11.
The original number of clusters found in the Cairo environment and the final number of distinct clusters that result from the clustering algorithm without any decrease in recognition accuracy.
Figure 12.
The original number of clusters found in the Bosch1 environment and the final number of distinct clusters that result from the clustering algorithm without any decrease in recognition accuracy.
Figure 13.
The original number of clusters found in the Bosch2 environment and the final number of distinct clusters that result from the clustering algorithm without any decrease in recognition accuracy.
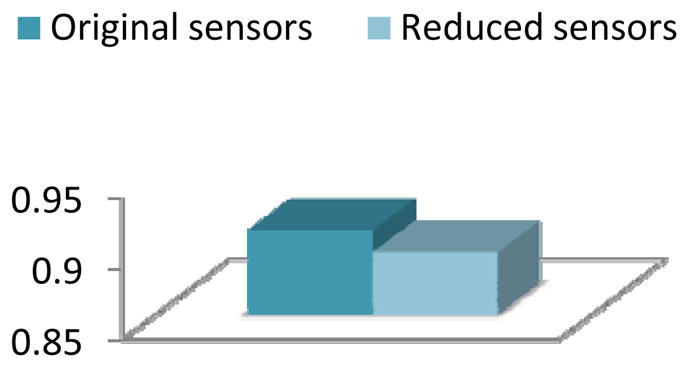
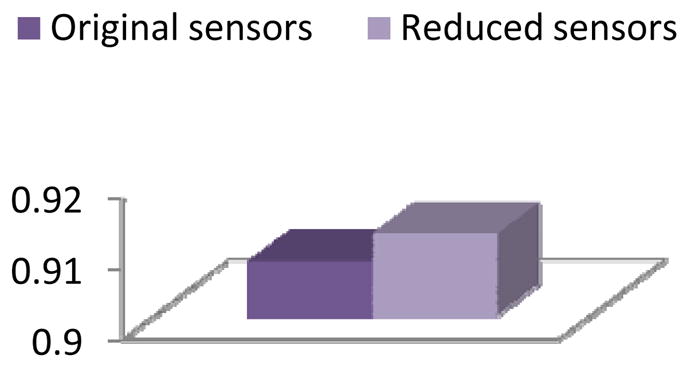
Figure 16.
Activity recognition accuracy for the Kyoto 2 dataset with a naïve Bayes classifier applied before and after applying clustering-based feature selection and construction.
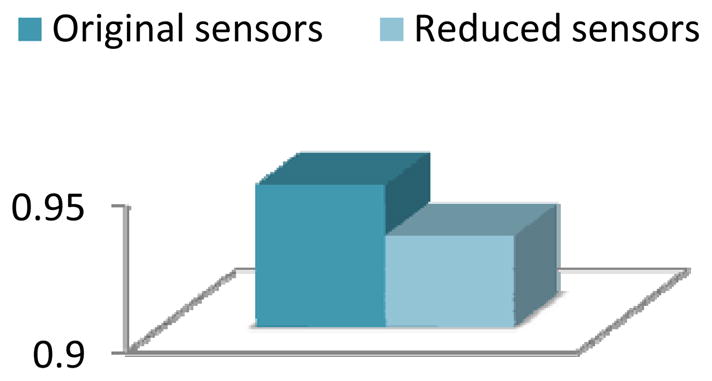
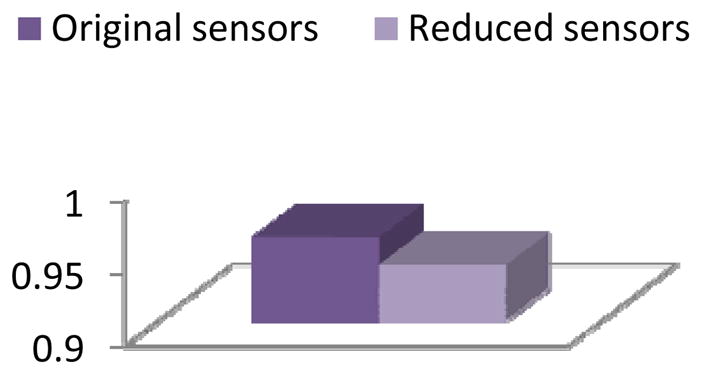
Figure 17.
Activity recognition accuracy for the Cairo dataset with a naïve Bayes classifier applied before and after applying clustering-based feature selection and construction.
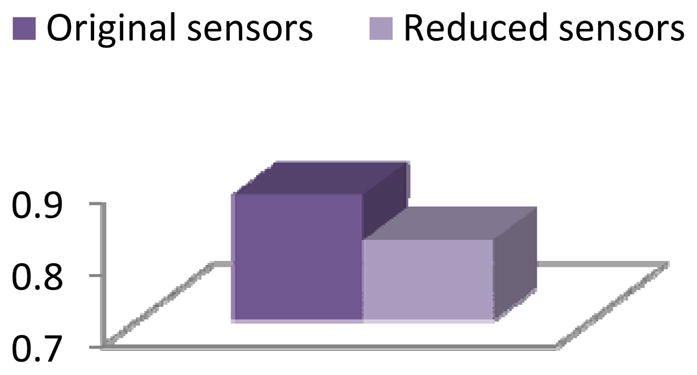
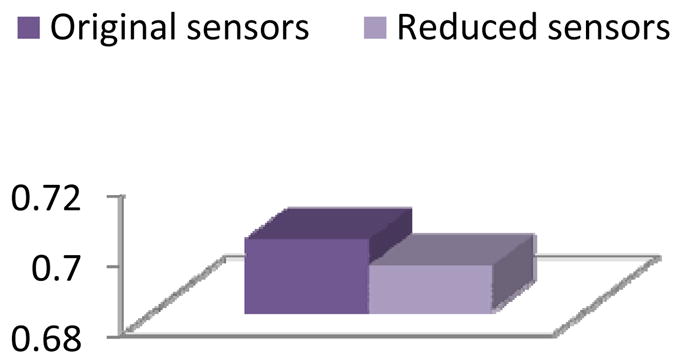
Figure 18.
Activity recognition accuracy for the Bosch-1 dataset with a naïve Bayes classifier applied before and after applying clustering-based feature selection and construction.
Figure 19.
Activity recognition accuracy for the Bosch-2 dataset with a naïve Bayes classifier applied before and after applying clustering-based feature selection and construction.
Figure 20.
Activity recognition accuracy for the Bosch-3 dataset with a naïve Bayes classifier applied before and after applying clustering-based feature selection and construction.
Figure 21.
Activity recognition accuracy for the Kyoto 1 dataset with conditional random fields applied before and after applying clustering-based feature selection and construction.
Figure 22.
Activity recognition accuracy for the Kyoto 2 dataset with conditional random fields applied before and after applying clustering-based feature selection and construction.
Figure 23.
Activity recognition accuracy for the Cairo dataset with conditional random fields applied before and after applying clustering-based feature selection and construction.
Figure 24.
Activity recognition accuracy for the Bosch-1 dataset with conditional random fields applied before and after applying clustering-based feature selection and construction.
Figure 25.
Activity recognition accuracy for the Bosch-2 dataset with conditional random fields applied before and after applying clustering-based feature selection and construction.
Contributor Information
Diane J. COOK, Email: cook@eecs.wsu.edu.
Lawrence B. HOLDER, Email: holder@eecs.wsu.edu.
References
- 1.Abowd G, Mynatt E. Designing for the human experience in smart environments. In: Cook D, Das S, editors. Smart Environments: Technology, Protocols, and Applications. Wiley; 2004. pp. 153–174. [Google Scholar]
- 2.Brdiczka O, Reignier P, Crowley J. Detecting individual activities from video in a smart home. Proceedings of the International Conference on Knowledge-Based and Intelligent Information and Engineering Systems; 2007. pp. 363–370. [Google Scholar]
- 3.Cook D, Das S, editors. Smart Environments: Technology, Protocols, and Applications. Wiley; 2004. [Google Scholar]
- 4.Cook D, Schmitter-Edgecombe M. Assessing the quality of activities in a smart environment. Methods of Information in Medicine. 2009;48(5):480–485. doi: 10.3414/ME0592. [DOI] [PMC free article] [PubMed] [Google Scholar]
- 5.Dhillon I, Mallela S, Kumar R. Enhanced word clustering for hierarchical text classification. Proceedings of the International Conference on Knowledge Discovery and Data Mining; 2002. pp. 191–200. [Google Scholar]
- 6.Doctor F, Hagras H, Callaghan V. A fuzzy embedded agent-based approach for realizing ambient intelligence in intelligent inhabited environments. IEEE Transactions on Systems, Man, and Cybernetics, Part A. 2005;35(1):55–56. [Google Scholar]
- 7.Gu T, Wu Z, Tao X, Pung H, Lu J. epSICAR: An emerging patterns based approach to sequential, interleaved and concurrent activity recognition. Proceedings of the IEEE International Conference on Pervasive Computing and Communication; 2009. [Google Scholar]
- 8.Helal A, Mann W, El-Zabadani H, King J, Kaddoura Y, Jansen E. The Gator Tech smart house: A programmable pervasive space. IEEE Computer. 2005;38(3):50–60. [Google Scholar]
- 9.Kim E, Helal S, Cook D. Human activity recognition and pattern discovery. IEEE Pervasive Computing. 2010;9(1):48–53. doi: 10.1109/MPRV.2010.7. [DOI] [PMC free article] [PubMed] [Google Scholar]
- 10.Kira K, Rendell L. The feature selection problem: Traditional methods and a new algorithm. Proceedings of the National Conference on Artificial Intelligence; 1992. [Google Scholar]
- 11.Kohavi R, John G. Wrappers for feature subset selection. Artificial Intelligence. 1997;97(1–2):273–324. [Google Scholar]
- 12.Kononenko I. Estimating attributes: Analysis and extensions of RELIEF. Proceedings of the European Conference on Machine Learning; 1994. pp. 171–182. [Google Scholar]
- 13.Liao L, Fox D, Kautz H. Location-based activity recognition using relational Markov networks; Proceedings of the International Joint Conference on Artificial Intelligence; 2005. pp. 773–778. [Google Scholar]
- 14.Maurer U, Smailagic A, Siewiorek D, Deisher M. Activity recognition and monitoring using multiple sensors on different body positions. Proceedings of the International Workshop on Wearable and Implantable Body Sensor Networks; 2006. pp. 99–102. [Google Scholar]
- 15.Munguia-Tapia E, Intille SS, Larson K. Activity recognition in the home using simple and ubiquitous sensors; Proceedings of Pervasive; 2004. pp. 158–175. [Google Scholar]
- 16.Peng HC, Long F, Ding C. Feature selection based on mutual information: Criteria of max-dependency, max-relevance, and min-redundancy. IEEE Transactions on Pattern Analysis and Machine Intelligence. 2005;27(8):1226–1238. doi: 10.1109/TPAMI.2005.159. [DOI] [PubMed] [Google Scholar]
- 17.Philipose M, Fishkin K, Perkowitz M, Patterson D, Fox D, Kautz H, Hahnel D. Inferring activities from interactions with objects. IEEE Pervasive Computing. 2004;3(4):50–57. [Google Scholar]
- 18.Rashidi P, Cook D. Keeping the resident in the loop: Adapting the smart home to the user. IEEE Transactions on Systems, Man, and Cybernetics, Part A: Systems and Humans. 2009;39(5):949–959. [Google Scholar]
- 19.Reisberg B, et al. The Alzheimer’s disease activities of daily living international scale (ASL-IS) International Psychogeriatrics. 2001;13:163–181. doi: 10.1017/s1041610201007566. [DOI] [PubMed] [Google Scholar]
- 20.Rialle V, Ollivet C, Guigui C, Herve C. What do family caregivers of Alzheimer’s disease patients desire in smart home technologies? Methods of Information in Medicine. 2008;47:63–69. [PubMed] [Google Scholar]
- 21.Rivals I, Personnaz L. MLPs (mono-layer polynomials and multi-layer perceptrons) for non-linear modeling. Journal of Machine Learning Research. 2003;3:1383–1398. [Google Scholar]
- 22.Stoppiglia H, Dreyfus G, Dubois R, Oussar Y. Ranking a random feature for variable and feature selection. Journal of Machine Learning Research. 2003;3:1399–1414. [Google Scholar]
- 23.Torkkola K. Feature extraction by non-parametric mutual information maximization. Journal of Machine Learning Research. 2003;3:1415–1438. [Google Scholar]
- 24.Tuy E, Borisov A, Runger G, Torkkola K. Feature selection with ensembles, artificial variables, and redundancy elimination. Journal of Machine Learning Research. 2009;10:1341–1366. [Google Scholar]
- 25.Viterbi A. Error bounds for convolutional codes and an asymptotically-optimum decoding algorithm. IEEE Transactions on Information Theory. 1967;13(2):260–269. [Google Scholar]
- 26.Wadley V, Okonkwo O, Crowe M, Ross-Meadows LA. Mild cognitive impairment and everyday function: Evidence of reduced speed in performing instrumental activities of daily living. American Journal of Geriatric Psychiatry. 2007;16:416–424. doi: 10.1097/JGP.0b013e31816b7303. [DOI] [PubMed] [Google Scholar]
- 27.Youngblood GM, Cook D. Data mining for hierarchical model creation. IEEE Transactions on Systems, Man, and Cybernetics, Part C. 2007;37(4):1–12. [Google Scholar]