Abstract
This paper outlines the design and testing of a powered ankle prosthesis, which utilizes a four-bar mechanism in conjunction with a spring and motor that mimics nonamputee (normal) ankle moments. This approach would enable transtibial (below the knee) amputees to walk at a normal speed with minimal energy input. The design takes into account the energy supplied by the wearer required to achieve many of the desired characteristics of a normal gait. A proof-of-concept prototype prosthesis was designed, optimized, fabricated, and tested with the purpose of demonstrating its ability to match crucial ankle moments during the stance phase of gait. Testing of this prosthesis proved crucial in determining the prosthesis’ capabilities and in evaluating this approach.
1 Introduction
Research in the area of lower limb prosthetic devices has evolved tremendously since its inception to where it is today. The vast majority of current prostheses utilize passive elements that incorporate spring(s) and damper(s) in various forms and configurations. However, analyses of amputee gait show that no current commercially available prosthesis is able to restore normal gait to transtibial (below the knee) amputee [1-4]. Since the human ankle produces more energy than it absorbs, active components are necessary to allow for a closer imitation of normal gait [5]. Due to the large number of lower limb amputees from dysvascular, diabetic, and traumatic etiologies coupled with the limitations of commercially available prosthetic feet, a device that utilizes active components is needed. However, commercial attainment of an active ankle has proven elusive.
This paper details a novel prosthetic ankle design approach that incorporates passive and active components, which allows for an activation of the ankle [6]. The purpose of this paper is to explain this approach and to demonstrate its technical feasibility. The motivation for this research is to create a prosthesis that will enable the user to walk with normal speed and efficiency. However, this research does not fully develop the prosthesis but instead illustrates the novelty of the approach and proves its feasibility in the stance phase of gait after foot-flat is achieved. It focuses on a design paradigm that integrates control and actuation into one design system, which is simple and straightforward to implement.
1.1 Previous Work
Studies have provided gait analyses of transtibial amputees using common prosthetic feet [7-9]. The results show the necessity for better artificial ankle moments and the increased range of motion. While some prosthetic feet seem to score better than others, they all fall short in amply mimicking normal ankle behavior [1-4,9,10].
One of the more complex issues in prosthetic design is mimicking the nonlinear stiffness of the ankle throughout the stance phase [11]. Many of the current prosthetic feet recreate this stiffness by using solely passive elements: spring(s) and damper(s). Although a combination of material researches and creative designs have improved passive element prostheses [2-5,12,13], greater success lies ahead for the prosthesis that utilizes active elements that would rival the efficacy of the human ankle. The issues confronting such an approach is the size and weight of components directly actuating the ankle joint [14]. As of yet, an active transtibial prosthesis is not commercially available.
Different research groups are in various stages of research and development of active below the knee prostheses. As first introduced by Hollander et al. [15] and followed in other subsequent publications [16,17], the spring ankle with regenerative kinetics (SPARKy) project utilizes springs in conjunction with a lever arm driven by a ball screw. This robotic tendon is actuated by a rotary motor to provide a power input when needed. Another competing design is the one introduced by Au et al. [18]; it also uses a motor driving a ball screw to add energy into the system without the use of a lever arm. This design has been fully designed and tested on amputees with limited success [14,19]. Another set of designs utilizes pneumatically actuated muscles [20,21] but no on board air supply is noted for either application. A notable transfemoral design, which actuates the ankle as well, was introduced by Sup et al. [22] and Sup et al. [23].
As with any mechanical device, issues can arise when implementing a control system with the design. A straightforward approach uses a state control scheme based on time similar to much of the work in transfemoral prostheses [24]. Au et al. [14] used EMG sensors in the foot and ankle to distinguish when a certain gait phase is encountered; it uses force or impedance control during the stance phase and position control in the swing phase. Sup et al. [23] also used a finite state machine with sensors on the prosthesis to change desired fixed equilibrium points. The SPARKy project has approached it differently [25-27] by using phase plane invariants to design a control algorithm based on the user’s tibial angle.
This paper will outline a method to design the transtibial prosthesis while simultaneously incorporating the control into the mechanical design. It is believed that designing a complete system will lead to a more compact mechanical design, which consumes less power while using a simple control scheme. The design is based on a four-bar mechanism [6] used in conjunction with a motor and a spring [28] to restore normal human ankle moments during the stance phase of gait. While not fully developed for the swing phase, this novel approach demonstrates a dramatic departure from those prostheses previously developed. To show that this approach is feasible, a prototype was developed and tested.
2 Design Evolution
Based on results from previous studies on foot-ankle prostheses, today’s devices cannot fully provide the ability to walk with normal gait. The most prominent approach to solve this problem is to match ankle stiffness. A different approach is to match known normal ankle moments 2 using a powered mechanism. Mathematical optimizations were used to design an apparatus that could model the moment curve of one gait cycle (Fig. 2, data acquired from the work of Winter [11]). Figure 1 shows what nonamputee gait at normal cadence looks like through consecutive heel strikes [11]. The slope of this curve represents the torsional stiffness of the ankle. To orient the reader through Fig. 1, the cycle begins at the origin when the foot contacts the ground while walking.
Fig. 2.
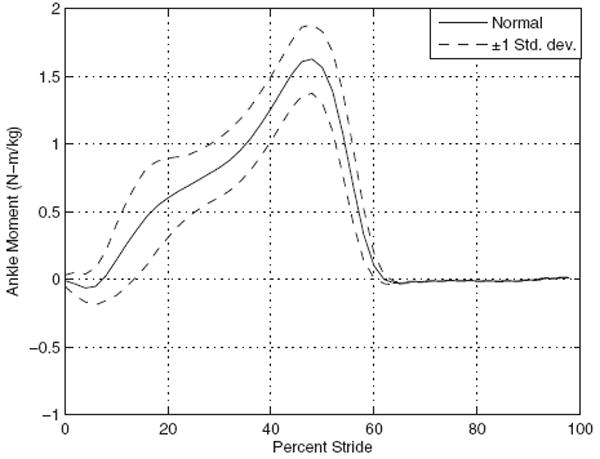
Moment versus gait cycle with ±1 standard deviation through consecutive heel strikes of the same foot
Fig. 1.
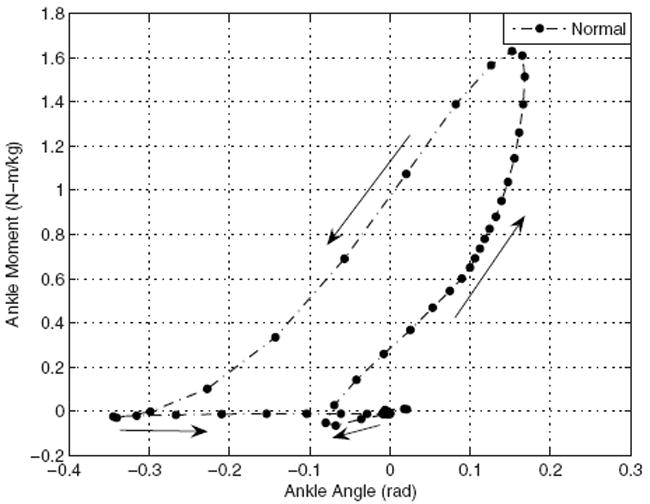
Normal ankle moment curve where the heel-strike begins nearest the origin
Following the examples of others in this field, relevant assumptions were considered. Only the movement in the sagittal plane was modeled. Realizing that marketable solutions will need to be scaled to the wearer of the prosthesis, the optima in this section, and the next present values normalized to the kilogram (i.e., able to be scaled to the weight of potential wearers). Mass-dependent variables will be multiplied by a mass of 73.6 kg, an arbitrarily chosen mass for a candidate of this prosthesis. Due to the design process used, this prosthesis can be scaled according to patient height and weight specifications. Walking speed and stride length are not specifically assigned values, as these remain relatively consistent despite the variation in height among individuals. Since ankle moments and other data from the work of Winter [11] were used for data comparison, the value of 1.134 s was used for the period of the entire gait cycle and for determining power and energy consumptions of the prosthesis. The data is not given as continuous functions but as sets of 50 equally spaced points, which will be closely matched by optimizations discussed in this paper.
2.1 Simple Hinge Optimization
To eliminate an obvious solution, the first optimization used a least-squares fit to model a simple hinge outfitted with a rotational spring and damper at the ankle. The design variables that were allowed to vary were the linear damping constant b, the torsional spring constant k, and the preload on the spring M0. The cost function was to minimize the error between natural ankle moment Mθi and optimized moment Mi. This was calculated as the squared difference at each datum point i.
| (1) |
This optimization [6] yields a spring constant k, a spring preload M0, and an opposite of a damper b (the source of energy input); these values are given in Table 1. The resulting fit, not shown, proves to be inadequate due to its inability to closely model a nonamputee gait (i.e., error of 6.5146).
Table 1.
Progression of error reduction
| Mechanism | Optimization | Variables | b (N m s / rad kg) | k (N m/ rad) | M0 (N m) | Error for full gait (N2 m2) | Error from foot-flat to toe-off (N2 m2) | Peak motor pwr (W) |
|---|---|---|---|---|---|---|---|---|
| Hinge | Unconstrained | k, b, and M0 | −0.094 | 180 | 35 | 6.5146 | NA | 92 |
| Passive 4bar | Constrained | k, b, M0, l0, l1, l2, and l3 | 0 | 61 | −81 | 3.3785 | NA | 0 |
| Active 4bar | Constrained | k, b, M0, l0, l1, l2, and l3 | −0.047 | 61 | −80 | 1.6981 | 0.5406 | 130 |
| Improved cost | Constrained | k, b, M0, l0, l1, l2, and l3 | −0.056 | 67 | −61 | NA | 0.1211 | 150 |
| Penalized energy | Constrained | k, b, M0, l0, l1, l2, and l3 | −0.012 | 15 | 4.4 | NA | 0.1164 | 150 |
2.2 Passive Four-Bar Optimization
Through the implementation of a four-bar design, the spring and damper were shifted from joint A to joint C (Fig. 3). This location is more convenient from a volumetric perspective and exploits the mechanism’s changing mechanical advantage to allow for a linear spring. An added benefit is that the four-bar design is only reliant on the mechanism’s length ratios. Following the standard analysis of four-bar mechanisms, the moment produced at the ankle (joint A in Fig. 3) was quasi-statically calculated at each datum point i by using the following equation [6,29]:
| (2) |
where θi and ϕi are the angles at joint A and joint C, respectively, and Mϕi is the moment produced at joint C.
Fig. 3.
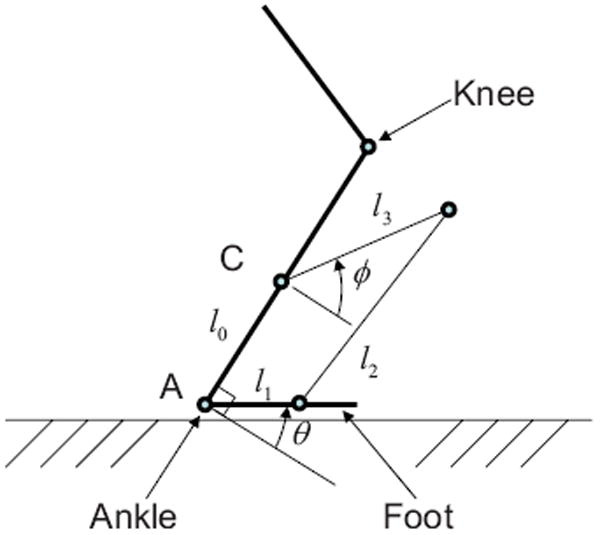
Model of the four-bar prosthesis configuration where C is the location of the spring/motor and l0 – l3 are the links of the four-bar mechanism
The error in Eq. (1) was again minimized but the number of parameters (design variables) was increased. With this, b, k, and M0 and the link lengths l0, l1, l2, and l3 (Fig. 3) are allowed to vary. As a physical restriction, none of the link lengths were permitted to be negative (constrained) and b was forced to be positive to model a damper that would dissipate energy. A nonlinear solver within matlab, fmincon,3 produced results that better followed the shape of the normal ankle moment curve (Fig. 2) and reduced the total error over the entire gait, shown in Table 1.
2.3 Active Four-Bar Mechanism
The interpretation of the passive four-bar mechanism showed that it was optimized when b=0 (i.e., at a constraint boundary). The fact that this value is to one extreme of the set boundaries indicates that a better optimum may be found if the constraints on b were relaxed. Thus, b was permitted to be negative, implying the input of energy into the system [5]. This change yielded an optimum found in Table 1 with improved performance.
2.4 Active Four-Bar Mechanism With Improved Cost Function
A closer match has been attained, allowing the damping coefficient to be negative; however, the beginning and end of the gait cycle show poor results. Part of this discrepancy comes from the heel-strike to foot-flat portion of the gait, the initial contact through the loading response. The other major deviation from the normal curve is after about 60% of the gait cycle; at this moment, the foot comes off the ground and the swing phase begins. Since this optimal solution effectively matches the moments of a normal ankle, the range of the cost function was reduced. Rather than optimizing over the entire gait from 0% to 100% of the cycle, the cost function was narrowed to the segment of the gait from foot-flat to toe-off (6–60%). This new range almost completely encompasses the stance phase of the gait where obtaining an accurate ankle moment is most crucial. The first 6% of gait, from heel-strike to nearly foot-flat, is the time where energy is being absorbed; this will be addressed in the later studies whereas the goal of this research is to reproduce normal ankle moments during the crucial phases of the gait (foot-flat to toe-off). With these new parameters, the optimum with the narrowed cost function shows improvement over the target range [6], as shown in the fourth row in Table 1.
2.5 Active Four-Bar Mechanism With Penalized Energy
The previous optimizations have revealed a significant reduction in the quantifiable error values with each passing iteration (Table 1). This preliminary work has developed the concept for a mechanism that has the potential to empower transtibial amputees to obtain normal gait. Mathematical model performance comparison of the ankle stiffness and the moment curves further corroborate this design.
2.5.1 Optimization
The battery life of any powered cordless device is of the utmost importance and the peak power required to drive the device runs a close second. For this reason, the optimization was further refined to take into account energy concerns. Recall that the b value of previous optimizations represents energy input as a negative damper. The primary purpose of this section is to change the cost function to produce an optimum with a decreased b value. With a smaller power and energy demand, a smaller motor and battery pack can be used to reduce the weight of the prototype. As part of this effort, previously vague optimum values will take on greater significance as they are translated into motor sizes and spring specifications.
The method by which the motor contributes moment and power are described by Eqs. (3) and (4)
| (3) |
| (4) |
where ϕ̇ is the angular velocity at joint C of the four-bar mechanism (Fig. 3). By making |b| smaller, the amount of energy required by an optimal solution is reduced. Based on previous optimizations, b will always be negative (energy input).
As previously stated, the cost function is the squared difference between the reference moment data [11] and the optimized moment data. By incorporating γ|b|, an energy-related term, into the cost function, minimizing |b| will become a secondary priority depending on the weighting coefficient γ. In effect, this change will penalize the cost function for optima with a high |b| value. The result will be an optimum that performs as well as an earlier optima but with an implied smaller demand for energy. The cost function was then modified to
| (5) |
The initial γ coefficient value was randomly chosen and then adjusted by orders of magnitude until cost function results (error plus the added term) were within an order of magnitude of the earlier error value. By subsequent tests, γ was fine-tuned to strike an acceptable balance between a reduced |b| and a visual deviation from the normal moment curve and the global error. This optimization effectively became a multi-objective problem [31]. Simple error calculations verified that this new optimum was a comparable match to the normal moment curve over the target range of 6–60%.
The result of the change was significant; optima with high |b| values were no longer considered. Performance of the new optimum is consistent with that of the previous optimum while |b| was reduced by 80%. The k and M0 values also fell dramatically by 75% and 95%, respectively. These reductions translate to less demanding part specifications and possible energy savings compared with earlier optimizations.
To confirm the power and energy savings, calculations were made using Eq. (4), showing that the power requirements were virtually unchanged from the previous values (see Table 1). When comparing the latest and previous optima, the product bϕ̇2 did not change. The squared angular velocity ϕ̇2 increased by a factor of 5; this countered the reduction of |b|. A benefit to this counter-reduction was that the spring constant was decreased, which was already high by industry standards.
An observation made during the optimization tests while determining an acceptable γ was that the ratios of the four-bar link lengths changed significantly from one optimum to the next but did not ultimately affect the error. These ratio changes suggest a relatively stabilized optimum, which means many four-bar link ratios exist that satisfies the optimum. Furthermore, the cost function and/or the constraints may be augmented further without losing solutions that approach the target moment curve. This proves vital when considering that the four-bar mechanism will eventually need to occupy a volume similar to that of the human ankle.
With a stabilized optimum recognized, parameters were adjusted in an effort to choose a four-bar mechanism that was convenient for fabrication. The upper and lower bounds of the links were adjusted to keep the lengths within an order of magnitude. Given the scalability of the four-bar mechanism, one of the lengths l0 was constrained to a value of 1 m (later scaled to an appropriate length for a human limb). The purpose of having this constraint was to control the range (l) in which the four links assumed; the remaining three link lengths were then constrained to be within the magnitude of 1 m.
The result of these changes to the cost function and bounding criteria are characterized by the following cost function, optimum, and ability to match the moment curve in Fig. 4
| (6) |
subject to γ=0.03, l0 =1, and 0.1≤lj≤10, j=1,2,3, resulting in the final optimum values given by Eq. (7)
| (7) |
which are also included in Table 1. A final comparison with a stiffness plot (Fig. 5) shows that the four-bar mechanism with penalized energy has an excellent fit during the stance phase.
Fig. 4.
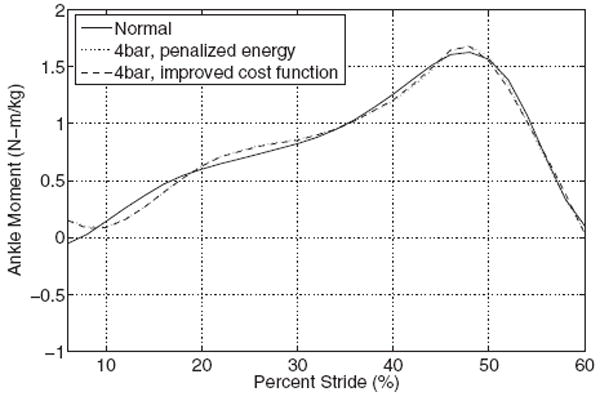
Plot of normal ankle moment and optimum with a penalized cost function
Fig. 5.
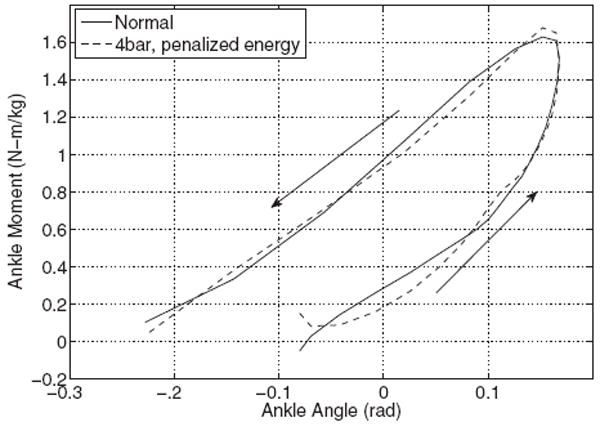
Normal ankle stiffness plotted with the latest four-bar optimum
2.5.2 Interpretation
Up to this point, b has been referred to as the energy input; greater explanation will now be offered for the active portion of the four-bar mechanism. Power is given as the moment at a joint multiplied by the angular velocity for that joint [32-35]. When calculating the moment in the formulas to follow, spring and motor contributions must be taken into consideration for this four-bar design. With this particular four-bar mechanism, the moment is applied at joint C (Fig. 3) but can be translated to the moment perceived at the ankle [6]
| (8) |
Therefore, the motor contributes
| (9) |
The values b, k, and M0 are ascribed the same meaning as before. θ̇ and θ represent angular velocity and displacement at the ankle (joint A from Fig. 3). Likewise, ϕ̇ and ϕ are the angular velocity and displacement at joint C (from Fig. 3). For each case, the motor’s contribution can be isolated through multiplying by the appropriate angular velocities. Recall that Mθmotor is given in units of N m/kg; it will be converted to moment Mmotor through multiplication by mass (kg) where 73.6 kg (161.9 lbf) is used per reasonable assumptions.
| (10) |
| (11) |
Energy is determined by calculating the area under the power curve through the use of a trapezoidal rule integration. The power curves derived from Eq. (5) and the results of the previous cost function are nearly identical. Due to the analogous optimal power curves that cover near equivalent areas, it may be concluded that they consume the same amount of energy.
For one to attribute meaning to the numbers, few assumptions and generalizations are made. Assume the 73.6 kg person walks roughly 5300 steps per day [36] at a normal speed on level ground with no head or tail winds. Only half of the steps are taken by the prosthetic device and each gait cycle (two steps per cycle) consumes 18.5 J. This translates to 49 kJ (13.6 W h) per day of walking. To illustrate, a high-capacity cell phone battery is rated at 3.7 V h and 1.4 A h. If the battery was totally discharged, it would deliver 18.7 kJ (5.18 W h); assuming full efficiency, just three of these could provide enough power for a day of walking.
For the power that is input to the four-bar mechanism, the spring constant k contributes more energy than that of the motor. In the absence of the spring, the motor would have to supply over 300 W to mimic a normal human gait. Figure 6 shows a break-down of power by contribution per component.
Fig. 6.
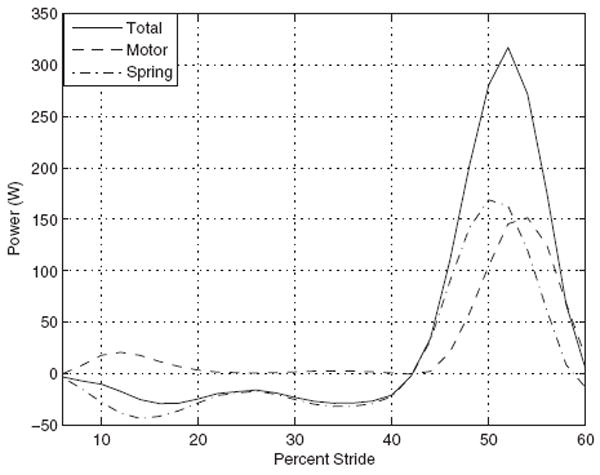
Motor and spring power contributions for 6–60% of stride
Although the initial intention of changing the cost function was to reduce power and energy demands, other benefits were made apparent such as reducing the spring constant and its preload. Also, the expanded range of angular velocities at joint C (see Fig. 3) allow for a higher resolution of control since rotational speed will be measured more easily.
3 Prototype Construction
The prototype design implementation began by meeting the power demands dictated by the final optimization (see Eq. (7)). A variety of motors with sufficient power are available but finding a small and light motor to produce the requisite torque proved unreasonable for this proof-of-concept design. Therefore, a gearhead was introduced to provide the necessary torque. A Yaskawa SGMAH-02AAN21 200 W motor powered by a 400 W SGDG-04GT amplified controller capable of PID control was chosen as the energy input device. A highly customized motor could have been fabricated to our exact specifications; however, using a gearhead allowed an easier, less expensive proof-of-concept solution while sacrificing added weight. The motor was mated to a right angle gearhead with a 10:1 ratio. The gearhead, an APEX ABR060-S2-P1, implemented was a single-stage with an efficiency rating of 95%. With the introduction of this particular gearhead, the motor only needs to provide 158 W to achieve the peak power requirement of 150 W at the ankle joint. This Yaskawa configuration does not incorporate a battery system; the unit operates on 110 V ac. A battery-powered configuration is currently being pursued.
Precision torque, displacement, and velocity values are controlled by an incremental encoder, DACs, and ADCs through the use of a dSPACE DS1104 real-time interface board. The dSPACE board allows for real-time analog and digital interactions between the servo-amplifier and the controldesk workspace. controldesk is a program run on the host computer that implements simulink models and enables the user to monitor the system’s performance, regulate inputs and outputs, and collect data from real-time processes.
As previously stated during optima refinement, the k value decreased but the resulting spring was quite stiff when compared with standard coil springs. Therefore, several spring configurations were considered. Ideal placement would have been around the motor shaft between the gearhead bracket and the end of the gearhead shaft (see original location in Fig. 7) but this was physically unattainable. The second option was to use a conventional torsion spring with anchor points on the gearhead bracket and one of the four-bar joints. The depth of the spring including its legs had to be around 1.23 cm; this configuration was quickly discarded due to insufficient cross-sectional area of the spring material. The final design used a spiral torsion spring as seen in Fig. 8, which had a depth of less than 1.27 cm while still possessing a sufficient k value. This is the configuration employed in prototype construction.
Fig. 7.
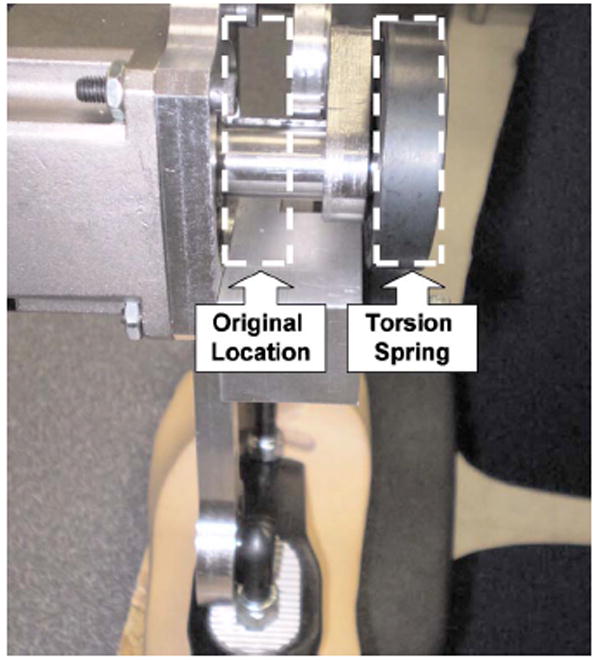
Original location for torsion spring
Fig. 8.
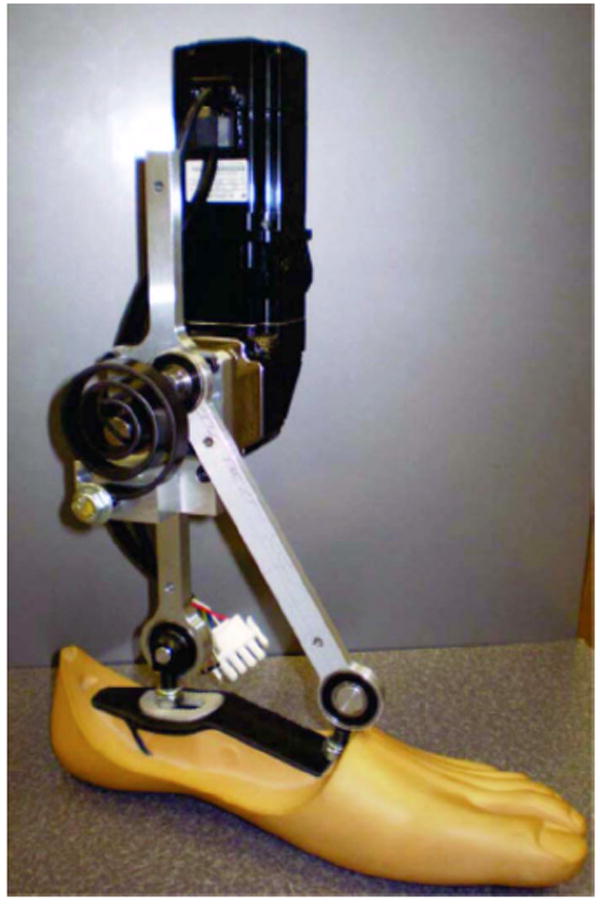
Lower limb prosthetic device prototype
Aluminum was used for three of the links in the four-bar mechanism where the foot becomes the fourth link. Calculations determined an appropriate width of 0.635 cm (0.25 in.) using aluminum 6061 would prevent buckling for the rectangular cross section. Assuming real-world conditions, double-sealed bearing joints were specified. The Endolite Multiflex foot was chosen for its size, profile, and rigidity characteristic, and thus, the other three link lengths were scaled to its parameters.
It was decided that the motor and gearhead would be attached at joint C on l0 (from Fig. 3). The range of motion of l3 and l0 (from Fig. 3) indicate a near alignment, which requires that the actual links occupy separate but parallel planes. Since joint location on the foot was predetermined, links were connected using the press-fitted bearings; these were attached from either side of the foot mounts: l0 was connected to the rear joint of the foot from the left and l2 was attached to the front mount from the right (Fig. 8 ). The last link l3 was attached to the gearhead shaft with a press-fit pin to prevent undesired rotation on the shaft. Lastly, the spiral torsion spring was press-fit into l3 and then secured to l0 at an angle that would supply the appropriate preload moment.
4 Prototype Testing
With fabrication complete (see Fig. 8), the next step was to bench test the prosthesis. Tests were conducted to ascertain how well the prototype could match the theoretical model, i.e., how well it could match the vertical reaction forces obtained by Winter [11]. Other physical limitations were made evident through the testing that had not been predicted by the analyses; these will be discussed in greater detail later in this section.
4.1 Pretest Preparations
Passive prostheses are typically fatigue tested by a MTS-type machine, which flexes the “toes” and “ankles” while the machine is oscillated in an up and down manner. The apparatus used for testing this prosthetic device employed a similar procedure but the displacement input was not of a sinusoidal or saw-toothed function; the displacement input was a specific sequence of commands meant to simulate the portion of the human gait from 6% to 60% of a normal stride. The prosthesis was driven indirectly by a MTS-type machine, which moves with one degree of freedom in the vertical direction (see Fig. 9). Motion in this direction was calculated from known ankle angle of θ for a normal gait in Ref. [8], which is seen in the vertical displacement curve (Fig. 10). Figure 9 shows the prosthesis in position before the MTS machine was set into motion. The length line of action was chosen to be the vertical alignment of the forward-most joint of the four-bar mechanism (where l1 and l2 come together) and the pin joint at the top of the mounting bracket (see Fig. 9). These points were conveniently chosen as the vertices of a triangle with two known side lengths and the corresponding angle between them and through the law of cosines, the line of action was calculated; this simplified calculations and decreased uncertainties in the analysis.
Fig. 9.
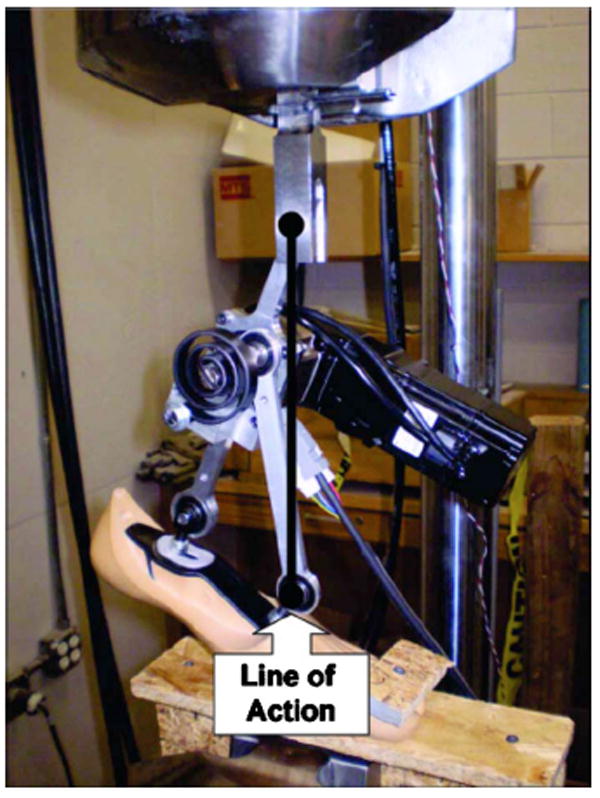
Prosthesis in MTS fixture
Fig. 10.
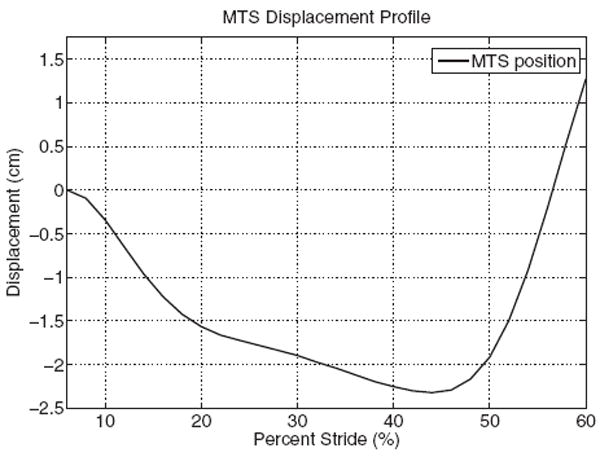
Linear displacement plot for MTS testing
Theoretical/desired reaction force values were plotted and can be seen in Fig. 11 [11]; this force curve, therefore, set the expectations for the bench testing. One reasonable assumption was that the reaction force produced by the prosthesis would be normal to the MTS mounting bracket; this was made because only the vertical component of the reaction force will be measured and compared with Winter’s vertical reaction force. The load cell on the MTS machine only records data in the axial (vertical) direction, so the tested reaction force on the load cell would be compared with that from Fig. 11.
Fig. 11.
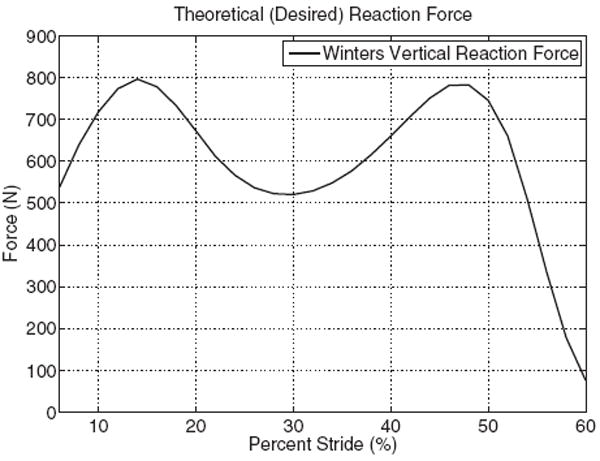
Theoretical vertical reaction force for 6–60% of stride
4.2 Testing and Data Acquisition of the Prosthesis
The response of the prosthetic device was monitored and recorded using the dSPACE board through the real-time interface. The dSPACE board is a stable, dedicated platform that runs the program software (controldesk) without interruption from background applications. Through the use of controldesk and the dSPACE interface, the motor’s response, such as torque produced, angular velocity of the shaft, voltage output, etc., was plotted and saved in real-time throughout the testing trials. This was done so that it could be analyzed and related to the reaction forces recorded by the load cell. This real-time monitoring allowed for minor modifications to the prosthesis’ driving program without having to wait for the testing to cease; this capability proved useful when voltage and velocity issues were encountered. The prosthesis runs as a closed-loop system; the optical encoder (mounted on the motor) outputs the number of pulses to which the motor rotates. This value is then sent to the dSPACE board where it is differentiated and converted to radians per second. Multiplying this value by the b value (negative damping constant) mentioned in the optimization section yields the desired motor moment for that particular portion of the stance phase. After converting this torque to its corresponding analog voltage, the dSPACE board then outputs this voltage to the motor after being amplified by the servo-amplifier. This entire process is continuously repeated as the prosthesis is run through the entire motion profile.
According to nonamputee gait data, the initial position (at 6% gait) is –3 deg [11], pointing the foot slightly downward (plantar flexed). The prosthesis was then fixed to the MTS machine in this approximate initial position; this was done by securing the foot to the mounting plate via a toe clamp bolted through the toes and raising the MTS machine until the 93 deg angle between links l0 and l1 was achieved. The MTS machine was then zeroed at this position and the start sequence was initiated. The program used to run the MTS machine then took approximately 40–45 s to zero itself about our predefined point and then ran the displacement command sequence. After the MTS program had finished, the controldesk and the force transducer data was saved and checked to ensure that the desired data characteristics were being recorded. This procedure was then repeated for several more trials at our theoretical damping constant b value. It was then decided to take several trials (of the same displacement commands) at increasing b values until the voltage limitations of the dSPACE board had been reached; this was done to ensure that a full data set had been acquired and to test the capabilities of this particular prototype design.
4.3 Limitations
The load cell recorded data at 100 Hz, which allowed for the capture of only about 63 points of data as the foot was flexed from 6% to 60% of the gait cycle at normal speed, assuming an entire cycle takes 1.134 s. The 100 Hz data acquisition of the MTS load cell was the maximum rate for this particular machine. Due to the relatively small amount of data taken by the MTS machine, multiple trials of the displacement commands were run and used in the analysis. By running these multiple trials, repeatability and precision of results were able to be observed.
After preliminary testing, it was observed that the peak reaction force was slightly less than expected and seemed to lag (not climb as rapidly) as that predicted by the theoretical model [37]. When the data had been examined, the desired velocity of the MTS machine had not been achieved; this meant that the MTS machine had been pushed past its performance capabilities and either accelerated too slowly, possibly due to having to change the direction or accelerate a hydraulic ram that possesses a large inertia, or could not produce sufficient velocities to yield the exact dynamic response desired. This can be seen in Fig. 12 where the actual (MTS) and the desired linear velocities are plotted against each other.
Fig. 12.
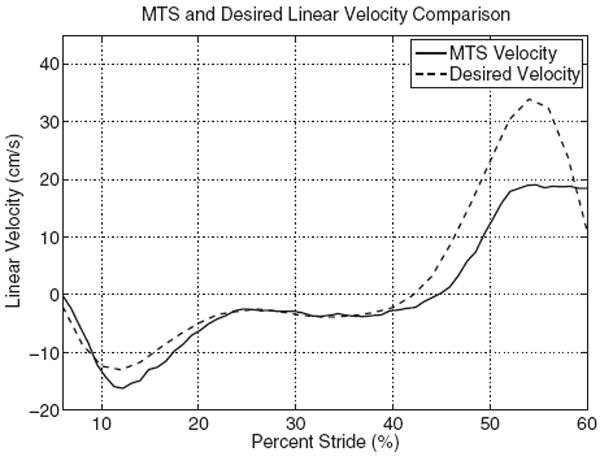
Linear velocity comparison for 6–60% of stride
Another major contributing limitation factor of these trials were issues regarding the torsional spring. There were five springs that had been originally custom manufactured for the prototype and on visual inspection of these springs, it was measured that some of the springs were up to 8 deg off from some of the others. This would cause a discrepancy when it came to the initial positioning and preloading of the prosthesis, as the springs were supposed to provide a particular moment (preload) at the beginning of the displacement command sequence. All of the springs were to have the same spring constant and were supposed to maintain this property for the range of motion that was to be imposed on it but after inspection of the prosthesis, it was noted that some of the springs had deformed slightly after series of tests had been completed. More on this discrepancy will be detailed further in the next subsection when analyzing the plotted reaction forces.
4.4 Results and Analysis
Due to the limitations of the MTS machine used and the inconsistencies realized in the torsional springs, much of the deviation away from the theoretical reaction force plot can be explained. As seen in Fig. 13, there is a relatively minor difference between the observed reaction force and that observed by Winter. The force data used to create the plot in Fig. 13 come from several sets of data taken from multiple trials. The data from these trials were averaged and then a best fit approximation using a polynomial fit with a function order of 14 was used to plot the given data against that of the desired data. This method proved more effective than filtering the data utilizing a FFT and a Butterworth filter; when the previously mentioned method was implemented, much of the reaction force’s curve characteristics, such as shape and magnitude, were diluted and suppressed. Using the polynomial fit, a correlation coefficient (R2) of 0.9917 was obtained, thus, it was decided that this would be the most accurate and efficient way to model the data.
Fig. 13.
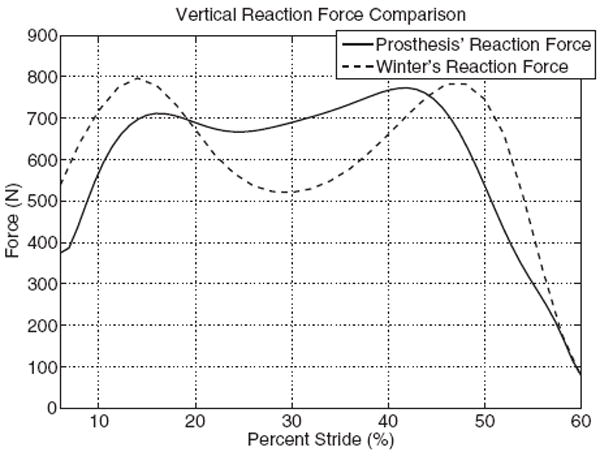
Reaction force comparison for 6–60% of stride
The first peak in the tested force plot is likely low due to the initial conditions of the system; it would seem reasonable that this can be directly linked to the initial loading of the torsion spring and its original orientation, i.e., lack of preloading. At this point, the prosthesis achieves 89.3% of the theoretical reaction force for the first peak. From Fig. 12, it is evident that the MTS machine actually exceeds (more negative in the plot) the desired velocity (this too was determined to be a partial causal effect related to the spring issue) but it should also be noted that this velocity peak occurs after the desired velocity peak. Also, due to the limitations of the MTS machine and the line of action chosen, complete foot-flat reaction forces could not be tested as the foot is not “rocked” through its profile (heel-flat to toe-off) but is driven linearly over the front most joint. It is this limitation that explains most of the deviation seen in Fig. 13).
Later in the gait cycle is where the motor’s contribution to the system becomes crucial. Since the motor does not have to produce as much torque due to not having to make up for the larger “dip” in reaction force, it actually peaks slightly earlier than that which is predicted by the theoretical model. The motor is able to produce 98.8% of the predicted reaction force in magnitude at this second peak. From Figs. 12 and 13, it can be seen that it is the MTS velocity limitation that causes the lag in the prosthesis’ reaction, as represented by the shallower slope in the force comparison plot at the end of the portion of the gait tested. The ability for the prosthesis to match the theoretical curve as well is a large accomplishment, given the conditions and limitations to which it was subjected. A motion analysis detailed in the next section will examine the limitations of the bench testing and will compare the results to those obtained through a theoretical model of the prosthesis’ motion profile.
4.5 Model Verification
Since the prosthesis could not be tested in the exact manner to which the reaction forces or ankle moments of a normal stride profile could be measured, a secondary motion/force analysis was necessary to ensure accurate and consistent results. Ideally, the moments produced at the ankle would be measured; however, this was unfeasible due to the current prototype’s design. Therefore, the reaction forces, which are more readily available but directly associated with the ankle moments, were measured. Modeling and analyzing the prototype in a computer aided engineering (CAE) program enabled the bench tested prosthesis to be compared with the theoretical model tested under similar conditions. Siemens UGS NX 6.04 was used to create a virtual representation of the prosthesis and the MTS ram used for testing, see Fig. 14. This model although simplified slightly (due to modeling considerations), has the same desired motion profile provided by the MTS machine, the motor torque control algorithm, and the torsion spring characteristics as the prototype used in the bench testing. The main differences between the model and the actual prosthesis are that the model’s spring characteristics, motion profile, and supply torques are exact and the modeled foot is solid (not deformable) and pivots in the approximate location that the actual prototype had.
Fig. 14.
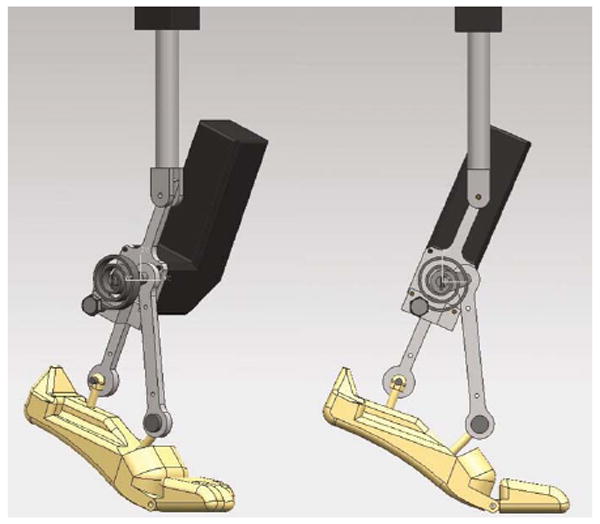
Prosthesis CAD model used in motion simulation
Once created, this model was then imposed with the proper simulation parameters (link location, joint type, actuation commands, etc.) and then exported to the ADAMS Solver program utilized by NX 6.0. ADAMS takes the model and then performs a motion simulation, which simulates the kinematics and dynamics of the system; this data is then returned to the NX 6.0 user interface and made available for further analysis. With sensors located properly, one can control input displacements, velocities, torques, and so on; this allows for precise control and feedback simulations. These sensors also allow for the output of other data; vertical reaction forces are what was of concern, so a sensor was placed on the bottom of the foot measuring the reaction force in the z-direction (direction of motion) of the model. The simulation and prosthesis vertical reaction force comparison can be seen in Fig. 15. As seen in the figure, there are two differences that are made evident. First, the reaction force produced early on by the simulated prosthesis is slightly lower than that of the prototype. This is due to the simulation’s foot not having the ability to deform to the mounting platform early on in the gait cycle, not allowing it to exert as much force as the semideformable Endolite Multiflex foot used in the prototype’s design. Second, the simulation’s reaction force decreases much more rapidly from 45% to 60% of the stride than that of the prosthesis. Having ideal circumstances, proper MTS velocities, the motion simulation allows the model to respond better than that which was bench tested. Aside from those differences, the simulation model reacts just as expected; it reaches the peak reaction force for toe-off and it shows that the preliminary bench testing yielded meaningful results, Fig. 15.
Fig. 15.
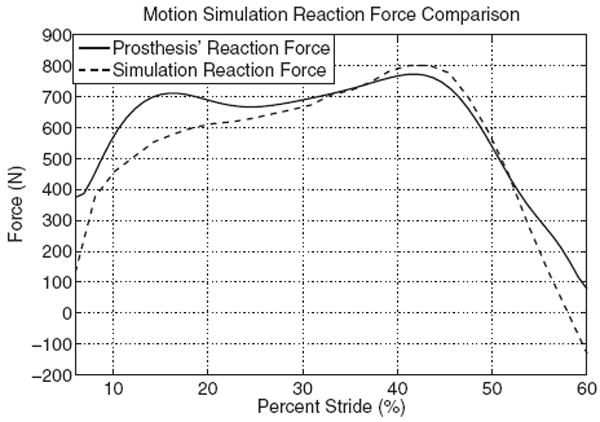
Simulation reaction force comparison for 6–60% of stride
5 Conclusions
The ability to closely match the reaction forces and therefore, ankle moments of the theoretical model demonstrates that the design intent is satisfied; it is believed that this design would enable an amputee to walk with a normal gait. A proof-of-concept prosthesis was optimized, designed, constructed, and bench tested successfully. To compliment the bench testing, a dynamic motion simulation was conducted to further illustrate that this approach could, in fact, prove itself as a viable solution. The four-bar mechanism plays a key role in matching the normal ankle moment during the stance phase of gait. The motor and spring combination integrates active and passive components that reduce the amount of energy supplied by the amputee. Through preliminary bench testing, it has been made clear that this prosthetic device has the potential of matching nonamputee ankle moments and reaction forces. Future variations of this prototype will incorporate fine-tuning of the controller to an individual’s specifications, which will maximize efficiency and effectiveness and will be designed to fit the standard nonamputee limb size and weight envelope. The stable optimum allows for additional terms to be integrated into the cost function without sacrificing accuracy and further refinement of the cost function and prototype design will produce far-reaching gains in prosthetic research.
Acknowledgments
This work is partially supported by a grant from the University of South Carolina Research and Productive Scholarship Fund and the National Institute of Health (NIH) under Grant No. 1R21EB006840.
Footnotes
Contributed by the Mechanisms and Robotics Committee of ASME for publication in the Journal of Mechanisms and Robotics
Note: Ankle moments are taken about the axis perpendicular to the sagittal plane.
The matlab fmincon function uses a sequential quadratic programming method with a line search. For more information, see online matlab help pages [30].
Siemens UGS NX 6.0 is a computer aided drafting (CAD) program that calls other “behind-the-scenes” solvers, making it a powerful and versatile CAE program capable of motion, FEM, fluid, etc., simulations.
Contributor Information
Bryan J. Bergelin, Department of Mechanical Engineering, Marquette University, Milwaukee, WI 53233, bryan.bergelin@marquette.edu
Javier O. Mattos, 121 Kingston Ridge Drive, Columbia, SC 29209, percussivebrass@earthlink.net
Joseph G. Wells, Jr, REI Automation, Inc., Columbia, SC 29209.
Philip A. Voglewede, Department of Mechanical Engineering, Marquette University, Milwaukee, WI 53233, philip.voglewede@marquette.edu
References
- 1.McMulkin ML, Osebold WR, Mildes RD, Rosenquist RS. Comparison of Three Pediatric Prosthetic Feet During Functional Acivities. Journal of Prosthetics and Orthotics. 2004;16(3):78–84. [Google Scholar]
- 2.Lehmann JF, Price R, Boswell-Bessette S, Dralle A, Questad K. Comprehensive Analysis of Dynamic Elastic Response Feet: Seattle Ankle/Lite Foot Versus Sach Foot. Arch Phys Med Rehabil. 1993;74(8):853–861. doi: 10.1016/0003-9993(93)90013-z. [DOI] [PubMed] [Google Scholar]
- 3.Lehmann JF, Price R, Boswell-Bessette S, Dralle A, Questad K, DeLateur BJ. Comprehensive Analysis of Energy Storing Prosthetic Feet: Flex Foot and Seattle Foot Versus Standard Sach Foot. Arch Phys Med Rehabil. 1993;74(11):1225–1231. [PubMed] [Google Scholar]
- 4.Torburn L, Powers CM, Guiterrez R, Perry J. Energy Expenditure During Ambulation in Dysvascular and Traumatic Below-Knee Amputees; A Comparison of Five Prosthetic Feet. J Rehabil Res Dev. 1995;32(2):111–119. [PubMed] [Google Scholar]
- 5.Hansen A, Childress D, Miff S, Gard S, Mesplay K. The Human Ankle During Walking: Implications for Design of Biomimetic Ankle Prostheses. J Biomech. 2004;37:1467–1474. doi: 10.1016/j.jbiomech.2004.01.017. [DOI] [PubMed] [Google Scholar]
- 6.Wells J, Jr, Voglewede P, Rocheleau D. Paper No. DETC2005-85083. ASME; 2005. Design for Improved Trans-Tibial Prosthetic Devices Using Four Bar Mechanisms. [Google Scholar]
- 7.Perry J, Boyd L, Rao S, Mulroy S. Prosthetic Weight Acceptance Mechanics in Transtibial Amputees Wearing the Single Axis, Seattle Lite, and Flex Foot. IEEE Trans Rehabil Eng. 1997;5(4):283–289. doi: 10.1109/86.650279. [DOI] [PubMed] [Google Scholar]
- 8.Winter D. Biomechanics and Motor Control of Human Movement. 3. University of Waterloo Press; Waterloo, Ont., Canada: 2005. [Google Scholar]
- 9.Silverman A, Fey N, Portillo A, Walden J, Bosker G, Neptune R. Compensatory Mechanisms in Below-Knee Amputee Gait in Response to Increasing Steady-State Walking Speeds. Gait and Posture. 2008;28:602–609. doi: 10.1016/j.gaitpost.2008.04.005. [DOI] [PubMed] [Google Scholar]
- 10.Aaron R, Herr H, Ciombor D, Hochberg L, Donoghue J, Briant C, Morgan J, Ehrlich M. Horizons in Prosthesis Development for the Restoration of Limb Function. J Am Acad Orthop Surg. 2006;14(10):S198–S204. doi: 10.5435/00124635-200600001-00043. [DOI] [PubMed] [Google Scholar]
- 11.Winter D. The Biomechanics and Motor Control of Human Gait. 2. University of Waterloo Press; Waterloo, Ont., Canada: 1991. [Google Scholar]
- 12.Hansen A, Childress D, Knox E. Clin Biomech. Vol. 19. Bristol, Avon: 2004. Roll-Over Shapes of Human Locomotor Systems: Effects of Walking Speed; pp. 407–414. [DOI] [PubMed] [Google Scholar]
- 13.Thomas S, Buckon C, Helper D, Turner N, Moor M, Krajbich J. Comparison of the Seattle Lite Foot and Genesis II Prosthetic Foot During Walking and Running. Journal of Prosthetics and Orthotics. 2000;12(1):9–14. [Google Scholar]
- 14.Au S, Weber J, Herr H. Powered Ankle-Foot Prosthesis Improves Walking Metabolic Economy. IEEE Trans Rob Autom. 2009;25(1):51–66. [Google Scholar]
- 15.Hollander K, Ilg R, Sugar T, Herring D. An Efficient Robotic Tendon for Gait Assistance. J Biomech Eng. 2006;128(5):788–791. doi: 10.1115/1.2264391. [DOI] [PubMed] [Google Scholar]
- 16.Hitt J, Bellman R, Holgate M, Sugar T, Hollander K. Paper No. DETC2007-34512. ASME; 2007. The SPARKy (Spring Ankle With Regenerative Kinetics) Project: Design and Analysis of a Robotic Transtibial Prosthesis With Regenerative Kinetics. [Google Scholar]
- 17.Bellman R, Holgate M, Sugar T. SPARKy 3: Design of an Active Robotic Ankle Prosthesis With Two Actuated Degrees of Freedom Using Regenerative Kinetics. Proceedings of the Second Biennial IEEE/RASEMBS International Conference on Biomedical Robotics and Biomechatronics. 2008:511–516. [Google Scholar]
- 18.Au S, Herr H, Weber J, Martinez E. Powered Ankle-Foot Prosthesis for the Improvement of Amputee Ambulation. Proceedings of the 2007 IEEE EMBS Annual International Conference. 2007 doi: 10.1109/IEMBS.2007.4352965. [DOI] [PubMed] [Google Scholar]
- 19.Au S, Berniker M, Herr H. Powered Ankle-Foot Prosthesis to Assist Level-Ground and Stair-Descent Gaits. Neural Networks. 2008;21:654–666. doi: 10.1016/j.neunet.2008.03.006. [DOI] [PubMed] [Google Scholar]
- 20.Klute G, Czerniecki J, Hannaford B. Development of Powered Prosthetic Lower Limb. Proceedings of the First National Meeting, Veterans Affairs Rehabilitation, R&D Service 1998 [Google Scholar]
- 21.Versluys R, Desomer A, Lenaerts G, Van Damme M, Beyl P, Van der Perre G, Peeraer L, Lefeber D. A Pneumatically Powered Below-Knee Prosthesis: Design Specification and First Experiments With an Amputee. Proceedings of the Second Biennial IEEE/RAS-EMBS International Conference on Biomedical Robotics and Biomechatronics. 2008:372–377. [Google Scholar]
- 22.Sup F, Bohara A, Goldfarb M. Design and Control of a Powered Transfemoral Prosthesis. Int J Robot Res. 2008;27(2):263–273. doi: 10.1177/0278364907084588. [DOI] [PMC free article] [PubMed] [Google Scholar]
- 23.Sup F, Varol H, Mitchell J, Withrow T, Goldfarb M. Self-Contained Powered Knee and Ankle Prosthesis: Initial Evaluation on a Transfemoral Amputee. Proceedings of the IEEE International Conference on Rehabilitation Robotics. 2009:638–644. doi: 10.1109/ICORR.2009.5209625. [DOI] [PMC free article] [PubMed] [Google Scholar]
- 24.Zlatnik D, Steiner B, Schweitzer G. Finite-State Control of a Trans-Femoral (TF) Prosthesis. IEEE Trans Control Syst Technol. 2002;10(3):408–420. [Google Scholar]
- 25.Holgate M, Hitt J, Bellman R, Sugar T, Hollander K. The SPARKy (Spring Ankle With Regenerative Kinetics) Project: Choosing a dc Motor Based Actuation Method. Proceedings of the IEEE/RAS-EMBS International Conference on Biomedical Robotics and Biomechatronics. 2008:163–168. [Google Scholar]
- 26.Holgate M, Böhler A, Sugar T. Control Algorithms for Ankle Robots: A Reflection on the State-of-the-Art and Presentation of Two Novel Algorithms. Proceedings of the IEEE/RAS-EMBS International Conference on Biomedical Robotics and Biomechatronics. 2008:97–102. [Google Scholar]
- 27.Holgate M, Sugar T, Böhler A. A Novel Control Algorithm for Wearable Robotics Using Phase Plane Invariants. Proceedings of the IEEE International Conference on Robotics and Automation. 2009:3845–3850. [Google Scholar]
- 28.Mattos J, Kane E, Voglewede P. Paper No. DETC2007-34768. ASME; 2007. Active Component Lower Limb Prosthetic Device Research: Concept and Design. [Google Scholar]
- 29.Norton R. Design of Machinery: An Introduction to the Synthesis and Analysis of Mechanisms and Machines. 3. McGraw-Hill; New York: 2004. [Google Scholar]
- 30.matlab online help page. http://www.mathworks.com/access/helpdesk/help/toolbox/optim/fmincon.html.
- 31.Rao S. Engineering Optimization: Theory and Practice. 3. Wiley Interscience; New York: 1996. [Google Scholar]
- 32.Winter D. Energy Generation and Absorption at the Ankle and Knee During Fast, Natural, and Slow Cadences. Clin Orthop Relat Res. 1983;175:147–154. [PubMed] [Google Scholar]
- 33.Prince F, Winter D, Sjonnensen G, Powell C, Wheeldon R. Mechanical Efficiency During Gait of Adults With Transtibial Amputation: A Pilot Study Comparing the Sach, Seattle, and Golden-Ankle Prosthetic Feet. J Rehabil Res Dev. 1998;35(2):177–185. [PubMed] [Google Scholar]
- 34.Cummings DR, Kapp S, Craig J. Prosthetic Foot/Ankle Mechanisms Course. Online course sponsored by the American Academy of Orthotics and Prosthetics. Online Learning Center, Project Quantum Leap 2006 [Google Scholar]
- 35.Gitter A, Czerniecki J, DeGroot D. Biomechanical Analysis of the Influence of Prosthetic Feet on Below-Knee Amputee Walking. Am J Phys Med Rehabil. 1991;70(3):142–148. doi: 10.1097/00002060-199106000-00006. [DOI] [PubMed] [Google Scholar]
- 36.Harris Interactive, Inc. AOM National Step Survey. [11/6/07];2003 [Google Scholar]
- 37.Mattos J. MS thesis, Department of Mechanical Engineering, University of South Carolina. 2007. The Design, Building, and Preliminary Testing of a Powered Ankle Prosthesis. [Google Scholar]


