

Abstract
Objectives. We estimated the number of deaths attributable to social factors in the United States.
Methods. We conducted a MEDLINE search for all English-language articles published between 1980 and 2007 with estimates of the relation between social factors and adult all-cause mortality. We calculated summary relative risk estimates of mortality, and we obtained and used prevalence estimates for each social factor to calculate the population-attributable fraction for each factor. We then calculated the number of deaths attributable to each social factor in the United States in 2000.
Results. Approximately 245 000 deaths in the United States in 2000 were attributable to low education, 176 000 to racial segregation, 162 000 to low social support, 133 000 to individual-level poverty, 119 000 to income inequality, and 39 000 to area-level poverty.
Conclusions. The estimated number of deaths attributable to social factors in the United States is comparable to the number attributed to pathophysiological and behavioral causes. These findings argue for a broader public health conceptualization of the causes of mortality and an expansive policy approach that considers how social factors can be addressed to improve the health of populations.
In 1993, an article provocatively titled “Actual Causes of Death in the United States” offered a new conceptualization of cause-of-death classification, one that acknowledged and quantified the contributions of behavior rather than the more typical pathological explanations recorded on death certificates.1 The authors, McGinnis and Foege, found that the most prominent contributor to mortality in 1990 was tobacco (400 000 deaths), followed by diet and activity patterns (300 000 deaths). A decade later, updated findings by Mokdad et al.2 using data from 2000 showed progress in some areas but the growing contribution of obesogenic behavior (poor diet and physical inactivity). Despite controversy over the methods used to derive the attributable numbers of deaths and the validity of their estimates, especially in the article by Mokdad et al., the findings of both articles have been influential, are frequently cited and debated in the peer-reviewed literature,3–12 and have been cited in discussions of national public health priorities.13
In a 2004 editorial accompanying the article by Mokdad et al., McGinnis and Foege noted that although
it is also important to better capture and apply evidence about the centrality of social circumstances to health status and outcomes … the data are still not crisp enough to quantify the contributions [of social circumstances] in the same fashion as many other factors.14(p1264)
In the past 15 years, there has been growing interest in the social determinants of health, and several proposed frameworks describe the effects on individual and population health of social factors at multiple levels, including behavioral factors, features of an individual's social network and neighborhood, and social and economic policies.15,16 Numerous studies have demonstrated a link between mortality and social factors such as poverty and low education. Although the proposed causal chain linking adverse social factors to poor health is complicated, the evidence points to mechanisms including risky health behaviors (e.g., smoking), inadequate access to health care, and poor nutrition, housing conditions, or work environments.17–20 Social relationships have also been linked to mortality, as social ties influence health behaviors and social support buffers against stress, which in turn affects immune function, cardiovascular activity, and the progression of existing disease.21,22 Negative social interactions, including discrimination, have been linked to elevated mortality rates, potentially through adverse effects on mental and physical health as well as decreased access to resources.23,24 Finally, characteristics of one's residential environment may influence mortality through investment in health and social services in the community, effects of the built environment, and exposure to violence, stress, and social norms that promote adverse health behaviors.25–28
To date, few studies have provided population estimates of deaths attributable to social factors. For example, 1 study estimated that over 1 million deaths from 1996 to 2002 would have been avoided if all adults in the US population had at least a college education.29 Other studies have estimated attributable fractions for mortality of 2% to 6% for poverty (depending on the year and data source),30,31 9% to 25% for income inequality (depending on age group),32 and 18% to 25% for low neighborhood socioeconomic status (depending on gender and racial/ethnic group).33 Building on these previous efforts, we aimed to estimate the number of deaths in the United States attributable to social factors, using a systematic review of the available literature combined with vital statistics data.
METHODS
To calculate the number of deaths attributable to social factors in the United States, we first estimated the relative risk (RR) of mortality associated with each social factor and obtained an estimate of the prevalence of each social factor in the United States. These estimates were used to calculate the population-attributable fraction of mortality for each factor, which was multiplied by the total number of deaths in the United States in 2000 to estimate the number of deaths attributable to each social factor.
Relative Risk Estimates
We conducted a MEDLINE search for all English-language articles published between 1980 and 2007 with estimates of the relation between individual- and area-level social factors and adult all-cause mortality. Individual-level social factors included education, poverty, health insurance status, employment status and job stress, social support, racism or discrimination, housing conditions, and early childhood stressors. Area-level social factors included area-level poverty, income inequality, deteriorating built environment, racial segregation, crime and violence, social capital, and availability of open or green spaces. We identified these articles to extract RR estimates from independent samples that could be combined through meta-analysis to obtain summary RR estimates for the relations between each social factor and mortality.
The included studies presented data sufficient for calculating an estimate of the association between at least 1 of the social factors of interest and adult all-cause mortality, using unweighted counts, RR estimates, regression coefficients, or mortality rates. For studies that concerned multiple levels of analysis, we included only those that appropriately used multilevel analytic methods. Figure 1 summarizes the studies that we considered, included, and excluded. We excluded articles presenting results from studies conducted outside of the United States, those limited to participants with a history of disease or using composite measures of socioeconomic status, and those that did not use adult all-cause mortality as an outcome measure. We also excluded review articles, articles providing insufficient data to calculate RR estimates, and articles presenting data only for proxy measures of the social factors of interest. This left a total of 120 eligible studies.
FIGURE 1.

Flow diagram of studies considered for meta-analyses to derive summary relative risk (RR) estimates for each social factor in relation to mortality.
Note. SES = socioeconomic status.
Further criteria for inclusion in the meta-analyses included the presentation of SE or other variance estimates to allow calculation of an approximate 95% confidence interval (CI) for a dichotomous contrast in the social factor of interest (e.g., low vs high educational attainment). Additionally, RR estimates unadjusted for potential mediators of the relation between the social factor and mortality were desired; however, this requirement was relaxed for estimates of the effect of area-level social factors since nearly all estimates in the literature were adjusted. Finally, we decided a priori to limit meta-analyses to social factors for which at least 3 RR estimates from separate studies were available.
We extracted RR estimates from the remaining 60 studies for the following factors: education, poverty, social support, area-level poverty, income inequality, and racial segregation. Because meta-analyses must be conducted on nonoverlapping samples,34 we excluded an additional 13 articles because they provided only estimates for samples already represented by other articles. When multiple articles provided data for the same sample, we selected estimates incorporating the largest sample size, the longest duration of follow-up, and the fewest restrictions on the sample in terms of age group or gender; additionally, we preferred estimates incorporating person–time data from longitudinal studies. The final 47 studies used in the meta-analyses are summarized in Table 1.
TABLE 1.
Studies Included in Meta-Analyses of Relation Between Social Factors and Adult All-Cause Mortality in the United States in 2000
| References | Social Factorsa | Sources of Data | Sampleb | Yearsc |
| Anderson et al.17 | Poverty, aged 25–64 and ≥ 65 y; area-level poverty | National Longitudinal Mortality Study and Census data | 233 600 White and Black men and women who could be linked to census tract; number of areas not reported | 1979–1989 |
| Backlund et al.18 | Low education, aged 25–64 y | National Longitudinal Mortality Study | 415 224 men and women aged 25–64 y with complete information for all covariates of interest | 1979–1989 |
| Bassuk et al.35 | Low education, aged ≥ 65 y; poverty, aged ≥ 65 y | EPESE | 14 456 men and women aged ≥ 65 y from East Boston, MA; rural Iowa; New Haven, CT; and Piedmont, NC | 1982–1995 |
| Batty et al.36 | Low education, aged 25–64 y; poverty, aged 25–64 y | Vietnam Experience Study | 4 316 men aged 30–49 y who entered military service in the 1960s and 1970s and who participated in a telephone interview in 1985 and a medical examination in 1986 | 1985–2000 |
| Beebe-Dimmer et al.37 | Low education, aged 25–64 y; poverty, aged 25–64 y | Alameda County Study | 3 087 women aged 17–94 y with complete information on socioeconomic position at baseline | 1965–1996 |
| Blazer38 | Low social support, aged ≥ 65 y | Community-based elderly living in Durham County, NC | 331 men and women aged 65 y or older who were included in 30-mo follow-up study | 1972–1975 |
| Bucher and Ragland39 | Low education, aged 25–64 y; poverty, aged 25–64 y | Western Collaborative Group Study | 3 154 White men aged 39–59 y who were free from coronary heart disease or other obvious health problems at baseline | 1961–1983 |
| Cerhan and Wallace40 | Low social support, aged ≥ 65 y | Iowa 65+ Rural Health Study (part of EPESE) | 2 575 men and women aged ≥ 65 y living in Iowa and Washington counties, IA who were interviewed in person at both baseline and follow-up | 1981–1993 |
| Cooper et al.41 | Area-level poverty; income inequality; racial segregation | NCHS and US Census data | White and Black men and women aged < 65 y in metropolitan areas with complete information for all covariates of interest; number of areas: 267 metropolitan areas | 1989–1991 |
| Daly et al.42 | Income inequality | Panel Study of Income Dynamics (PSID) and census data | Men and women aged ≥ 25 y who participated in PSID in 1988; number of areas: 50 states | 1988–1992 |
| Eng et al.21 | Low social support, aged 25–64 y | Health Professionals Follow-Up Study | 28 369 male health professionals aged 40–75 y who did not have preexisting disease prior to 1988 and who provided social network data | 1986–1998 |
| Feinglass et al.43 | Low education, aged 25–64 y; poverty, aged 25–64 y | Health and Retirement Study | 9 759 men and women aged 51–61 y living in the contiguous United States | 1992–2002 |
| Feldman et al.44 | Low education, aged ≥ 65 y | NHANES I, NHEFS | 1 395 White men aged 65–74 y with complete information for all covariates of interest | 1971–1984 |
| Fiscella and Franks45 | Poverty, aged 25–64 y | NHANES I, NHEFS | 6 582 White and Black men and women aged 25–74 y with complete information on psychological distress | 1971–1987 |
| Fiscella and Franks27 | Income inequality | NHANES I, NHEFS | 13 280 men and women aged 25–74 y with complete information for all covariates of interest; number of areas: 105 counties or combined county areas | 1971–1987 |
| Franks et al.46 | Low education, aged 25–64 y | NHANES I, NHEFS | 4 882 White and Black men and women aged 25–74 y with information on health insurance status and who did not have publicly funded health insurance | 1971–1987 |
| Greenfield et al.47 | Low social support, aged 25–64 y | National Alcohol Survey | 5 093 men and women aged ≥ 18 y with information on alcohol consumption and depression | 1984–1995 |
| Haan et al. 48 | Area-level povertyd | Alameda County Study | 1 811 men and women aged ≥ 35 y who were residents of Oakland, California in 1965; number of areas not applicable | 1965–1974 |
| Hahn et al. 30 | Poverty, aged ≥ 65 y | NHANES I, NHEFS | White and Black men aged ≥ 65 y with complete information on all covariates of interest | 1971–1984 |
| Kawachi and Kennedy49 | Income inequality | Compressed Mortality Files and Census data | Total population of the US in 1990; number of areas: 50 states | 1990 |
| Kennedy et al.50 | Income inequality | Compressed Mortality Files and Census data | Total population of the US in 1990; number of areas: 50 states | 1990 |
| Krieger et al.51 | Area-level poverty; income inequality | Public Health Disparities Geocoding Project | Men aged < 65 y residing in Massachusetts or Rhode Island; number of areas: 1 566 census tracts | 1989–1991 |
| Lantz et al.52 | Low education, aged 25–64 y; poverty, aged 25–64 y | Americans' Changing Lives | 1 358 men aged ≥ 25 y in the contiguous United States | 1986–1994 |
| Liu et al.53 | ||||
| (1) | Low education, aged 25–64 y | Chicago Heart Association Detection Project | 8 047 White men aged 40–59 y who were free of myocardial infarction at baseline | 1967–1978 |
| (2) | Low education, aged 25–64 y | Chicago Peoples Gas Company and Western Electric Company studies | 2 980 White men aged 40–59 y who were free of clinical coronary heart disease at baseline | 1957–1980 |
| Lochner et al.54 | Income inequality | National Health Interview Survey and Current Population Survey | 546 888 non-Hispanic White and Black men and women aged 18–74 y; number of areas: 48 states | 1987–1995 |
| Mare55 | Low education, aged 25–64 y | National Longitudinal Survey of Labor Market Experiences of Mature Men | 5 020 men aged 44–61 y | 1966–1983 |
| McDonough et al.56 | Low education, aged 25–64 y; poverty, aged 25–64 y | PSID | For this analysis, PSID sample was converted into 14 10-y panels, with total of 46 197 observations; each panel was restricted to individuals aged ≥ 45 y in middle of 10-y period | 1968–1989 |
| McLaughlin and Stokes57 | Area-level poverty; racial segregation | Compressed Mortality files and census data | Total population of the contiguous US; number of areas: 3 067 counties | 1988–1992 |
| Muennig et al.31 | Poverty, aged ≥ 65 y | National Health Interview Survey | Men and women aged 65–74 y | 1990–1995 |
| Muntaner et al.58 | Poverty, aged 25–64 y | National Health Interview Survey | 377 129 men and women aged 25–64 y who were in civilian labor force at baseline and provided sufficient information about their occupation or industry to be classified by economic sector | 1986–1997 |
| Qureshi et al.59 | Low education, aged 25–64 y | NHANES I, NHEFS, NHANES II Mortality Follow-up Study | 14 407 NHANES I participants aged 25–74 y, and 9 252 NHANES II participants aged 30–74 y in 1976–1980 | 1971–1992 |
| Rehkopf et al.60 | Low education, aged 25–64 and ≥ 65 y; area-level poverty | Vital statistics and Census data | Total population of MA census tracts; number of areas not reported | 1999–2001 |
| Reidpath61 | Area-level poverty; racial segregation | Compressed Mortality files and census data | Total population of the United States; number of areas: 50 states | 1989–1991 |
| Robbins and Webb62 | Area-level poverty | Vital statistics and Census data | Total population of Philadelphia, PA, census tracts; number of areas not reported | 1999–2001 |
| Rogot et al.63 | Low education, aged ≥ 65 y | National Longitudinal Mortality Study | 115 237 White and Black men and women aged ≥ 65 y | 1979–1985 |
| Rutledge et al.64 | Low education, aged ≥ 65 y; low social support, aged ≥ 65 y | Study of Osteoporotic Fractures | 7 524 White community-dwelling women aged ≥ 65 y who had no history of bilateral hip replacement and who completed social network scale at follow-up | 1988–1996 |
| Schoenbach et al.65 | Low social support, aged 25–64 and ≥ 65 y | Evans County Cardiovascular Epidemiologic Study | 2 059 residents of Evans County, GA, with complete data on social networks and mortality | 1967–1980 |
| Schulz et al.66 | Low education, aged ≥ 65 y | Cardiovascular Health Study | 5 201 men and women aged ≥ 65 y living in Forsyth County, NC; Washington County, MD; Sacramento County, CA; and Allegheny County, PA | 1989–1995 |
| Smith et al.67,68 | Poverty, aged 25–64 y | Multiple Risk Factor Intervention Trial screening | 320 909 White and Black men aged 35–57 y | 1973–1990 |
| Snowdon et al.69 | Low education, aged 25–64 and ≥ 65 y | Nun Study | 306 Roman Catholic nuns aged ≥ 50 y from Mankato, MN, province of School Sisters of Notre Dame | 1936–1988 |
| Steenland et al.70 | ||||
| (1) | Low education, aged 25–64 y | CPS-I | 1 051 038 men and women aged ≥ 30 y from 25 states in the United States | 1959–1972 |
| (2) | Low education, aged 25–64 y | CPS-II | 1 184 657 men and women aged ≥ 30 y nationwide | 1982–1996 |
| Thomas et al.71 | Area-level poverty | Multiple Risk Factor Intervention Trial screening | 293 138 men aged 35–57 y with complete baseline health and median household income data; number of areas: 14 031 census tracts | 1973–1999 |
| Turra and Goldman72 | Low education, aged 25–64 y | National Health Interview Survey | 331 079 Hispanic and non-Hispanic native-born White men and women aged ≥ 25 y with complete information for all covariates of interest | 1989–1997 |
| Waitzman and Smith26 | Area-level povertyd | NHANES I, NHEFS | 10 161 White and Black men and women aged 25–74 y with complete information on covariates and vital status; number of areas not applicabled | 1971–1987 |
| Yabroff and Gordis73 | ||||
| (1) | Area-level poverty | National Multiple Cause of Death File and census data | White and Black women aged ≥ 55 y in United States; number of areas: 413 counties for estimate | 1990–1991 |
| (2) | Area-level poverty | NHIS | 111 776 White and Black women aged ≥ 55 y who participated in NHIS in 1987–1993; number of areas: 284 counties or clusters of counties for estimate | 1987–1995 |
| Young and Lyson74 | Area-level poverty | Bureau of Health Professions Area Resource File and Census data | Total population of contiguous United States; number of areas: 3 023 counties | 1989–1991 |
Note. CPS = Cancer Prevention Study; EPESE = Established Populations for Epidemiologic Studies of the Elderly; NCHS = National Center for Health Statistics; NHANES I = National Health and Examination Survey I; NHEFS = NHANES I Epidemiological Follow-Up Survey; NHIS = National Health Interview Survey; PSID = Panel Study of Income Dynamics.
Social factors for which each study contributed estimates in the meta-analysis.
Sample from which the estimate included in the meta-analysis was obtained; age refers to age of the sample at baseline. For studies providing estimates for area-level social factors (area-level poverty, income inequality, racial segregation), the number of areas included is also provided when possible.
The range of years for each study reflects the earliest year of baseline data collection (at which the social factor was measured) through the last year of mortality follow-up.
Area-level poverty defined as residence in a federally designated poverty area.
From each of the 47 articles, we extracted unadjusted RR estimates if provided; otherwise, we calculated RR estimates using unweighted or weighted counts, regression coefficients, or mortality rates according to standard methods.34 The cutpoints used for dichotomous contrasts for each social factor, which are summarized in Table 2, were based on definitions most commonly used in the included studies and the literature on these social factors more generally.
TABLE 2.
Definitions Used to Calculate Dichotomous Contrasts for the Association Between Each Social Factor and Adult All-Cause Mortality and Prevalence Estimates for Each Social Factor: United States, 2000
| Definition for RR Estimates From Studies | Prevalence Estimates Used in PAF Calculationsa |
||
| Social Factor | Definition | Source | |
| Low education | < high school vs ≥ high school diploma or equivalent | % of adult population with < high school education | US Census Bureau Summary File 375 |
| Poverty | Annual household income of < $10 000 vs ≥ $10 000b | % of adult population living below the poverty level | US Census Bureau Summary File 375 |
| Low social support | “Low” vs “high” score on a social network indexc | % of adult population with score of 0 or 1 on social network indexc | National Health and Nutrition Examination Survey III76 |
| Area-level poverty | ≥ 20% of population living below poverty level vs < 20% living below poverty leveld | % of adult population living in counties with ≥ 20% of population living below the poverty level | US Census Bureau Summary File 375 |
| Income inequality | Gini coefficient 1 SD above the mean vs the mean value | % of adult population living in counties with Gini coefficient at or above the 25th percentilee | US Census Bureau, derived from household income data75 |
| Racial segregation | % Black 1 SD above the mean vs the mean value | % of adult population living in counties with ≥ 25% of population reporting their race/ethnicity as non-Hispanic Black | US Census Bureau Summary File 177 |
Note. PAF = population attributable fraction; RR = relative risk.
Adult population was defined as those aged ≥ 25 years.
$10 000 roughly corresponded to the poverty threshold for a family of 4 in the early to mid-1980s,78 when many of the included studies were conducted.
Social network indices in most included studies were based on that developed by Berkman and Syme79; low scores indicated few social ties. The social network index included in NHANES III, from which the prevalence estimate was derived, ranged from 0 to 4, and included indicators of marriage or partnership, contact with friends and relatives, frequency of church or religious service attendance, and participation in voluntary organizations.76
20% or more of population living below the poverty level corresponds to the criteria for a “poverty area” put forth by the US Census Bureau.80
A Gini coefficient in the top 25th percentile (0.459) represents areas with the highest levels of income inequality in the United States.
When possible, we extracted age-specific estimates for 2 broad age groups, those aged 25 to 64 years at baseline and those aged 65 years or older at baseline. Although some evidence suggests that the relation between the social factors of interest and mortality decreases with age,19 most deaths occur among older individuals. Altogether, we extracted 68 estimates from the 47 articles, as summarized in Figure 1. We calculated summary statistics for each social factor using Comprehensive Meta-Analysis version 2 (Biostat, Englewood, NJ). We used random-effects models for all summary estimates, taking into account unmeasured heterogeneity in effect estimates across studies and allowing greater weight to be given to studies conducted on smaller samples than when using fixed-effects models.34
Prevalence Estimates and Mortality Data
Estimates of the prevalence of each social factor in the US adult population (aged ≥ 25 years) were obtained from the 2000 US Census,75,77 except for the prevalence of low social support, which was obtained from the Third National Health and Nutrition Examination Survey (NHANES III).76 To derive prevalence estimates, we used cutpoints as similar as possible to those used when calculating dichotomous contrasts for each of the included studies. Table 2 summarizes the definitions and sources of data used to obtain prevalence estimates for each social factor, and prevalence estimates for each factor are presented in Table 3.
TABLE 3.
Calculation of the Number of US Deaths in 2000 Attributable to Each Social Factor
| Social Factor and Age Group | RR (95% CI)a | Prevalence, %b | PAF, %c | Total Deaths,d No. | Deaths Attributable to Social Factor,e No. |
| Individual-level factors | |||||
| Low education | |||||
| Aged ≥ 25 y | 244 526 | ||||
| Aged 25–64 y | 1.81 (1.64, 2.00) | 16.1 | 11.5 | 972 645 | 112 209 |
| Aged ≥ 65 y | 1.23 (0.86, 1.76) | 34.5 | 7.4 | 1 799 825 | 132 317 |
| Poverty | |||||
| Aged ≥ 25 y | 133 250 | ||||
| Aged 25–64 y | 1.75 (1.51, 2.04) | 9.5 | 6.7 | 972 645 | 64 692 |
| Aged ≥ 65 y | 1.40 (1.37, 1.43) | 9.9 | 3.8 | 1 799 825 | 68 558 |
| Low social support | |||||
| Aged ≥ 25 y | 161 522 | ||||
| Aged 25–64 y | 1.34 (1.23, 1.47) | 21.0 | 6.7 | 972 645 | 64 819 |
| Aged ≥ 65 y | 1.34 (1.16, 1.55) | 16.7 | 5.4 | 1 799 825 | 96 703 |
| Area-level factorsf | |||||
| Area-level poverty | 1.22 (1.17, 1.28) | 7.8 | 1.7 | 2 331 261 | 39 330 |
| Income inequality | 1.17 (1.06, 1.29) | 31.7 | 5.1 | 2 331 261 | 119 208 |
| Racial segregation | 1.59 (1.31, 1.94) | 13.8 | 7.5 | 2 331 261 | 175 520 |
Note. CI = confidence interval; PAF = population attributable fraction; RR = relative risk.
Summary relative risk estimates derived from meta-analyses as described in Methods.
Prevalence of each social factor in the US population of the relevant age, according to 2000 US Census data, except low social support, according to data from the Third National Health and Nutrition Examination Survey, as reported in Ford et al., 2006.76
PAF = ([p(RR–1)] / [p(RR–1) + 1]) × 100, where p is the prevalence expressed as a proportion and RR is the relative risk estimate for the group of interest.
Total number of deaths in each age group in 2000, from Minino et al., 2002.81 For low education, poverty, and low social support, deaths for the younger age group include deaths for those aged 25–74 y to account for an average of 10 y of follow-up time in studies used to calculate the summary relative risk estimate.
Deaths attributable to social factor = (PAF/100) × total deaths in 2000. Numbers reflect the use of a nonrounded population attributable fraction in calculations.
Age group for all area-level factors was ≥ 25 y.
We obtained the total number of deaths in 2000 from all causes by age group from the National Vital Statistics Report.81 Because the average duration of follow-up for studies providing RR estimates for samples aged 25 to 64 years at baseline was 10 years, we included deaths among persons aged 25 to 74 years for this age group, which was similar to the method used by Hahn et al.30
Calculation of Population Attributable Fraction and Sensitivity Analyses
We calculated the population-attributable fraction (PAF) for each social factor using the following formula:
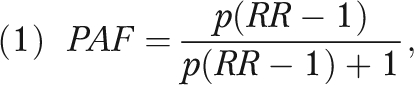 |
where RR is the summary RR estimate for mortality derived from the meta-analyses described and p is the prevalence of the social factor in the US population in 2000. The population-attributable fraction represents the proportion of all deaths that can be attributed to the social factor (i.e., the proportion of all deaths that would not have occurred in the absence of the social factor).19,82–84 The population-attributable fraction was then multiplied by the total number of deaths in the relevant age group to arrive at the number of deaths attributable to the social factor in that age group.
We conducted sensitivity analyses to assess the robustness of the summary RR estimate for each social factor using alternate cut points or multiple categories (e.g., tertiles) rather than a dichotomous contrast in exposure levels.
RESULTS
Table 3 provides the summary RR estimates and corresponding 95% CIs derived from meta-analyses of the relations between each social factor and adult all-cause mortality. RRs for mortality associated with low education and poverty were higher for individuals aged 25 to 64 years than they were for those aged 65 years or older; for example, the RR was 1.75 (95% CI = 1.51, 2.04) for poor versus nonpoor individuals aged 25 to 64 years, but the RR was 1.40 (95% CI = 1.37, 1.43) for poor versus nonpoor individuals aged 65 years or older. Adverse levels for all social factors considered were associated with increased mortality, although the RR of mortality for low education among those aged 65 years or older was not statistically significant (RR = 1.23; 95% CI = 0.86, 1.76).
Table 3 also shows the population-attributable fraction for each social factor. These fractions ranged from 1.7% for area-level poverty to 11.5% for less than a high school education among those aged 25 to 64 years. From these population-attributable fraction estimates and mortality data, we estimated that approximately 245 000 deaths in the United States in 2000 were attributable to low education, 133 000 to poverty, 162 000 to low social support, 39 000 to area-level poverty, 119 000 to income inequality, and 176 000 to racial segregation.
Our sensitivity analyses showed that the summary RR estimates varied in magnitude but not direction depending on the choice of cutpoints and categories for the exposure. Among those aged 25 to 64 years, summary RR estimates for the relation between low education and mortality ranged from 1.17 to 2.45, those for poverty ranged from 1.20 to 2.39, and those for low social support ranged from 1.08 to 1.54. For area-level poverty, summary RR estimates ranged from 1.10 to 1.15, those for income inequality ranged from 1.14 to 1.32, and those for racial segregation ranged from 1.47 to 2.54. Complete results of the sensitivity analyses are available from the authors upon request.
DISCUSSION
We found that in 2000, approximately 245 000 deaths in the United States were attributable to low education, 176 000 to racial segregation, 162 000 to low social support, 133 000 to individual-level poverty, 119 000 to income inequality, and 39 000 to area-level poverty. These mortality estimates are comparable to deaths from the leading pathophysiological causes. For example, the number of deaths we calculated as attributable to low education is comparable to the number caused by acute myocardial infarction (192 898), a subset of heart disease, which was the leading cause of death in the United States in 2000.81 The number of deaths attributable to racial segregation is comparable to the number from cerebrovascular disease (167 661), the third leading cause of death in 2000, and the number attributable to low social support is comparable to deaths from lung cancer (155 521).
Our estimates of the number of deaths attributable to social factors can be loosely compared with previous estimates, although our approach differs methodologically from prior efforts. Woolf et al. reported that an average of 196 000 deaths would have been avoided each year from 1996 to 2002 if all adults in the United States had had a college education, compared with our estimate of 245 000 deaths attributable to having less than a high school education in 2000.29 Our numbers are higher because we included deaths among those aged 65 years or older, whereas Woolf et al. included deaths only among individuals aged 25 to 64 years. Hahn et al. estimated that 6% of deaths in the United States in 1991 could be attributed to poverty, corresponding to 91 000 deaths among those aged 25 years or older,30 whereas Muennig et al. estimated that 2.3% of deaths in the United States in 2000 could be attributed to poverty, corresponding to 54 000 deaths.31 Although our estimated population-attributable fraction for mortality attributable to poverty was 4.5%, roughly between these 2 previous estimates, our estimate of the number of deaths attributable to poverty (133 000) was higher than the estimate by Hahn et al. This higher estimate is partly because of differences in age stratification and the use of deaths among all races rather than those among Whites and Blacks only,30 and partly because we estimated deaths for a later period in which there was a greater number of deaths overall. By contrast, our estimates of the population-attributable fraction for mortality associated with area-level poverty (1.7%) and with income inequality (5.1%) are not directly comparable to those reported in previous studies, which looked at excess mortality in neighborhoods with medium and low levels of socioeconomic status (encompassing a broader array of factors, including educational level and median housing value)33 and at the percentage of mortality in areas with high levels of income inequality that could be attributed to that income inequality.32
Several issues should be considered when interpreting these findings. Limited availability of data from US samples prevented us from considering some social factors and, in some cases, forced us to base our RR estimates on small numbers of studies. Previous analyses1,2 also relied on small numbers of studies in some cases to derive their attributable risk estimates; we suggest that our approach of conducting a systematic meta-analysis allowed us to capture the relations as accurately as possible. The 6 social factors considered are highly interrelated; thus, deaths attributed to each factor are not necessarily mutually exclusive. In addition, in the absence of stratum-specific estimates we could not assess possible heterogeneity in effects, and when only adjusted RR estimates were available we likely underestimated the true number of deaths because the RR estimates on which we based our calculations were derived by controlling for mediating variables rather than confounders. Our methods assume that the relations between social factors and mortality that were estimated in the 1980s and 1990s, when most of the included studies were conducted, still applied in 2000, the year used for our prevalence and mortality data. Although subgroup analyses we conducted suggested no differences in the relation between each social factor and mortality in different time periods, others have suggested that disparities in mortality by socioeconomic status have been increasing during the past few decades.85
Our meta-analytic results are only as valid and reliable as the studies upon which they are based. Although many of the RR estimates used in the meta-analyses were derived from national samples, some were conducted in specific populations or areas of the country. These samples may not reflect the target population—specifically, the adult US population—used to calculate the number of attributable deaths. The measures and definitions used to operationalize the social factors of interest were not always consistent across studies, although sensitivity analyses suggested no substantial differences in RR estimates when using alternate cutpoints. Additionally, the approach used to calculate the population attributable fraction is not strictly valid in the presence of confounding or effect modification, although it may provide reasonably accurate results in practice despite methodological limitations.83,84 We used unadjusted estimates and stratified by covariates whenever possible but were restricted to adjusted estimates for the area-level social factors considered.
The extent of the potential bias in our estimates depends on whether there is residual confounding present in the adjusted estimates and the degree of effect measure modification.86 Although the bias in the presence of confounding alone may be predictable—incomplete control of positive confounding leads to an overestimate of the RR that translates into an overestimate of the attributable numbers of deaths—it is difficult to predict the direction of bias when there is heterogeneity in the RR estimates.83 This difficulty reflects a methodological limitation inherent in using adjusted RR estimates to derive population attributable fraction estimates: residual confounding and effect heterogeneity will affect summary estimates of the RRs and lead to bias in the population-attributable fraction estimates. Ultimately, however, this concern applies to all studies that rest on meta-analytic techniques, including the ones that we build on in conducting this work. One conclusion that can be drawn from our work is that individual study results may not be useful for synthetic analyses such as ours unless these studies provide detailed data summaries and subgroup estimates in addition to the final, multiply adjusted estimates.
Finally, we limited our analysis to structural social factors that are largely features of individual experiences or group context. We did not consider stress processes that may explain the link between social factors and mortality. In many ways, stress processes may be considered a mediator of some of the factors we study, so we accounted for them. However, stress processes may also mediate the relation between other “nonsocial” factors and mortality, so we might have underestimated the contribution of social factors to mortality in the United States. This analysis suggests that, within a multifactorial framework, social causes can be linked to death as readily as can pathophysiological and behavioral causes. All of these factors contribute substantially to the burden of disease in the United States, and all need focused research efforts and public health efforts to mitigate their consequences.
Acknowledgments
This study was funded in part by the National Institutes of Health (grants DA 022720, DA 022720-S1, DA 017642, MH 082729, and MH 078152) to S. Galea.
We thank Brian Gluck and Aditi Sagdeo for their help with data collection and Jenna Johnson for research assistance.
Human Participant Protection
No protocol approval was necessary because there were no human participants directly engaged in this work.
References
- 1.McGinnis JM, Foege WH. Actual causes of death in the United States. JAMA. 1993;270(18):2207–2212 [PubMed] [Google Scholar]
- 2.Mokdad AH, Marks JS, Stroup DF, Gerberding JL. Actual causes of death in the United States, 2000. JAMA. 2004;291(10):1238–1245 [DOI] [PubMed] [Google Scholar]
- 3.Blackman PH. Actual causes of death in the United States. JAMA. 1994;271(9):659–660, author reply, 660–661 [PubMed] [Google Scholar]
- 4.Lincoln JE. Actual causes of death in the United States. JAMA. 1994;271(9):660, author reply, 660–661 [DOI] [PubMed] [Google Scholar]
- 5.White RR IV. Actual causes of death in the United States. JAMA. 1994;271(9):660, author reply, 660–661 [DOI] [PubMed] [Google Scholar]
- 6.Glantz SA. Actual causes of death in the United States. JAMA. 1994;271(9):660, author reply, 660–661 [DOI] [PubMed] [Google Scholar]
- 7.Anstadt G. Modifiable behavioral factors as causes of death. JAMA. 2004;291(24):2941, author reply, 2942–2943 [DOI] [PubMed] [Google Scholar]
- 8.Gandjour A. Modifiable behavioral factors as causes of death. JAMA. 2004;291(24):2941, author reply, 2942–2943 [DOI] [PubMed] [Google Scholar]
- 9.Barnoya J, Glantz SA. Modifiable behavioral factors as causes of death. JAMA. 2004;291(24):2941–2942, author reply, 2942–2943 [DOI] [PubMed] [Google Scholar]
- 10.Blair SN, LaMonte MJ, Nichaman MZ. Modifiable behavioral factors as causes of death. JAMA. 2004;291(24):2942, author reply, 2942–2943 [DOI] [PubMed] [Google Scholar]
- 11.Marshall E. Epidemiology. Public enemy number one: tobacco or obesity? Science. 2004;304(5672):804. [DOI] [PubMed] [Google Scholar]
- 12.Couzin J. Public health. A heavyweight battle over CDC's obesity forecasts. Science. 2005;308(5723):770–771 [DOI] [PubMed] [Google Scholar]
- 13.Understanding and Improving Health. 2nd ed. Washington, DC: US Dept of Health and Human Services; 2010 [Google Scholar]
- 14.McGinnis JM, Foege WH. The immediate vs the important. JAMA. 2004;291(10):1263–1264 [DOI] [PubMed] [Google Scholar]
- 15.Florey LS, Galea S, Wilson M. Macrosocial determinants of population health in the context of globalization. : Galea S, Macrosocial Determinants of Population Health. New York, NY: Springer; 2007:15–52 [Google Scholar]
- 16.Victora CG, Huttly SR, Fuchs SC, Olinto MT. The role of conceptual frameworks in epidemiological analysis: a hierarchical approach. Int J Epidemiol. 1997;26(1):224–227 [DOI] [PubMed] [Google Scholar]
- 17.Anderson RT, Sorlie P, Backlund E, Johnson N, Kaplan GA. Mortality effects of community socioeconomic status. Epidemiology. 1997;8(1):42–47 [DOI] [PubMed] [Google Scholar]
- 18.Backlund E, Sorlie PD, Johnson NJ. A comparison of the relationships of education and income with mortality: the National Longitudinal Mortality Study. Soc Sci Med. 1999;49(10):1373–1384 [DOI] [PubMed] [Google Scholar]
- 19.Elo IT, Preston SH. Educational differentials in mortality: United States, 1979–85. Soc Sci Med. 1996;42(1):47–57 [DOI] [PubMed] [Google Scholar]
- 20.Daly MC, Duncan GJ, McDonough P, Williams DR. Optimal indicators of socioeconomic status for health research. Am J Public Health. 2002;92(7):1151–1157 [DOI] [PMC free article] [PubMed] [Google Scholar]
- 21.Eng PM, Rimm EB, Fitzmaurice G, Kawachi I. Social ties and change in social ties in relation to subsequent total and cause-specific mortality and coronary heart disease incidence in men. Am J Epidemiol. 2002;155(8):700–709 [DOI] [PubMed] [Google Scholar]
- 22.Seeman TE. Social ties and health: the benefits of social integration. Ann Epidemiol. 1996;6(5):442–451 [DOI] [PubMed] [Google Scholar]
- 23.Polednak AP. Segregation, discrimination and mortality in US blacks. Ethn Dis. 1996;6(1–2):99–108 [PubMed] [Google Scholar]
- 24.Barnes LL, de Leon CF, Lewis TT, Bienias JL, Wilson RS, Evans DA. Perceived discrimination and mortality in a population-based study of older adults. Am J Public Health. 2008;98(7):1241–1247 [DOI] [PMC free article] [PubMed] [Google Scholar]
- 25.Kaplan GA, Pamuk ER, Lynch JW, Cohen RD, Balfour JL. Inequality in income and mortality in the United States: analysis of mortality and potential pathways. BMJ. 1996;312(7037):999–1003 [DOI] [PMC free article] [PubMed] [Google Scholar]
- 26.Waitzman NJ, Smith KR. Phantom of the area: poverty-area residence and mortality in the United States. Am J Public Health. 1998;88(6):973–976 [DOI] [PMC free article] [PubMed] [Google Scholar]
- 27.Fiscella K, Franks P. Poverty or income inequality as predictor of mortality: longitudinal cohort study. BMJ. 1997;314(7096):1724–1727 [DOI] [PMC free article] [PubMed] [Google Scholar]
- 28.Ahern J, Galea S, Hubbard A, Midanik L, Syme SL. “Culture of drinking” and individual problems with alcohol use. Am J Epidemiol. 2008;167(9):1041–1049 [DOI] [PMC free article] [PubMed] [Google Scholar]
- 29.Woolf SH, Johnson RE, Phillips RL, Jr, Philipsen M. Giving everyone the health of the educated: an examination of whether social change would save more lives than medical advances. Am J Public Health. 2007;97(4):679–683 [DOI] [PMC free article] [PubMed] [Google Scholar]
- 30.Hahn RA, Eaker E, Barker ND, Teutsch SM, Sosniak W, Krieger N. Poverty and death in the United States—1973 and 1991. Epidemiology. 1995;6(5):490–497 [PubMed] [Google Scholar]
- 31.Muennig P, Franks P, Jia H, Lubetkin E, Gold MR. The income-associated burden of disease in the United States. Soc Sci Med. 2005;61(9):2018–2026 [DOI] [PubMed] [Google Scholar]
- 32.Lynch JW, Kaplan GA, Pamuk ER, et al. Income inequality and mortality in metropolitan areas of the United States. Am J Public Health. 1998;88(7):1074–1080 [DOI] [PMC free article] [PubMed] [Google Scholar]
- 33.Winkleby MA, Cubbin C. Influence of individual and neighbourhood socioeconomic status on mortality among black, Mexican-American, and white women and men in the United States. J Epidemiol Community Health. 2003;57(6):444–452 [DOI] [PMC free article] [PubMed] [Google Scholar]
- 34.Greenland S, O'Rourke K. Meta-analysis. : Rothman KJ, Greenland S, Lash TL, Modern Epidemiology. 3rd ed Philadelphia, PA: Lippincott Williams & Wilkins; 2008:652–682 [Google Scholar]
- 35.Bassuk SS, Berkman LF, Amick BC., 3rd Socioeconomic status and mortality among the elderly: findings from four US communities. Am J Epidemiol. 2002;155(6):520–533 [DOI] [PubMed] [Google Scholar]
- 36.Batty GD, Shipley MJ, Mortensen LH, Gale CR, Deary IJ. IQ in late adolescence/early adulthood, risk factors in middle-age and later coronary heart disease mortality in men: the Vietnam Experience Study. Eur J Cardiovasc Prev Rehabil. 2008;15(3):359–361 [DOI] [PubMed] [Google Scholar]
- 37.Beebe-Dimmer J, Lynch JW, Turrell G, Lustgarten S, Raghunathan T, Kaplan GA. Childhood and adult socioeconomic conditions and 31-year mortality risk in women. Am J Epidemiol. 2004;159(5):481–490 [DOI] [PubMed] [Google Scholar]
- 38.Blazer DG. Social support and mortality in an elderly community population. Am J Epidemiol. 1982;115(5):684–694 [DOI] [PubMed] [Google Scholar]
- 39.Bucher HC, Ragland DR. Socioeconomic indicators and mortality from coronary heart disease and cancer: a 22-year follow-up of middle-aged men. Am J Public Health. 1995;85(9):1231–1236 [DOI] [PMC free article] [PubMed] [Google Scholar]
- 40.Cerhan JR, Wallace RB. Change in social ties and subsequent mortality in rural elders. Epidemiology. 1997;8(5):475–481 [DOI] [PubMed] [Google Scholar]
- 41.Cooper RS, Kennelly JF, Durazo-Arvizu R, Oh HJ, Kaplan G, Lynch J. Relationship between premature mortality and socioeconomic factors in black and white populations of US metropolitan areas. Public Health Rep. 2001;116(5):464–473 [DOI] [PMC free article] [PubMed] [Google Scholar]
- 42.Daly MC, Duncan GJ, Kaplan GA, Lynch JW. Macro-to-micro links in the relation between income inequality and mortality. Milbank Q. 1998;76(3):315–339 [DOI] [PMC free article] [PubMed] [Google Scholar]
- 43.Feinglass J, Lin S, Thompson J, et al. Baseline health, socioeconomic status, and 10-year mortality among older middle-aged Americans: findings from the Health and Retirement Study, 1992–2002. J Gerontol B Psychol Sci Soc Sci. 2007;62(4):S209–S217 [DOI] [PubMed] [Google Scholar]
- 44.Feldman JJ, Makuc DM, Kleinman JC, Cornoni-Huntley J. National trends in educational differentials in mortality. Am J Epidemiol. 1989;129(5):919–933 [DOI] [PubMed] [Google Scholar]
- 45.Fiscella K, Franks P. Does psychological distress contribute to racial and socioeconomic disparities in mortality? Soc Sci Med. 1997;45(12):1805–1809 [DOI] [PubMed] [Google Scholar]
- 46.Franks P, Clancy CM, Gold MR. Health insurance and mortality. Evidence from a national cohort. JAMA. 1993;270(6):737–741 [PubMed] [Google Scholar]
- 47.Greenfield TK, Rehm J, Rogers JD. Effects of depression and social integration on the relationship between alcohol consumption and all-cause mortality. Addiction. 2002;97(1):29–38 [DOI] [PubMed] [Google Scholar]
- 48.Haan M, Kaplan GA, Camacho T. Poverty and health: prospective evidence from the Alameda County Study. Am J Epidemiol. 1987;125(6):989–998 [DOI] [PubMed] [Google Scholar]
- 49.Kawachi I, Kennedy BP. The relationship of income inequality to mortality: does the choice of indicator matter? Soc Sci Med. 1997;45(7):1121–1127 [DOI] [PubMed] [Google Scholar]
- 50.Kennedy BP, Kawachi I, Prothrow-Stith D. Income distribution and mortality: cross sectional ecological study of the Robin Hood index in the United States. BMJ. 1996;312(7037):1004–1007 [DOI] [PMC free article] [PubMed] [Google Scholar]
- 51.Krieger N, Chen JT, Waterman PD, Rehkopf DH, Subramanian SV. Race/ethnicity, gender, and monitoring socioeconomic gradients in health: a comparison of area-based socioeconomic measures—The Public Health Disparities Geocoding Project. Am J Public Health. 2003;93(10):1655–1671 [DOI] [PMC free article] [PubMed] [Google Scholar]
- 52.Lantz PM, House JS, Lepkowski JM, Williams DR, Mero RP, Chen J. Socioeconomic factors, health behaviors, and mortality: results from a nationally representative prospective study of US adults. JAMA. 1998;279(21):1703–1708 [DOI] [PubMed] [Google Scholar]
- 53.Liu K, Cedres LB, Stamler J, et al. Relationship of education to major risk factors and death from coronary heart disease, cardiovascular diseases and all causes: findings of three Chicago epidemiologic studies. Circulation. 1982;66(6):1308–1314 [DOI] [PubMed] [Google Scholar]
- 54.Lochner K, Pamuk E, Makuc D, Kennedy BP, Kawachi I. State-level income inequality and individual mortality risk: a prospective, multilevel study. Am J Public Health. 2001;91(3):385–391 [DOI] [PMC free article] [PubMed] [Google Scholar]
- 55.Mare R. Socio-economic careers and differential mortality among older men in the United States. : Vallin J, D'Souza S, Palloni A, Measurement and Analysis of Mortality: New Approaches. Oxford, England: Clarendon Press; 1990:362–387 [Google Scholar]
- 56.McDonough P, Duncan GJ, Williams D, House J. Income dynamics and adult mortality in the United States, 1972 through 1989. Am J Public Health. 1997;87(9):1476–1483 [DOI] [PMC free article] [PubMed] [Google Scholar]
- 57.McLaughlin DK, Stokes CS. Income inequality and mortality in US counties: does minority racial concentration matter? Am J Public Health. 2002;92(1):99–104 [DOI] [PMC free article] [PubMed] [Google Scholar]
- 58.Muntaner C, Hadden WC, Kravets N. Social class, race/ethnicity and all-cause mortality in the US: longitudinal results from the 1986–1994 National Health Interview Survey. Eur J Epidemiol. 2004;19(8):777–784 [DOI] [PubMed] [Google Scholar]
- 59.Qureshi AI, Suri MF, Saad M, Hopkins LN. Educational attainment and risk of stroke and myocardial infarction. Med Sci Monit. 2003;9(11):CR466–CR473 [PubMed] [Google Scholar]
- 60.Rehkopf DH, Haughton LT, Chen JT, Waterman PD, Subramanian SV, Krieger N. Monitoring socioeconomic disparities in death: comparing individual-level education and area-based socioeconomic measures. Am J Public Health. 2006;96(12):2135–2138 [DOI] [PMC free article] [PubMed] [Google Scholar]
- 61.Reidpath DD. “Love thy neighbour”—it's good for your health: a study of racial homogeneity, mortality and social cohesion in the United States. Soc Sci Med. 2003;57(2):253–261 [DOI] [PubMed] [Google Scholar]
- 62.Robbins JM, Webb DA. Neighborhood poverty, mortality rates, and excess deaths among African Americans: Philadelphia 1999–2001. J Health Care Poor Underserved. 2004;15(4):530–537 [DOI] [PubMed] [Google Scholar]
- 63.Rogot E, Sorlie PD, Johnson NJ, Schmitt C. A Mortality Study of 1.3 Million Persons by Demographic, Social, and Economic Factors: 1979–1985 Follow-Up. Bethesda, MD: National Institutes of Health; 1992. NIH publication 92–3297 [Google Scholar]
- 64.Rutledge T, Matthews K, Lui LY, Stone KL, Cauley JA. Social networks and marital status predict mortality in older women: prospective evidence from the Study of Osteoporotic Fractures (SOF). Psychosom Med. 2003;65(4):688–694 [DOI] [PubMed] [Google Scholar]
- 65.Schoenbach VJ, Kaplan BH, Fredman L, Kleinbaum DG. Social ties and mortality in Evans County, Georgia. Am J Epidemiol. 1986;123(4):577–591 [DOI] [PubMed] [Google Scholar]
- 66.Schulz R, Beach SR, Ives DG, Martire LM, Ariyo AA, Kop WJ. Association between depression and mortality in older adults: the Cardiovascular Health Study. Arch Intern Med. 2000;160(12):1761–1768 [DOI] [PubMed] [Google Scholar]
- 67.Smith GD, Neaton JD, Wentworth D, Stamler R, Stamler J. Socioeconomic differentials in mortality risk among men screened for the Multiple Risk Factor Intervention Trial, I: white men. Am J Public Health. 1996;86(4):486–496 [DOI] [PMC free article] [PubMed] [Google Scholar]
- 68.Smith GD, Wentworth D, Neaton JD, Stamler R, Stamler J. Socioeconomic differentials in mortality risk among men screened for the Multiple Risk Factor Intervention Trial, II: black men. Am J Public Health. 1996;86(4):497–504 [DOI] [PMC free article] [PubMed] [Google Scholar]
- 69.Snowdon DA, Ostwald SK, Kane RL. Education, survival, and independence in elderly Catholic sisters, 1936–1988. Am J Epidemiol. 1989;130(5):999–1012 [DOI] [PubMed] [Google Scholar]
- 70.Steenland K, Henley J, Thun M. All-cause and cause-specific death rates by educational status for two million people in two American Cancer Society cohorts, 1959–1996. Am J Epidemiol. 2002;156(1):11–21 [DOI] [PubMed] [Google Scholar]
- 71.Thomas AJ, Eberly LE, Davey Smith G, Neaton JD. ZIP-code-based versus tract-based income measures as long-term risk-adjusted mortality predictors. Am J Epidemiol. 2006;164(6):586–590 [DOI] [PubMed] [Google Scholar]
- 72.Turra CM, Goldman N. Socioeconomic differences in mortality among US adults: insights into the Hispanic paradox. J Gerontol B Psychol Sci Soc Sci. 2007;62(3):S184–S192 [DOI] [PubMed] [Google Scholar]
- 73.Yabroff KR, Gordis L. Assessment of a national health interview survey-based method of measuring community socioeconomic status. Ann Epidemiol. 2003;13(10):721–726 [DOI] [PubMed] [Google Scholar]
- 74.Young FW, Lyson TA. Structural pluralism and all-cause mortality. Am J Public Health. 2001;91(1):136–138 [DOI] [PMC free article] [PubMed] [Google Scholar]
- 75.US Bureau of the Census US Census 2000 Summary File 3. Available at: http://www.census.gov/prod/cen2000/doc/sf3.pdf. Accessed March 11, 2011
- 76.Ford ES, Loucks EB, Berkman LF. Social integration and concentrations of C-reactive protein among US adults. Ann Epidemiol. 2006;16(2):78–84 [DOI] [PubMed] [Google Scholar]
- 77.US Bureau of the Census US Census 2000 Summary File 1. Available at: http://www.census.gov/prod/cen2000/doc/sf1.pdf. Accessed March 11, 2011
- 78.US Bureau of the Census Poverty thresholds. 2008. Available at: http://www.census.gov/hhes/www/poverty/data/threshld/index.html. Accessed March 11, 2011
- 79.Berkman LF, Syme SL. Social networks, host resistance, and mortality: a nine-year follow-up study of Alameda County residents. Am J Epidemiol. 1979;109(2):186–204 [DOI] [PubMed] [Google Scholar]
- 80.US Bureau of the Census Statistical brief: poverty areas. 1995. Available at: http://www.census.gov/population/socdemo/statbriefs/povarea.html. Accessed March 11, 2011
- 81.Minino AM, Arias E, Kochanek KD, Murphy SL, Smith BL. Deaths: final data for 2000. Natl Vital Stat Rep. 2002;50(15):1–119 [PubMed] [Google Scholar]
- 82.Koepsell TD, Weiss NS. Epidemiologic Methods: Studying the Occurrence of Illness. New York, NY: Oxford University Press; 2003 [Google Scholar]
- 83.Steenland K, Armstrong B. An overview of methods for calculating the burden of disease due to specific risk factors. Epidemiology. 2006;17(5):512–519 [DOI] [PubMed] [Google Scholar]
- 84.Rockhill B, Newman B, Weinberg C. Use and misuse of population attributable fractions. Am J Public Health. 1998;88(1):15–19 [DOI] [PMC free article] [PubMed] [Google Scholar]
- 85.Pappas G, Queen S, Hadden W, Fisher G. The increasing disparity in mortality between socioeconomic groups in the United States, 1960 and 1986. N Engl J Med. 1993;329(2):103–109 [DOI] [PubMed] [Google Scholar]
- 86.Flegal KM, Graubard BI, Williamson DF. Methods of calculating deaths attributable to obesity. Am J Epidemiol. 2004;160(4):331–338 [DOI] [PubMed] [Google Scholar]