

Abstract
Lymphoblastoid cell lines have been used as a model system to identify genetic determinants of chemotherapeutic-induced cytotoxicity, a phenotype thought to represent cellular sensitivity to drug. However, cytotoxicity is a broad measurement encompassing cell cycle inhibition as well as cell death (apoptotic and non-apoptotic). We evaluated caspase 3/7 mediated cellular apoptosis with six chemotherapeutic agents: 5′-deoxy-fluorouridine, pemetrexed, cytarabine, paclitaxel, carboplatin and cisplatin. Using monozygotic twin pair and sibling pair lymphoblastoid cell lines, we identified conditions for measurement of caspase activity. Although treatment with 5′-deoxy-fluorouridine and pemetrexed for up to 24 h did not result in significant apoptosis or inter-individual variation in caspase dependent cell death; paclitaxel, cisplatin, carboplain and cytarabine treatment for 24 h resulted in 9.4, 9.1, 7.0 and 6.0 fold increases in apoptosis relative to control, respectively. There was a weak correlation between caspase activity and cytotoxicity (r2=0.03 to 0.29) demonstrating that cytotoxicity and apoptosis are two distinct phenotypes that may produce independent genetic associations. Estimated heritability (h2) for apoptosis was 0.57 and 0.29 for cytarabine (5 μM and 40 μM respectively), 0.22 for paclitaxel (12.5 nM), and 0.34 for cisplatin (5 μM). The HapMap CEU panel of lymphoblastoid cell lines (n = 77) were evaluated for sensitivity to cisplatin followed by genome wide association studies with over 2 million SNPs at p < 0.001. We identified a significant enrichment of cisplatin-induced apoptosis SNPs within the significant cisplatin induced cytotoxicity SNPs and an enrichment of expression quantitative trait loci.
Keywords: apoptosis, caspase 3/7, lymphoblastoid cell lines, genome wide association study, toxicity
Introduction
Identifying cancer patients at risk for severe toxicity and non-responders is an important goal in pharmacogenomics. Understanding the relationship between genetics and drug sensitivity could potentially lead to better disease management by increasing the likelihood that patients respond to certain treatment and are spared from severe toxicity. To this end, human lymphoblastoid cell lines (LCLs) have been widely used as a model system to assess genetic contribution to chemotherapeutic susceptibility, reviewed in [1].
Specifically, LCLs derived from individuals within large Center d’Etude Du Plymorphisme Humain (CEPH) pedigrees have been used to demonstrate that cellular susceptibility to cisplatin [2,3], 5-fluorouracil [4], docetaxel [4], etoposide [5], daunorubicin [6], and carboplatin [7] are significantly heritable traits and amenable to genetic dissection. LCLs have also served as a useful model to understand the functional consequences of genetic variants associated with clinical outcomes in genome wide association studies (GWAS) [8,9]. Genetic variants associated with chemotherapeutic cytotoxicity identified in LCLs [10] have shown promising results in clinical outcomes prediction [11]. We developed a “triangle approach” to narrow down SNPs associated with chemotherapeutic-cytotoxicity to those that act through their effect on baseline gene expression [10,12,13] that has also been applied to response to radiation[14].
Despite the success in evaluating cytotoxicity as a pharmacologic phenotype representing cellular sensitivity to drug, this phenotype is broad encompassing the net result of cell cycle arrest, cells damaged but undergoing DNA repair, and cells undergoing death through apoptosis or non-apoptosis, necrosis or other cellular processes [15,16]. We, therefore, set out to evaluate apoptosis as a pharmacologic phenotype that may be representative of susceptibility to chemotherapy in a clinical setting. Apoptosis response in non-cancer cells such as human polymorphonuclear neutrophils, renal tubular epithelial cells and vein endothelial cells, has been used as a tool to understand the mechanisms of chemotherapeutic responses [17,18,19], in particular the mechanisms of chemotherapeutic-induced toxicity to these tissues [20,21]. Apoptosis is a specific pathway with defined genetic components [15], therefore, studying apoptosis will lead to a better understanding of the biology of drug sensitivity. Two studies identified radiation-induced apoptosis as a highly heritable trait in healthy human lymphocytes (h2=81% in all lymphocytes and h2=61% in B-lymphocytes) [22,23]. However, there is a paucity of such data on the heritable genetic impact of chemotherapeutic-induced apoptosis. In previous work, we showed that 25% of the single nucleotide polymorphisms (SNPs) that associated with cisplatin-induced cytotoxicity could explain only a fraction of the variation observed in cisplatin-induced apoptosis [3] suggesting apoptosis can serve as a distinct phenotype.
To evaluate which chemotherapeutic agents (antimetabolites including 5′-deoxy-fluorouridine or 5′-DFUR, pemetrexed, cytarabine; a mitotic inhibitor, paclitaxel; and platinum agents including carboplatin and cisplatin) induce caspase dependent apoptosis, we explored whether apoptosis induction correlated with cytotoxicity and estimated the degree of heritability using LCLs derived from healthy Caucasian monozygotic twin pair and matched sibling pairs. We performed a genotype-phenotype association analysis using cisplatin minduced apoptosis in HapMap CEU population (n =77) and compared the results with SNPs identified using cytotoxicity as the phenotype. We found 2449 SNPs (p<0.001) associated with cisplatin-induced apoptosis and 1629 SNPs (p<0.001) associated with cisplatin-induced cytotoxicity. The apoptosis-associated SNPs (p<0.001) are significantly enriched for cytotoxicity-associated SNPs (p<0.001) and expression quantitative trait loci (eQTLs) (p<0.0001).
Methods
Cell lines
Thirty-two LCLs (8 monozygotic twin pairs and 8 sibling pairs) were purchased from Coriell Institute for Medical Research (http://ccr.coriell.org/). Monozygotic twin cell lines included GM14381, GM14382, GM14405, GM14406, GM14414, GM14417, GM14432, GM14433, GM14452, GM14453, GM14478, GM14479, GM14506, GM14507, GM14520, and GM14521. Sibling cell lines were as follows: GM6988, GM6999, GM7004, GM7052, GM7044, GM7343, GM11910, GM11911, GM11985, GM11986, GM12036, GM12037, GM12092, GM12093, GM12104, and GM12105. LCLs derived from 30 CEPH trios from Utah resident with ancestry of Northern and Western Europe (HapMap CEU) were used in the association study (panel HAPMAPPT01). Thirteen cell lines of CEU population were excluded from the study due to low viability (< 85%). They included GM7034, GM10846, GM10847, GM10855, GM10863, GM11829, GM11830, GM11831, GM11839, GM12056, GM12236, GM12248, GM12707, GM12716, GM12717, GM12740, GM12751, GM12891.
Sibling LCLs were selected from CEPH pedigrees with matched age and gender to those of the twin LCLs. All Epstein-Barr virus transformed LCLs were maintained using RPMI 1640 media consisting of 15% heat-inactivated fetal bovine serum (Hyclone, Logan, UT, USA) and 20 mM L-glutamine. Cell lines were diluted to a concentration of 350,000 cells per ml 3 times a week and stored at 37°C in a 5% CO2-humidified incubator. Medium and components were purchased from Cellgro (Herndon, VA, USA).
Drugs
Cisplatin, carboplatin and cytarabine were obtained from Sigma-Aldrich Co. (St. Louis, MO, USA). Cisplatin and carboplatin were diluted to 20 mM solutions, using deionized water and DMSO, respectively. Cytarabine was diluted in PBS to produce a 160 mM solution. 5′-deoxyfluorouridine (5′-DFUR, an active form of capecitabine obtained from LKT Laboratories Inc., St. Paul, MN, USA) was made into a stock solution of 320mM in equal amounts of PBS and DMSO. Pemetrexed disodium (gift from Eli Lilly Corporation, Indianapolis, IN, USA) was prepared in PBS for a stock of 20 mM. Paclitaxel (NSC 125973) was a gift from Developmental Therapeutic Program NCI/NIH and prepared in DMSO as a stock solution of 2 mM [24].
Cytotoxicity assay
Cytotoxic effects of 5′-DFUR, pemetrexed, cytarabine, paclitaxel, carboplatin and cisplatin were assessed using an AlamarBlue cellular growth inhibition assay. LCLs in exponential growth phase were plated in triplicate at a concentration of 1×10⁵ cells per ml and were incubated overnight. Cells were treated the following day at concentrations of 0, 2.5, 10, 20, 40 μM 5′-DFUR; 0, 0.02, 0.1, 0.5, 1, 5, 10 μM pemetrexed; 0, 1, 5, 10, 40 μM cytarabine; 0, 6.25, 12.5, 25, 50, 100, 200 nM paclitaxel; 0, 5, 10, 20, 40, 80 μM carboplatin; and 0, 1, 2.5, 5, 10, 20 μM cisplatin. AlamarBlue was added 24 hours after cisplatin treatment and 48 hours after the remaining drug treatments. Cytotoxicity was measured 72 hours post treatment, except for cisplatin, which was measured 48 hours post treatment. Plates were read and percent survival was calculated using the manufacturer’s protocol (http://www.biotek.com/products/) with six replicates from two independent experiments [24].
Assay selection to quantify cellular apoptosis
Four assays, Guava Viacount, Guava Nexin (Millipore, USA), Promega Caspase 3/7 Glo, and Caspase 9 Glo (Promega, USA), were evaluated for the selection of the most optimal assay in quantifying cellular apoptosis post treatment using cisplatin. The Guava reagents, Viacount and Nexin, detect DNA integrity and membrane changes due to activation of apoptotic events, respectively. The apoptosis output are measured by flow cytometry; while the Promega caspase assays measure different caspase activities using a luminescent reporter. Caspase 9 is an indicator of cytochrome C mediated apoptosis; while caspase 3/7 are indicators of general caspase-dependent apoptosis [25]. LCLs were plated as described above and 24 hours later treated with cisplatin at concentrations of 0, 1, and 20 μM. At time points of 24 and 48 hours after drug treatment, 20 mL of cell suspension was added to 120 mL of ViaCount reagent, 100 mL of cell suspension was added to 100 mL of Nexin reagent, 80 mL of cell suspension was added to 80 mL of Caspase 3/7 or Caspase 9 Glo reagent. Guava ViaCount and Nexin assays results were quantified using the Guava EasyCyte system and caspase assays were quantified with a luminometer. These assays were performed on the same cell line in 3 independent experiments to assess the intra-assay variation. Furthermore, inter-cell line variation was also evaluated for each assay. Small intra-cell line variability relative to variation among cell lines from different individuals as well as high experimental reproducibility was used as criteria to select the optimal assay.
Apoptosis assay
Apoptotic effects of chemotherapeutic drugs were measured using Caspase-Glo 3/7 reagent from Promega (Madison, WI, USA). LCLs (viability >85%) were counted (Vi-Cell, Beckman Coulter, Fullerton, CA, USA) and plated in triplicate at a concentration of 1×10⁵ cells per ml. Following incubation overnight, cells in 96-well round bottom plates were treated with increasing concentrations of drug for 2, 4, 6 and 24 hours (and 36 hours for 5′-DFUR). At the time of apoptosis measurement, plates were allowed to reach room temperature for 30 min. Cell suspension was gently mixed 3 to 5 times using a multi-channel pipette and 80 μL cell suspension was mixed with 80 μl of Caspase-Glo 3/7 assay reagent in 96-well round bottom white opaque plates (Corning Inc., Corning, NY, USA). Opaque plates were covered, placed on a shaker for ~30 seconds to ensure the mixture of the cells and reagent and incubated at room temperature for 30 minutes – 2 hours. Luminescence at 100 nm was read using the Synergy-HT multi-detection plate reader (BioTek, Winooski, VT, USA). Caspase activity was measured using raw values of luminescence to obtain a relative to control value. Final caspase activity was calculated by averaging six replicates from two independent experiments. For the population studies, 77 LCLs (viability >85%) derived from 30 CEPH trios of HapMap CEU were plated and treated with cisplatin at a final concentration of 5 μM for 24 hours as describe above. Caspase activities induced by cisplatin at 5 μM were measured and calculated as described above.
Heritability estimates
We used the twinan90 function in the R package gap to estimate the heritability of caspase induction after chemotherapeutic drug treatment. Sibling pairs were treated as dizygotic twins in our analysis. Heritability (h2) was estimated using the following equation
where rMZ and rSIB are the intraclass correlation coefficients for the monozygotic and sibling pairs, respectively.
Genotype and phenotype association analysis
SNP genotypes were downloaded from the International HapMap database (release 22) and a total of 2,284,964 SNPs with minor allele frequencies > 0.05 and in Hardy-Weinberg equilibrium (p>0.001) were included in this analysis. Seventy-seven CEU were phenotyped as described above. SNPs were tested for association with cisplatin (5 μM) induced cell growth inhibition and caspase 3/7 activity results using the quantitative trait disequilibrium test (QTDT) total association model [26].
eQTL mapping and eQTL enrichment analysis
Genome-wide baseline gene expression data were generated in HapMap CEU LCLs using Affymetrix GeneChip Huamn Exon 1.0ST array (Exon Array) as described previously [10]. eQTL mapping and eQTL enrichment analysis were conducted as previously described [27]. Briefly, we conduced simulations to test for an enrichment of eQTLs (p<0.0001) among the apoptosis-associated SNPs (p<0.001). We generated 1,000 randomized SNP sets, each of the same size as the original list of apoptosis associated SNPs (p<0.001) and each containing variants with a matching minor allele frequency (MAF) distribution. The distribution of the number of eQTLs (p<0.0001) in these randomized SNP sets was compared to the observed number of overlap SNPs to generate a Z-score as in Gamazon et al., [27]. Z-scores > 2 were considered significant. We tested the robustness of the eQTL enrichment across a range of p-value thresholds (10−6 to 10−4).
Cytotoxicity-associated SNPs enrichment analysis
We conducted simulations to test for an enrichment of cytotoxicity-associated SNPs (p<0.001) among the apoptosis-associated SNPs (p<0.001). We generated 1,000 randomized SNP sets, each of the same size as the original list of apoptosis associated SNPs (p<0.001) and each containing variants with a matching minor allele frequency (MAF) distribution. The distribution of the number of cytotoxicity-associated SNPs (p<0.001) in these randomized SNP sets was compared to the observed number of overlap SNPs to generate a Z-score as in Gamazon et al. [27]. Z-scores > 2 were considered significant. We tested the robustness of the cytotoxicity enrichment across a range of p-value thresholds (0.001–0.01).
Enrichment Analysis of Functional Annotation Categories
DAVID bioinformatics tools (http://david.abcc.ncifcrf.gov/) were used to identify enriched functional annotation categories for target genes. AFFYMETRIX_EXO_GENE_ID identifier was used to upload target gene lists generated for 16 eQTLs associated with both cisplatin induced apoptosis and cytotoxicity at 5 μM. ENSEMBL_GENE_ID identifier was used to upload the background gene list, which contains 12,561 genes that are expressed in LCLs. Ontology (GO) terms (biological process, cell component and molecular function) were evaluated. P<0.05 and Benjamini–Hochberg– Yekutieli procedure FDR <0.1 were considered statistically significant.
Results
Optimization of apoptosis assay for lymphoblastoid cell lines (LCLs)
We evaluated Guava Viacount, Guava Nexin (Millipore, USA), Promega Caspase-Glo 3/7 and Caspase-Glo 9 (Promega, USA) as means to measure apoptosis and identified Guava Nexin and Caspase-Glo 3/7 as the optimal assays for LCLs. Between these two assays, Caspase-Glo 3/7 produced smaller intra-experimental correlation variation (CV) when compared to Guava Nexin (CV=0.18, 0.08 for Caspase 3/7; and CV=0.38 and 0.40 for Nexin after 1 and 20 μM cisplatin 24 hours treatment, respectively) for a LCL derived from an individual (Supplemental Fig. 1A, 1B). In addition, Caspase-Glo 3/7 requires less time and provided an easy distinction of results compared to Nexin assay due to the smaller intra-day variation (Supplemental Fig. 1C, 1D).
Levels of caspase induction differ among the chemotherapeutic drugs
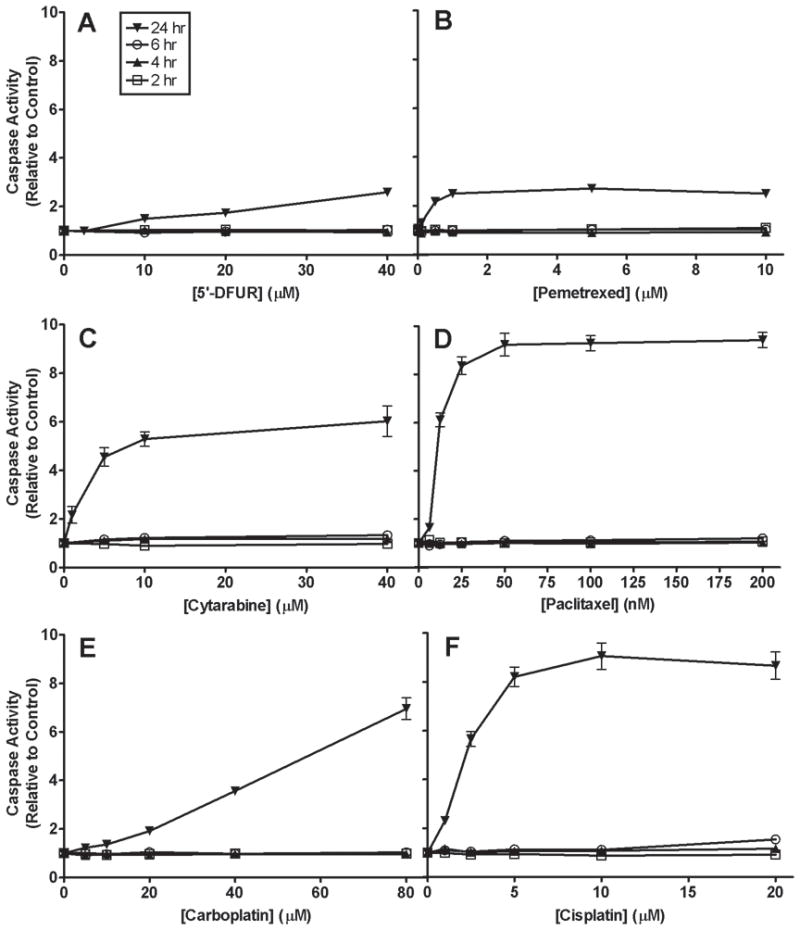
Two randomly selected LCLs (GM14507, GM14553) were exposed to increasing concentrations of six chemotherapeutic drugs (5′-DFUR, pemetrexed, cytarabine, paclitaxel, carboplatin and cisplatin) at 2, 4, 6 and 24 hours. The purpose of this experiment was three-fold: to determine optimal time to measure apoptosis; to evaluate experimental variation and to determine the degree that each chemotherapeutic drug undergoes apoptosis. The increase of caspase 3/7 activity relative to no drug treatment control for all six drugs was calculated and data generated from GM14507 is illustrated in Fig. 1. All drugs induced caspase 3/7 activity at 24 hours after drug treatment, whereas the induction at 2, 4 and 6 hours was negligible. Thus we concluded that 24 hours post-drug treatment is the optimum time point to detect apoptosis activity for these 6 drugs. This is consistent with studies in renal tubular epithelial cells demonstrating that activation of caspases including caspase 3 reaches their maximum levels at 24 hours post-cisplatin exposure [21]. Among the six drugs tested, apoptosis activities at 24 hours post treatment induced by paclitaxel (200 nM) and cisplatin (10 μM) were the greatest with mean (±SD) fold-increases of 9.4 (±0.54) and 9.1 (±0.94), respectively. Intermediate fold-increases in apoptosis of 6.0 (±1.09) and 7.0 (±0.77) were induced by cytarabine (40 μM) and carboplatin (10 μM) at 24 hours post treatment, respectively. In contrast, mean (±SD) apoptosis fold-increases induced by 5′-DFUR (40 μM) and pemetrexed (5 μM) were only 2.6 (±0.30) and 2.7 (±0.24), respectively, after 24 hours drug exposure (Fig. 1). Further evaluation of 5′-DFUR at 36 h indicated no significant increase over 24 h in degree of apoptosis (data not shown).
Figure 1.

Caspase activity for increasing concentrations of chemotherapeutic drugs at 2, 4, 6 and 24 hours for cell line GM14507. Graphs showing cell line with inter-day (n=3) variation using standard error of the mean (SEM) for (A) 5′-DFUR, (B) pemetrexed, (C) cytarabine, (D) paclitaxel, (E) carboplatin and (F) cisplatin.
Chemotherapeutic-induced cytotoxicity and apoptosis are distinct phenotypes
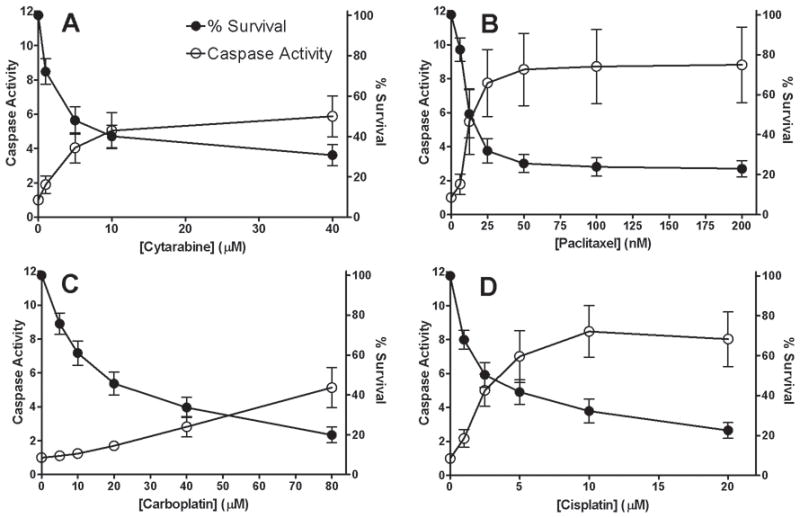
We treated 16 LCLs with increasing concentrations of 5′-DFUR, pemetrexed, cytarabine, paclitaxel, carboplatin and cisplatin and measured both cell growth inhibition using Alamar blue assay (72 hours except cisplatin, 48 hours) and apoptosis using Caspase-Glo 3/7 (24 hours). Drug-induced apoptosis levels with the highest variability among individuals relative to experimental variation are the best candidates for genetic dissection. We required that the standard deviation of the apoptosis fold-change phenotype be greater than 1 among individuals at one or more concentrations for continued analysis. This threshold was met for cytarabine (1.19), paclitaxel (1.93), cisplatin (1.53), and carboplatin (1.19), but not for 5′-DFUR (0.23) and pemetrexed (0.22). For the remaining four drugs, the average apoptosis activity (represented with caspase activity curve) and cell growth inhibition (represented with % survival curve) in response to increasing drug concentrations was plotted (Fig. 2). To determine to what extent cytotoxicity variation is explained by cells undergoing apoptosis, we compared the relationship between the two measurements. To examine the correlation (r2) between apoptosis and cytotoxicity assays, drug concentrations were log10 transformed and the resulting slopes calculated by linear regression. For all four drugs, the correlations (r2) between cell growth inhibition (cytotoxicity) and apoptosis activity ranged from 0.03 to 0.29 (Fig. 3). This low correlation implied that chemotherapeutic-induced apoptosis and cytotoxicity measured at their respective time points are distinct phenotypes.
Figure 2.
Evaluation of chemotherapeutic-induced cytotoxicity and apoptosis. Drugs evaluated after 24 hour exposure include (A) cytarabine, (B) paclitaxel, (C) carboplatin and (D) cisplatin at increasing concentrations across monozygotic twin LCLs averaging triplicates from 2 independent experiments. Inter-individual variation (n=16 individual LCLs) is represented by using standard deviation (SD).
Figure 3.

Correlation between slopes of apoptosis and percent survival curves. Slopes were calculated from survival and apoptosis curves with % survival or caspase activity against log transformed concentrations of (A) cytarabine, (B) paclitaxel, (C) carboplatin and (D) cisplatin.
Heritability of chemotherapeutic-induced apoptosis
Previously, we have shown that chemotherapeutic-induced cytotoxicity is a significantly heritable trait [2,3,5,6]. However, the heritability of apoptosis induced by chemotherapeutic agents has not been investigated. To estimate heritability, we examined apoptosis response of 16 monozygotic twin LCLs (8 pairs) and 16 sibling LCLs (8 pairs) with cisplatin (5 μM), carboplatin (40 μM, 80 μM), cytarabine (5 μM, 40 μM) and paclitaxel (12.5nM) at 24h after drug administration. We calculated the intra-class correlation coefficients of caspase activity for the monozygotic and sibling pairs (Fig. 4). Apoptosis induced by cisplatin, cytarabine and paclitaxel, showed a higher correlation within monozygotic twin pairs than within sibling pairs (Fig. 4). The estimated heritabilities (h2) were 0.57, 0.22, and 0.34 for cytarabine, paclitaxel, and cisplatin, respectively (Fig. 4). Carboplatin (40 μM and 80 μM) showed no intra-sibling correlation (Fig. 4). Due to the relative small sample size, the p values are all greater than 0.05. Previous work demonstrated heritability for cisplatin-induced cytotoxicity using large pedigree LCL samples (h2 =0.38; p<1×10⁻⁷) [3] was similar to the heritability obtained from twin LCLs for cisplatin-induced apoptosis (h2 =0.34).
Figure 4.
Intra-class correlations (r) between caspase activities of monozygotic twin pairs and sibling pairs as well as heritability (h2) estimates for drugs listed. Caspase activity relative to untreated control 24 hours after drug treatment for each individual is the average of 2 independent experiments, each with triplicate samples.
Genotype-apoptosis association and genotype-cytotoxicity association analysis
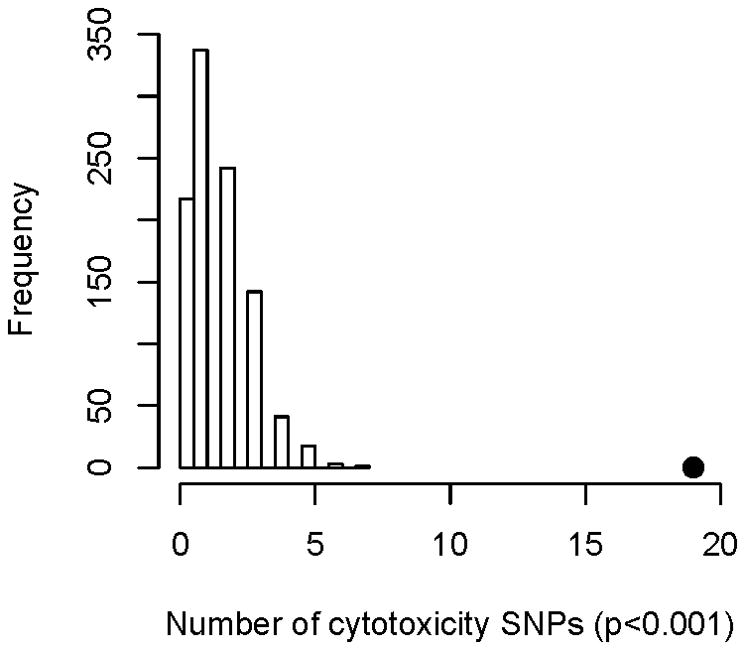
We evaluated 2,284,964 SNPs for significant association with cisplatin induced apoptosis and cytotoxicity following treatment of HapMap CEU trios with 5 μM cisplatin. Similar to results comparing apoptosis and cytotoxicity with 16 twin LCL cell lines, the correlation between apoptosis and cytotoxicity for 77 CEU LCLs had an r2 of 0.12 (Supplemental Fig. 2). We identified 2449 SNPs significantly associated with cisplatin-induced apoptosis (p <0.001) and 1629 SNPS (p <0.001) significantly associated with cisplatin induced cytotoxicity. By comparing the both sets of SNPs, we found an enrichment of cytotoxicity-associated SNPs (p<0.001) among apoptosis-associated SNPs (p<0.001) with 19 overlapping SNPs (Fig. 5 and Table 1). For example, genetic variants of rs4343077 were strongly associated with both apoptosis and cytotoxicity (Fig. 6A and 6B). This SNP is located in the intron of EPS8. In attempting to understand the function of this SNP, we evaluated its relationship with gene expression[28] (www.scandb.org,) and found that this same SNP is associated with the expression of 28 different transcripts in the CEU population (p<0.0001) (Fig. 6C).
Figure 5.

Apoptosis-associated SNPs are enriched for cytotoxicity-associated SNPs in LCLs treated with 5 μM cisplatin. Distribution of cytotoxicity-associated SNP (p-value < 10−3) counts in 1000 simulations, each matching the minor allele frequency distribution of the observed apoptosis-associated SNPs (p-value < 10-3). The black dot is the observed overlap between cytotoxicity- and apoptosis-associated SNPs.
Table 1.
19 SNPs associated with both cisplatin induced apoptosis and cytotoxicity
| SNP | P-value apoptosis | Beta for apoptosis | P-value for cytotoxicity | Beta for cytotoxicity | #target genes |
|---|---|---|---|---|---|
| rs7582207 | 7.2E-04 | −0.42 | 9.5E-04 | 0.22 | 103 |
| rs7589111 | 4.6E-04 | 0.34 | 7.9E-04 | −0.17 | 35 |
| rs7614670 | 4.2E-04 | 0.36 | 2.8E-04 | −0.19 | 1 |
| rs3901174 | 5.8E-04 | −0.37 | 4.7E-04 | 0.20 | 0 |
| rs6867736 | 2.5E-04 | −0.39 | 3.8E-04 | 0.20 | 3 |
| rs2190324 | 2.5E-04 | −0.56 | 2.8E-04 | 0.30 | 16 |
| rs1019026 | 4.4E-05 | −0.63 | 3.5E-04 | 0.30 | 16 |
| rs6950804 | 5.9E-04 | 0.49 | 8.0E-05 | −0.29 | 10 |
| rs6467410 | 4.0E-04 | −0.55 | 5.0E-04 | 0.28 | 84 |
| rs6467411 | 3.8E-04 | −0.55 | 5.1E-04 | 0.28 | 94 |
| rs10954350 | 3.8E-04 | −0.55 | 5.1E-04 | 0.28 | 94 |
| rs11767564 | 4.0E-04 | −0.55 | 5.1E-04 | 0.28 | 106 |
| rs28699613 | 4.0E-04 | −0.55 | 4.9E-04 | 0.28 | 0 |
| rs6943360 | 4.0E-04 | −0.55 | 4.9E-04 | 0.28 | 94 |
| rs7811818 | 4.0E-04 | −0.55 | 5.1E-04 | 0.28 | 94 |
| rs7949235 | 1.4E-04 | −0.40 | 9.6E-04 | 0.18 | 0 |
| rs4343077 | 7.3E-04 | −0.53 | 6.7E-04 | 0.28 | 28 |
| rs10846238 | 7.3E-04 | −0.53 | 6.2E-04 | 0.28 | 29 |
| rs17100108 | 9.2E-04 | −0.46 | 1.7E-04 | 0.26 | 0 |
Figure 6.
Relationship between rs4343077 and caspase activity, percent survival, and gene expression in CEU. (A) rs4343077 genotype and caspase activity association. (B) rs4343077 genotype and percent survival association. (C) The 28 genes associated with rs4343077 genotype (p ≤ 10−4)[28]. The distance between nodes reflects the strength of the association between the SNP genotype and gene expression levels; the closer the gene is to the SNP, the higher the correlation between the SNP genotype and gene expression.
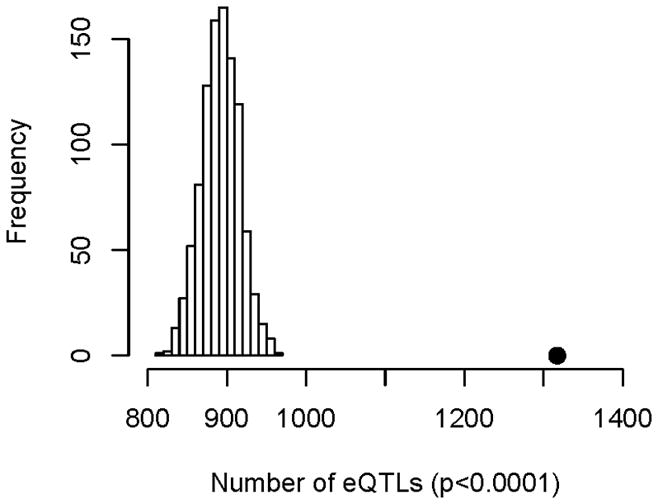
Previously, our group has demonstrated that cisplatin induced cytotoxicity (IC50) associated SNPs were enriched in expression quantitative trait loci (eQTL) [27]. Therefore, we investigated apoptosis phenotype for eQTL enrichment. Upon examination of the 2449 apoptosis associated SNPs, we found 1317 SNPs are eQTLs (Fig. 7). In addition, among the 19 apoptosis and cytotoxicity overlapping SNPs, 16 are eQTLs and 13 are “master regulators” or eQTLs associcated with expression of ≥ 10 gene expressions with a total of 291 target genes. To better understand the gene classification of the full set of target genes, we evaluated for functional annotation enrichment (Table 2). Six GO categories met the threshold of p<0.05 and FDR <0.1 including genes associated with regulation of cell proliferation, response to estrogen stimulus, immune responses, regulation of B cell activation and response to steroid hormone stimulus. Genes related to apoptosis were also enriched with (p<0.05) but with a higher FDR.
Figure 7.
Apoptosis-associated SNPs in LCLs treated with 5 μM cisplatin are enriched for eQTLs. Distribution of eQTL (p-value < 10−3) counts in 1000 simulations, each matching the minor allele frequency distribution of the observed apoptosis-associated SNPs (p-value < 10−3). The black dot is the observed eQTL count in the apoptosis-associated SNPs.
Table 2.
Enriched GO pathway analysis for the 291 targeted genes of 16 eQTLs associated with both cisplatin 5 μM induced apoptosis and cytotoxicity.
| Category | Enrichment | Count | P-Value | * FDR |
|---|---|---|---|---|
| GOTERM_BP_FAT | positive regulation of cell proliferation | 19 | 2.3E-05 | 0.02 |
| GOTERM_BP_FAT | response to estrogen stimulus | 10 | 1.7E-05 | 0.03 |
| GOTERM_BP_FAT | immune response | 24 | 1.1E-04 | 0.04 |
| GOTERM_BP_FAT | positive regulation of B cell activation | 6 | 9.2E-05 | 0.04 |
| GOTERM_BP_FAT | response to steroid hormone stimulus | 12 | 8.9E-05 | 0.05 |
| GOTERM_BP_FAT | positive regulation of immune response | 10 | 2.1E-04 | 0.06 |
| GOTERM_BP_FAT | positive regulation of apoptosis | 12 | 4.2E-02 | 0.52 |
Note:
FDR were calculated using Benjamini–Hochberg– Yekutieli procedure. BP is one of the three categories of GO, meaning biological process.
We also identified SNPs unique to cisplatin induced apoptosis or cytotoxicity. One example is the strong association between rs2285452, an apoptosis specific SNP that is also an eQTL (Fig. 8A and 8B). This polymorphism locates within the 3′-UTR of IL21R and is also correlated with 14 different gene expression levels in CEU population (p<0.0001) (data not shown). A SNP unique to cisplatin cytotoxicity but not apoptosis is rs25755 (Fig. 8C and 8D), an intronic SNP of ADAMTS12 gene and an eQTL associated with the gene expression level of GTPBP4 and IDI2.
Figure 8.

Relationship between genotypes and cisplatin-induced caspase activity and percent survival. (A) rs2285452 genotype and caspase activity association. (B) rs2285452 genotype and percent survival association. (C) rs25755 genotype and caspase activity association. (D) rs25755 genotype and percent survival association.
Discussion
In this study, we explored the possibility of using chemotherapeutic-induced apoptosis as a new phenotype in LCLs to identify genetic variants important in toxicity associated with chemotherapy that may go through an apoptotic pathway. We chose six chemotherapeutic agents from three different drug classes that included: platinum agents: cisplatin and carboplatin; antimetabolites: cytarabine, 5′-DFUR, pemetrexed; and a mitotic inhibitor: paclitaxel. 5′-DFUR and pemetrexed induced low caspase 3/7 activity even at high concentrations and in the case of 5′-DFUR, caspase activity was still low at prolonged exposure (36 hours). These two drugs also showed low variability in apoptosis induction among individuals; in contrast cisplatin, carboplatin, cytarabine and paclitaxel, triggered significant caspase activity in LCLs and showed high variability among individuals. Our data indicates apoptosis is not well correlated to cytotoxicity, therefore cytotoxicity is likely to represent a broad set of pharmacologic phenotypes including apoptosis. Using monozygotic twins and age- and gender-matched siblings as a preliminary estimation, the h2 for cytarabine, paclitaxel, cisplatin was 0.57, 0.22 and 0.34, respectively. We then performed a genome wide association study using cisplatin (5μM) induced caspase 3/7 activity as the phenotype in HapMap CEU population and compared the results with the SNPs using cytotoxicity as the phenotype. We discovered 2449 SNPs associated with apoptosis (p<0.001) and there was an enrichment of apoptosis associated SNPs in cytotoxicity associated SNPs. Our association study results further support that apoptosis in LCLs can be used as an alternative pharmacologic phenotype for discovering biomarkers to predict chemotherapeutic susceptibility and possibly cancer patients’ response.
Although 5′-DFUR and pemetrexed can cause substantial cell growth inhibition in LCLs as shown by cytotoxicity measures, we only observed a small degree of caspase 3/7 activity induced by these drugs. In agreement with our findings in human umbilical vein endothelial cells, pemetrexed treatment alone induces low caspase-3 activity [19]. Similarly, in multiple myeloma cells, pemetrexed induces caspase independent apoptosis and cell cycle arrests at S phase [29]. 5′-FU, the bioactive form of 5′-DFUR, can also induce G1/S phase arrest in mouse embryonic stem cells [30]. This suggests that in LCLs, 5′-DFUR and pemetrexed are likely to induce cytotoxicity mainly through non-caspase dependent pathways possibly through caspase independent apoptosis, cell cycle arrest and/or other pathways.
Among the six drugs tested in this study, cisplatin and carboplatin are both platinating agents. Interestingly, they are quite different in their abilities to induce apoptosis at concentrations. For example, at a concentration that inhibits 50% cell growth, there was a 2-fold relative increase in apoptosis for carboplatin compared to a 5-fold increase for cisplatin. This is consistent with published studies in both retinoblastoma cells and in cochlea of guinea pigs that cisplatin triggers a higher degree of apoptosis than carboplatin [31,32]. In addition, the degree of apoptosis as concentration increases is greater for cisplatin as measured by the linearized cisplatin-induced caspase 3/7 activity curve (slope=4.8) compared to the linearized carboplatin curve (slope= 3.2). This difference between cisplatin and carboplatin could be explained by the presence of the bidentate dicarboxylate ligand in carboplatin structure that slows down carboplatin DNA binding kinetics [33]. Although carboplatin-induced apoptosis did not show intra-sibling correlation suggesting that unlike cisplatin, carboplatin-induced apoptosis may not be significantly heritable, large pedigree studies would need to be performed for verification as our studies were underpowered.
Using genotype-phenotype association study, we identified genetic variants of 2449 SNPs associated with cisplatin-induced apoptosis and 1629 associated with cisplatin-induced cytotoxicity. Similar to eQTL enrichment of cytotoxicity associated SNPs [27], apoptosis associated SNPs were also enriched in eQTLs suggesting that gene expression and genetic variants regulating gene expression are important for cisplatin induced apoptosis. In addition, there was an enrichment of apoptosis associated SNPs (19 SNPs) in cytotoxicity associated SNPs and 16 out of these 19 SNPs are eQTLs associated with expressions of a total of 291 genes. Among these 16 eQTLs, 13 are “master regulators”, defined as eQTLs associcated with expression of ≥ 10 gene expressions. 7 out of the 13 eQTLs are “super master regulators” or eQTLs associated with the expressions of 50 genes or more (Table 1). The results imply that master regulators may be most important in determining whether a cell survives damage or induces apoptosis.
One example of the 16 overlapping eQTL is rs4343077, an intronic SNP of gene EPS8 EPS8 (epidermal growth factor receptor pathway substrate 8) is an oncoprotein contributing to malignant transformation in tumor cells [34]. A candidate gene study has tied EPS8 to cisplatin induced drug response: reducing EPS8 levels in cervical cancer cells increases chemosensitivity to cisplatin and paclitaxel (Chen, 2008). More importantly, EPS8 expression level shows an inverse correlation with cervical cancer patients’ survival rate (Chen, 2008). Moreover, rs4343077 is also correlated with the expression levels of 28 genes including CCND1 and STAT3. CCND1 is a candidate oncogene that is both amplified and overexpressed in multiple tumors along with oncogene CTTN [35]. Transcription factor STAT3, on the other hand, suppresses apoptosis in solid and hematological tumors[36].
Genetic variants of rs2285452 are an example of the SNPs unique to apoptosis. rs22885452 is located in the 3′-UTR of IR21R. The IL21R encodes a receptor for interleukin 21(IL-21) and IL-21 regulates B lymphocyte homeostasis by inducing apoptosis via IL-21 receptor [37]. The discovery of rs2285452, a SNP of a known apoptotic gene, supports our conclusion that caspase 3/7 activity could serve as a reliable tool to find genetic variants regulating apoptosis.
rs3434077 and rs2285452 are two great examples showing that including apoptosis as a complementary phenotype empowered us to discover more valuable genetic variants that would not be prominent otherwise. Further validation and functional studies could be followed to investigate whether rs3434077 and rs2285452 are two potential biomarkers to predict patients’ response to cisplatin.
We also discovered some SNPs unique to cisplatin induced cytotoxicity. Those SNPs are likely to be involved in cell response to anti-cancer drugs through a non-apoptotic pathway. One example is rs25755 (Fig. 8), an intronic SNP of ADAMTS12 gene. A couple recent studies have shown that metalloproteinase ADAMTS-12 acts as an anti-cancer protease through reducing tumor cell proliferation [38,39]. It is possible that ADAMTS-12 influences cell response to anti-cancer drug via regulating cell proliferation rates.
We included six anti-cancer agents representing at least 3 different mechanisms of action; they all act through different mechanism to inhibit tumor proliferation. Antimetabolites (pemetrexed, 5′-DFUR, cytarabine) primarily block cell growth by inhibiting DNA synthesis[40]. Platinum agents (cisplatin and carboplatin) cause cell death through inter-and intra-strand DNA cross-linking [41]. Paclitaxel targets the proliferative process by stabilizing microtubules during cell division[42]. Our data indicates that pemetrexed and DFUR do not induce caspase 3/7 apoptosis and therefore, one might conclude that drugs that inhibit DNA synthesis may be less potent; however the exception is that cytarabine, an antimetabolite, does cause caspase 3/7 apoptosis. Paclitaxel and platinum agents induced a much higher level of activated caspase (9.4 fold for paclitaxel, 9.1 fold for cisplatin and 7 fold for carboplatin) compared to pemetrexed and 5′-DFUR (<3 fold). Cytarabine also induced higher caspase activity (6 fold) with higher inter-individual variability (SD=1.19) than pemetrexed and 5′-DFUR (<3 fold and SD<0.3). This difference may due to the fact that cytarabine incorporates into DNA then inhibits the function of DNA polymerase and topoisomerase [43,44] while pemetrexed and 5′-DFUR mainly inhibits DNA synthesis by blocking the synthesis of DNA precursors thymidine monophosphate (TMP)[40]. We do recognize that our observation with six drugs from three different drug classes may not be sufficient to conclude a definitive set of rules, but our data suggest that agents that inhibit microtubules or result in DNA damage may be reasonable candidates for caspase 3/7 assays.
Our observation with six drugs from three different drug classes may not be sufficient to conclude a definite general rules, but our results have shed some light on which anti-cancer drugs may suit caspase Glo 3/7 assays. More importantly, by demonstrating a systematic method, our study should direct the future effects to screen candidates for using caspase Glo 3/7 assay as a pharmacogenomic phenotype.
Caspase-independent apoptosis is mediated by granzymes and its substrates, including AIF and endonuclease G [45,46,47]. Several studies have appealed on the role of caspase independent apoptosis in the responses to anti-cancer therapies. Pemetrexed has shown the ability to induce apoptosis independent of caspases in the cells derived from multiple myeloma patients [29]. In non-small cell lung cancer cell lines, paclitaxel can induce apoptosis in a Cathepsin B dependent but caspases independent manner [48]. Up to date, it is still under debate whether non-apoptotic apoptosis play substantial roles in response to chemotherapies and further investigations will be needed to address this question.
Here we provided evidence that caspase 3/7 apoptosis assay is a useful and applicable assay in LCLs for future discovery of genetic factors contributing to anti-cancer agent-induced cell death. Apoptosis induced by chemotherapeutic agents is a distinct phenotype from cytotoxicity and can serve as a complementary representative of cell death. Although apoptosis pathway is compromised in many cancers [49], it has been regarded as the major pathway through which chemotherapeutic drugs trigger cancer cell death [16]. Furthermore, apoptosis activity evaluated in primary tumor cells has been shown to predict cancer patient response to chemotherapy and radiation [50,51,52]. Thus, the genetic variants discovered in LCLs may be predictive of tumor response in cancer patients. Once apoptosis profiles are generated, systems biology tools can be applied to gain a better understanding of how genetic components affect pharmacologic phenotypes associated with chemotherapy.
Supplementary Material
Supplemental Figure 1. Experimental variation for apoptosis measurements using Guava Nexin and Caspase-Glo 3/7. Intra-cell line experimental variation are shown in A and B. Each bar represents 3 different experiments using the same cell line (GM07019) treated with 1 and 20 μM cisplatin for 48 hours for each Guava Nexin assay (A) and Promega Caspase 3/7 assay (B). Cell line GM07048 (triangle) and cell line GM07019 (square) were treated with increasing concentrations of cisplatin for 48 hours using Guava Nexin Assay (C) and Promega Caspase 3/7 glo (D). Error bars represent SEM of triplicate measures for each experiment.
Supplemental Figure 2. Correlation between measurements of caspase activity and percent survival for 77 CEU cell lines treated with 5 μM cisplatin.
Acknowledgments
Grant support: This study is supported by NIH/NIGMS Pharmacogenomics of Anticancer Agents grant U01GM61393, by the University of Chicago Breast Cancer SPORE grant NCI P50 CA125183, NIH/NCI RO1 CA136765 and a Specialized Center of Research Grant from the Leukemia and Lymphoma Society.
The authors thank Dr. Nancy J Cox for valuable discussion and Bonnie LaCroix and Kenneth Hecht for cell culture assistance.
Footnotes
Disclosure of Potential Conflicts of Interest
No potential conflicts of interest were disclosed.
References
- 1.Welsh M, Mangravite L, Medina MW, Tantisira K, Zhang W, Huang RS, et al. Pharmacogenomic discovery using cell-based models. Pharmacol Rev. 2009;61:413–429. doi: 10.1124/pr.109.001461. [DOI] [PMC free article] [PubMed] [Google Scholar]
- 2.Dolan ME, Newbold KG, Nagasubramanian R, Wu X, Ratain MJ, Cook EH, Jr, et al. Heritability and linkage analysis of sensitivity to cisplatin-induced cytotoxicity. Cancer Res. 2004;64:4353–4356. doi: 10.1158/0008-5472.CAN-04-0340. [DOI] [PubMed] [Google Scholar]
- 3.Shukla SJ, Duan S, Badner JA, Wu X, Dolan ME. Susceptibility loci involved in cisplatin-induced cytotoxicity and apoptosis. Pharmacogenet Genomics. 2008;18:253–262. doi: 10.1097/FPC.0b013e3282f5e605. [DOI] [PMC free article] [PubMed] [Google Scholar]
- 4.Watters JW, Kraja A, Meucci MA, Province MA, McLeod HL. Genome-wide discovery of loci influencing chemotherapy cytotoxicity. Proc Natl Acad Sci U S A. 2004;101:11809–11814. doi: 10.1073/pnas.0404580101. [DOI] [PMC free article] [PubMed] [Google Scholar]
- 5.Bleibel WK, Duan S, Huang RS, Kistner EO, Shukla SJ, Wu X, et al. Identification of genomic regions contributing to etoposide-induced cytotoxicity. Hum Genet. 2009;125:173–180. doi: 10.1007/s00439-008-0607-4. [DOI] [PMC free article] [PubMed] [Google Scholar]
- 6.Duan S, Bleibel WK, Huang RS, Shukla SJ, Wu X, Badner JA, et al. Mapping genes that contribute to daunorubicin-induced cytotoxicity. Cancer Res. 2007;67:5425–5433. doi: 10.1158/0008-5472.CAN-06-4431. [DOI] [PMC free article] [PubMed] [Google Scholar]
- 7.Shukla SJ, Duan S, Wu X, Badner JA, Kasza K, Dolan ME. Whole-genome approach implicates CD44 in cellular resistance to carboplatin. Hum Genomics. 2009;3:128–142. doi: 10.1186/1479-7364-3-2-128. [DOI] [PMC free article] [PubMed] [Google Scholar]
- 8.Ingle JN, Schaid DJ, Goss PE, Liu M, Mushiroda T, Chapman JA, et al. Genome-wide associations and functional genomic studies of musculoskeletal adverse events in women receiving aromatase inhibitors. J Clin Oncol. 2010;28:4674–4682. doi: 10.1200/JCO.2010.28.5064. [DOI] [PMC free article] [PubMed] [Google Scholar]
- 9.Chen SH, Yang W, Fan Y, Stocco G, Crews KR, Yang JJ, et al. A genome-wide approach identifies that the aspartate metabolism pathway contributes to asparaginase sensitivity. Leukemia. 2010 doi: 10.1038/leu.2010.256. [DOI] [PMC free article] [PubMed] [Google Scholar]
- 10.Huang RS, Duan S, Shukla SJ, Kistner EO, Clark TA, Chen TX, et al. Identification of genetic variants contributing to cisplatin-induced cytotoxicity by use of a genomewide approach. Am J Hum Genet. 2007;81:427–437. doi: 10.1086/519850. [DOI] [PMC free article] [PubMed] [Google Scholar]
- 11.Huang RS, Johnatty SE, Gamazon E, Im HK, Ziliak DM, Zhang W, et al. Germline Polymorphism Discovered via a Cell-based Genome-wide Approach Predicts Platinum Response in Ovarian and Head and Neck Cancers. 2010 doi: 10.1016/j.trsl.2011.01.005. [DOI] [PMC free article] [PubMed] [Google Scholar]
- 12.Huang RS, Duan S, Bleibel WK, Kistner EO, Zhang W, Clark TA, et al. A genome-wide approach to identify genetic variants that contribute to etoposide-induced cytotoxicity. Proc Natl Acad Sci U S A. 2007;104:9758–9763. doi: 10.1073/pnas.0703736104. [DOI] [PMC free article] [PubMed] [Google Scholar]
- 13.Hartford CM, Duan S, Delaney SM, Mi S, Kistner EO, Lamba JK, et al. Population-specific genetic variants important in susceptibility to cytarabine arabinoside cytotoxicity. Blood. 2009;113:2145–2153. doi: 10.1182/blood-2008-05-154302. [DOI] [PMC free article] [PubMed] [Google Scholar]
- 14.Niu N, Qin Y, Fridley BL, Hou J, Kalari KR, Zhu M, et al. Radiation pharmacogenomics: a genome-wide association approach to identify radiation response biomarkers using human lymphoblastoid cell lines. Genome Res. 2010;20:1482–1492. doi: 10.1101/gr.107672.110. [DOI] [PMC free article] [PubMed] [Google Scholar]
- 15.Ricci MS, Zong WX. Chemotherapeutic approaches for targeting cell death pathways. Oncologist. 2006;11:342–357. doi: 10.1634/theoncologist.11-4-342. [DOI] [PMC free article] [PubMed] [Google Scholar]
- 16.Brown JM, Attardi LD. The role of apoptosis in cancer development and treatment response. Nat Rev Cancer. 2005;5:231–237. doi: 10.1038/nrc1560. [DOI] [PubMed] [Google Scholar]
- 17.Iacobini M, Menichelli A, Palumbo G, Multari G, Werner B, Del Principe D. Involvement of oxygen radicals in cytarabine-induced apoptosis in human polymorphonuclear cells. Biochem Pharmacol. 2001;61:1033–1040. doi: 10.1016/s0006-2952(01)00548-2. [DOI] [PubMed] [Google Scholar]
- 18.Mielgo A, Torres VA, Clair K, Barbero S, Stupack DG. Paclitaxel promotes a caspase 8-mediated apoptosis through death effector domain association with microtubules. Oncogene. 2009;28:3551–3562. doi: 10.1038/onc.2009.210. [DOI] [PMC free article] [PubMed] [Google Scholar]
- 19.Bischof M, Abdollahi A, Gong P, Stoffregen C, Lipson KE, Debus JU, et al. Triple combination of irradiation, chemotherapy (pemetrexed), and VEGFR inhibition (SU5416) in human endothelial and tumor cells. Int J Radiat Oncol Biol Phys. 2004;60:1220–1232. doi: 10.1016/j.ijrobp.2004.07.689. [DOI] [PubMed] [Google Scholar]
- 20.Hsieh CH, Liu CY, Shueng PW, Chong NS, Chen CJ, Chen MJ, et al. Comparison of coplanar and noncoplanar intensity-modulated radiation therapy and helical tomotherapy for hepatocellular carcinoma. Radiat Oncol. 2010;5:40. doi: 10.1186/1748-717X-5-40. [DOI] [PMC free article] [PubMed] [Google Scholar]
- 21.Kaushal GP, Kaushal V, Hong X, Shah SV. Role and regulation of activation of caspases in cisplatin-induced injury to renal tubular epithelial cells. Kidney Int. 2001;60:1726–1736. doi: 10.1046/j.1523-1755.2001.00026.x. [DOI] [PubMed] [Google Scholar]
- 22.Schmitz A, Bayer J, Dechamps N, Goldin L, Thomas G. Heritability of susceptibility to ionizing radiation-induced apoptosis of human lymphocyte subpopulations. Int J Radiat Oncol Biol Phys. 2007;68:1169–1177. doi: 10.1016/j.ijrobp.2007.03.050. [DOI] [PMC free article] [PubMed] [Google Scholar]
- 23.Camplejohn RS, Hodgson S, Carter N, Kato BS, Spector TD. Heritability of DNA-damage-induced apoptosis and its relationship with age in lymphocytes from female twins. Br J Cancer. 2006;95:520–524. doi: 10.1038/sj.bjc.6603257. [DOI] [PMC free article] [PubMed] [Google Scholar]
- 24.Stark AL, Zhang W, Mi S, Duan S, O’Donnell PH, Huang RS, et al. Heritable and non-genetic factors as variables of pharmacologic phenotypes in lymphoblastoid cell lines. Pharmacogenomics J. doi: 10.1038/tpj.2010.3. [DOI] [PMC free article] [PubMed] [Google Scholar]
- 25.Thornberry NA, Lazebnik Y. Caspases: enemies within. Science. 1998;281:1312–1316. doi: 10.1126/science.281.5381.1312. [DOI] [PubMed] [Google Scholar]
- 26.Abecasis GR, Cardon LR, Cookson WO. A general test of association for quantitative traits in nuclear families. Am J Hum Genet. 2000;66:279–292. doi: 10.1086/302698. [DOI] [PMC free article] [PubMed] [Google Scholar]
- 27.Gamazon ER, Huang RS, Cox NJ, Dolan ME. Chemotherapeutic drug susceptibility associated SNPs are enriched in expression quantitative trait loci. Proc Natl Acad Sci U S A. 2010;107:9287–9292. doi: 10.1073/pnas.1001827107. [DOI] [PMC free article] [PubMed] [Google Scholar]
- 28.Gamazon ER, Zhang W, Konkashbaev A, Duan S, Kistner EO, Nicolae DL, et al. SCAN: SNP and copy number annotation. Bioinformatics. 2010;26:259–262. doi: 10.1093/bioinformatics/btp644. [DOI] [PMC free article] [PubMed] [Google Scholar]
- 29.Ramirez JM, Ocio EM, San Miguel JF, Pandiella A. Pemetrexed acts as an antimyeloma agent by provoking cell cycle blockade and apoptosis. Leukemia. 2007;21:797–804. doi: 10.1038/sj.leu.2404599. [DOI] [PubMed] [Google Scholar]
- 30.Kim GD, Rhee GS, Chung HM, Chee KM, Kim GJ. Cytotoxicity of 5-fluorouracil: Effect on endothelial differentiation via cell cycle inhibition in mouse embryonic stem cells. Toxicol In Vitro. 2009;23:719–727. doi: 10.1016/j.tiv.2009.02.012. [DOI] [PubMed] [Google Scholar]
- 31.Di Felice V, Lauricella M, Giuliano M, Emanuele S, Vento R, Tesoriere G. The apoptotic effects of cisplatin and carboplatin in retinoblastoma Y79 cells. Int J Oncol. 1998;13:225–232. doi: 10.3892/ijo.13.2.225. [DOI] [PubMed] [Google Scholar]
- 32.Watanabe KC, Jinnouchi K, Hess A, Michel O, Baba S, Yagi T. Carboplatin induces less apoptosis in the cochlea of guinea pigs than cisplatin. Chemotherapy. 2002;48:82–87. doi: 10.1159/000057667. [DOI] [PubMed] [Google Scholar]
- 33.Knox RJ, Friedlos F, Lydall DA, Roberts JJ. Mechanism of cytotoxicity of anticancer platinum drugs: evidence that cis-diamminedichloroplatinum(II) and cis-diammine-(1,1-cyclobutanedicarboxylato)platinum(II) differ only in the kinetics of their interaction with DNA. Cancer Res. 1986;46:1972–1979. [PubMed] [Google Scholar]
- 34.Matoskova B, Wong WT, Salcini AE, Pelicci PG, Di Fiore PP. Constitutive phosphorylation of eps8 in tumor cell lines: relevance to malignant transformation. Mol Cell Biol. 1995;15:3805–3812. doi: 10.1128/mcb.15.7.3805. [DOI] [PMC free article] [PubMed] [Google Scholar]
- 35.Schuuring E. The involvement of the chromosome 11q13 region in human malignancies: cyclin D1 and EMS1 are two new candidate oncogenes--a review. Gene. 1995;159:83–96. doi: 10.1016/0378-1119(94)00562-7. [DOI] [PubMed] [Google Scholar]
- 36.Al Zaid Siddiquee K, Turkson J. STAT3 as a target for inducing apoptosis in solid and hematological tumors. Cell Res. 2008;18:254–267. doi: 10.1038/cr.2008.18. [DOI] [PMC free article] [PubMed] [Google Scholar]
- 37.Mehta DS, Wurster AL, Whitters MJ, Young DA, Collins M, Grusby MJ. IL-21 induces the apoptosis of resting and activated primary B cells. J Immunol. 2003;170:4111–4118. doi: 10.4049/jimmunol.170.8.4111. [DOI] [PubMed] [Google Scholar]
- 38.El Hour M, Moncada-Pazos A, Blacher S, Masset A, Cal S, Berndt S, et al. Higher sensitivity of Adamts12-deficient mice to tumor growth and angiogenesis. Oncogene. 2010;29:3025–3032. doi: 10.1038/onc.2010.49. [DOI] [PubMed] [Google Scholar]
- 39.Moncada-Pazos A, Obaya AJ, Fraga MF, Viloria CG, Capella G, Gausachs M, et al. The ADAMTS12 metalloprotease gene is epigenetically silenced in tumor cells and transcriptionally activated in the stroma during progression of colon cancer. J Cell Sci. 2009;122:2906–2913. doi: 10.1242/jcs.050468. [DOI] [PubMed] [Google Scholar]
- 40.Kinsella AR, Smith D. Tumor resistance to antimetabolites. Gen Pharmacol. 1998;30:623–626. doi: 10.1016/s0306-3623(97)00383-2. [DOI] [PubMed] [Google Scholar]
- 41.Rabik CA, Dolan ME. Molecular mechanisms of resistance and toxicity associated with platinating agents. Cancer Treat Rev. 2007;33:9–23. doi: 10.1016/j.ctrv.2006.09.006. [DOI] [PMC free article] [PubMed] [Google Scholar]
- 42.Jordan MA, Wilson L. Microtubules as a target for anticancer drugs. Nat Rev Cancer. 2004;4:253–265. doi: 10.1038/nrc1317. [DOI] [PubMed] [Google Scholar]
- 43.Prakasha Gowda AS, Polizzi JM, Eckert KA, Spratt TE. Incorporation of gemcitabine and cytarabine into DNA by DNA polymerase beta and ligase III/XRCC1. Biochemistry. 2010;49:4833–4840. doi: 10.1021/bi100200c. [DOI] [PubMed] [Google Scholar]
- 44.Richardson KA, Vega TP, Richardson FC, Moore CL, Rohloff JC, Tomkinson B, et al. Polymerization of the triphosphates of AraC, 2′,2′-difluorodeoxycytidine (dFdC) and OSI-7836 (T-araC) by human DNA polymerase alpha and DNA primase. Biochem Pharmacol. 2004;68:2337–2346. doi: 10.1016/j.bcp.2004.07.042. [DOI] [PubMed] [Google Scholar]
- 45.Xu JH, Huang HZ, Pan CB, Zhang B, Zhang LT. Role of survivin gene on the apoptosis of Tca8113 cells induced by cisplatin. Hua Xi Kou Qiang Yi Xue Za Zhi. 2007;25:173–176. [PubMed] [Google Scholar]
- 46.Cande C, Cohen I, Daugas E, Ravagnan L, Larochette N, Zamzami N, et al. Apoptosis-inducing factor (AIF): a novel caspase-independent death effector released from mitochondria. Biochimie. 2002;84:215–222. doi: 10.1016/s0300-9084(02)01374-3. [DOI] [PubMed] [Google Scholar]
- 47.Zhao T, Zhang H, Guo Y, Zhang Q, Hua G, Lu H, et al. Granzyme K cleaves the nucleosome assembly protein SET to induce single-stranded DNA nicks of target cells. Cell Death Differ. 2007;14:489–499. doi: 10.1038/sj.cdd.4402040. [DOI] [PubMed] [Google Scholar]
- 48.Broker LE, Huisman C, Span SW, Rodriguez JA, Kruyt FA, Giaccone G. Cathepsin B mediates caspase-independent cell death induced by microtubule stabilizing agents in non-small cell lung cancer cells. Cancer Res. 2004;64:27–30. doi: 10.1158/0008-5472.can-03-3060. [DOI] [PubMed] [Google Scholar]
- 49.Fulda S. Tumor resistance to apoptosis. Int J Cancer. 2009;124:511–515. doi: 10.1002/ijc.24064. [DOI] [PubMed] [Google Scholar]
- 50.Flick MB, O’Malley D, Rutherford T, Rodov S, Kamsteeg M, Hao XY, et al. Apoptosis-based evaluation of chemosensitivity in ovarian cancer patients. J Soc Gynecol Investig. 2004;11:252–259. doi: 10.1016/j.jsgi.2003.11.003. [DOI] [PubMed] [Google Scholar]
- 51.Ballard KS, Homesley HD, Hodson C, Presant CA, Rutledge J, Hallquist A, et al. Endometrial carcinoma in vitro chemosensitivity testing of single and combination chemotherapy regimens using the novel microculture kinetic apoptosis assay: implications for endometrial cancer treatment. J Gynecol Oncol. 2010;21:45–49. doi: 10.3802/jgo.2010.21.1.45. [DOI] [PMC free article] [PubMed] [Google Scholar]
- 52.Adourian A, Jennings E, Balasubramanian R, Hines WM, Damian D, Plasterer TN, et al. Correlation network analysis for data integration and biomarker selection. Mol Biosyst. 2008;4:249–259. doi: 10.1039/b708489g. [DOI] [PubMed] [Google Scholar]
Associated Data
This section collects any data citations, data availability statements, or supplementary materials included in this article.
Supplementary Materials
Supplemental Figure 1. Experimental variation for apoptosis measurements using Guava Nexin and Caspase-Glo 3/7. Intra-cell line experimental variation are shown in A and B. Each bar represents 3 different experiments using the same cell line (GM07019) treated with 1 and 20 μM cisplatin for 48 hours for each Guava Nexin assay (A) and Promega Caspase 3/7 assay (B). Cell line GM07048 (triangle) and cell line GM07019 (square) were treated with increasing concentrations of cisplatin for 48 hours using Guava Nexin Assay (C) and Promega Caspase 3/7 glo (D). Error bars represent SEM of triplicate measures for each experiment.
Supplemental Figure 2. Correlation between measurements of caspase activity and percent survival for 77 CEU cell lines treated with 5 μM cisplatin.