

Abstract
Background
Plasma exchange (PLEX) is a beneficial rescue therapy for acute, steroid-refractory central nervous system inflammatory demyelinating disease (CNS-IDD). Despite the ~45% PLEX response rate reported among CNS-IDD patients, determinants of interindividual differences in PLEX response are not well characterized.
Objective
To perform an exploratory analysis of clinical, radiographic, and serological features associated with beneficial PLEX response.
Design
Historical cohort study
Setting
Neurology practice, Mayo Clinic College of Medicine, Rochester, Minnesota.
Patients
All Mayo Clinic patients treated with PLEX between1990–2007 for a steroid-refractory CNS-IDD attack.
Main Outcome Measure
The primary outcome was PLEX response in attack-related, targeted neurological deficit(s) (TND) assessed within the 6 month period following PLEX.
Results
We identified 153 patients treated with PLEX for a steroid-refractory CNS-IDD, of whom 90 (59%) exhibited moderate to marked functional neurological improvement within 6 months following treatment. Pre-PLEX clinical features associated with a beneficial PLEX response were shorter disease duration (p=0.02) and preserved deep tendon reflexes (p=0.001); post-PLEX variables included a diagnosis of relapsing-remitting MS (RRMS) (p=0.008) and a lower EDSS (p<0.001) at last follow-up. PLEX was less effective for MS patients who subsequently developed a progressive disease course (p=0.046). Radiographic features associated with a beneficial PLEX response were presence of ring-enhancing lesions (RELs; OR=4.0, p=0.029) and/or mass effect (OR=3.0, p=0.024). No association was found between NMO-IgG serostatus and PLEX response.
Conclusions
We have identified clinical and radiographic features which may aid in identifying those patients with fulminant, steroid-refractory CNS-IDD attacks who are more likely to respond to PLEX.
Introduction
Central nervous system inflammatory demyelinating diseases (CNS-IDDs), of which multiple sclerosis (MS) is the prototype, represent a spectrum of disorders that differ in their clinical, radiographic and serological findings. Although most acute attacks resolve spontaneously or are corticosteroid-responsive, ~ 5% of CNS-IDD attacks are refractory to steroids, necessitating rescue therapy. We demonstrated the efficacy of plasma exchange (PLEX) in a randomized, sham-controlled, double-masked clinical trial; other non-randomized studies, both prospective and retrospective, have consistently supported the efficacy of PLEX expressly in the setting of steroid-refractory, fulminant CNS-IDD attacks.1–10 Male gender, preserved reflexes and early initiation of PLEX were features associated with beneficial PLEX response.2, 3 PLEX efficacy is likely due to the non-specific removal of inflammatory and humoral factors that might contribute to reversible functional conduction block, before permanent axonal or neuronal damage has ensued.11–14 Immunopathological studies have demonstrated prominent humoral immunopathogenic mechanisms that may be responsive to PLEX in a subset of CNS-IDD cases, namely MS immunopattern II (IP II) and neuromyelitis optica (NMO).15, 16
Clinical, radiographic, and serological factors that reliably differentiate immunopathological patterns or disease mechanisms remain elusive. Despite the ~45% PLEX response rate reported among CNS-IDD patients, determinants of interindividual differences in PLEX response, as well as the mechanism(s) underlying the rapid, all-or-none response are not well characterized. The current study represents the largest clinical-radiographic-serological series to date of acute, steroid-refractory attacks of CNS-IDD treated with PLEX and identifies clinical and radiographic factors associated with beneficial PLEX response. These findings may identify patients more likely to exhibit a favorable PLEX response and provide further insights into the underlying pathobiology of steroid-refractory CNS-IDD.
Patients and Methods
This study, approved by the Mayo Clinic Institutional Review Board (IRB# 120–06), analyzed clinical, radiographic, and serological findings among patients treated with PLEX for steroid-refractory CNS-IDD attacks between 1990 and 2007. Inclusion criteria were: 1) CNS-IDD 2) PLEX for a steroid-refractory CNS-IDD attack 3) at least one 0-to-3 month pre-PLEX MRI study and/or serum sample and 4) sufficient clinical documentation regarding PLEX response. Exclusion criteria included: 1) clinical, radiological, or pathological findings suggesting diseases other than CNS-IDD, and 2) receiving fewer than 2 plasma exchanges.
Patient ascertainment
All Mayo Clinic patients receiving PLEX between January 1990 and November 2007 for a CNS-IDD were identified. For the period prior to June 2000, patients were ascertained from our previously reported PLEX cohort (n=37)3. For the period December 2005 to December 2007, patients were prospectively ascertained from the Mayo Clinic Apheresis Unit. We identified 212 patients, of whom 59 did not meet inclusion criteria and were excluded (Figure 1). The remaining 153 patients met inclusion criteria and were assigned to the following cohorts for subgroup analysis: clinical cohort (n=153), brain attack cohort (n=78), opticospinal attack cohort (n=85), and serology cohort (n=34). The clinical cohort consisted of all patients with sufficient documentation to ascertain PLEX response. In addition, patients with 0-to-3month pre-PLEX brain and/or spine MRI available for analysis comprised the brain attack and opticospinal attack cohorts, respectively. Due to the established disease-specificity of NMO-IgG, the serological cohort was restricted exclusively to NMO spectrum disorder patients with 0-to-3month pre-PLEX sera available for NMO-IgG analysis.17
Figure 1. Ascertainment of PLEX cohort and sample size for each analysis.

Exclusions included: receiving fewer than two exchanges (n=2), receiving PLEX for an attack related to a co-existing condition and not due to a CNS-IDD attack (diabetic neuropathy, n=1; polycythemia vera, n=1). PLEX=plasma exchange; CNS-IDD=central nervous system inflammatory demyelinating disease. NMOSD=NMO spectrum disorder (ie. NMO, LETM, recurrent optic neuritis).
Clinical data
Medical record review provided sufficient clinical documentation for study inclusion in 153 patients. Clinical course was classified as monophasic, relapsing-remitting, secondary progressive, and primary progressive.18 Diagnoses were based on published criteria: probable or definite multiple sclerosis (MS),19, 20 neuromyelitis optica spectrum disorders (NMOSD; i.e. NMO, longitudinally extensive transverse myelitis [LETM; ≥ 3 vertebral segment] and recurrent optic neuritis),21 monophasic optic neuritis (ON), acute disseminated encephalomyelitis (ADEM),22 short transverse myelitis (TM; < 3 vertebral segments),23 and clinically isolated syndrome24 in patients with a single neurological episode at last follow-up. The index attack was defined as the constellation of neurological symptoms leading to initiation of PLEX. Disease duration at PLEX was defined as time from the patient’s first-ever documented neurological deficits to time of PLEX initiation; disease duration at last follow-up was defined as the interval between the patient’s first-ever documented neurological deficits and their last documented follow-up.
Radiographic material
MRI analysis, performed by one evaluator blinded to clinical data, was restricted to T1-weighted (T1W), T2W, fluid-attenuated-inversion recovery (FLAIR), and T1W+gadolinium (T1W+Gd) sequences. When more than one lesion was observed, the largest lesion was characterized independently and analyzed for the same radiographic features. The radiographic features of interest were initially defined by consensus among study investigators (S.M.M, B.J.E., C.F.L) during training sessions prior to data collection. Questions regarding radiographic interpretations were adjudicated by a certified neuroradiologist (B.J.E.). Radiographic features of interest were: lesion location, T2W lesion load, T2W lesion size; presence and grade of mass effect; presence and degree of edema; and presence of T2W hypointense rim. Enhancement patterns were defined as homogenous, ring-like, or heterogenous. Complex lesions had more than one enhancement pattern. MRI studies were evaluated for multifocality and fulfillment of Barkhof criteria.25
Serological material
Pre-PLEX serum samples were tested for NMO-IgG (by indirect immunofluorescence assay)17 by two independent and blinded observers. Samples were scored as positive (titer ≥ 120) or negative (negative at a titer < 120).
Primary outcome
The primary outcome was PLEX response as defined in our randomized trial.2 Improvement in attack-related, targeted neurological deficit(s) (TND) was graded as: ‘no improvement’ if there was no gain in neurologic function; ‘mild improvement’ if there was improvement in neurologic status without impacting function; ‘moderate improvement’ if there was definite improvement in function; and marked improvement if there was major functional improvement. Treatment success requiring moderate or marked functional improvement in at least one TND was assessed in the 6-month period following PLEX treatment.
Statistical analysis
We performed an exploratory statistical analysis to evaluate associations between PLEX response and clinical factors, radiographic features, and NMO-IgG serostatus. The unit of analysis was based on individual patients. Descriptive statistics, including medians, ranges, and interquartile ranges (IQRs) were used to summarize continuous variables. Comparisons between categorical and continuous variables were performed using Fisher’s exact test or Wilcoxon’s rank sum test, respectively. Logistic regression modeling was used for secondary analysis in order to further summarize several univariate associations. We report unadjusted odds ratios and odds ratios adjusted for sex, days to PLEX, and preservation of deep tendon reflexes, which are three background covariates that could a priori be considered potential confounders. Our analysis looked at a large number of potential predictors of a beneficial PLEX response. Although increasing the number of tests could increase our chance of one or more false-positive findings, unadjusted, or per-comparison, p-values are reported since single-inference questions were asked and multiple-comparison tests would greatly inflate false-negative errors in this context.26–29
Results
Patient demographics and clinical characteristics
One-hundred-and-four patients were female (68%). Median age at disease onset was 38 years (IQR 28; 50; range 7–75) with the median age at time of PLEX of 44 years (IQR 34, 55; range 6–76). Tables 1 and 2 summarize PLEX response rate by pre-and post-PLEX clinical features, respectively. Median disease duration at time of PLEX was 1.4 years (range 18 days to 38.5 years). The most common diagnoses at time of PLEX were: definite or probable MS (n=73; 48%), LETM (n=36; 24%), and NMO (n=26; 17%). At last follow-up the most common diagnoses were definite or probable MS (n=73; 49%), NMO (n=34; 23%) and LETM (n=27; 18%).
Table 1.
Clinical spectrum of PLEX cohort at time of PLEX
| Clinical feature | All Subjects (n=153) | PLEX Responders (n=90; 59%) | PLEX Non-responders (n=63; 41%) | PLEX Response Rate (%) |
|---|---|---|---|---|
| Disease duration at PLEX, median* (range) | 1.4 yr (18 d to 38.5 yr) | 1.1 yr (18 d to 32.9 yr) | 2.3 yr (29 d to 38.5 yr) | |
| Clinical course prior to PLEX, no. (%) | ||||
| Monophasic | 43 (28) | 27 (30) | 16 (25) | 63 |
| Relapsing | 104 (68) | 60 (67) | 44 (70) | 58 |
| Progressive‡ | 5 (3) | 2 (2) | 3 (5) | 40 |
| Diagnosis at PLEX, no. (%) | ||||
| Definite MS | 55 (36) | 34 (38) | 21(33) | 62 |
| Probable MS | 18 (12) | 10 (11) | 8 (13) | 56 |
| NMO | 26 (17) | 11 (12) | 15 (24) | 42 |
| LETM | 36 (24) | 25 (28) | 11 (17) | 69 |
| Recurrent ON | 1 (1) | 0 | 1 (2) | 0 |
| TM | 9 (6) | 6 (7) | 3 (5) | 67 |
| ADEM | 3 (2) | 0 | 3 (5) | 0 |
| CIS | 5 (3) | 4 (4) | 1 (2) | 80 |
| EDSS at index attack, median (IQR) | 8 (6.5, 8.5) | 8 (6.5, 8.5) | 8 (6, 8.5) | |
p ≤ 0.05
Four patients had a progressive course with superimposed attacks; one patient had a progressive course without superimposed attacks.
Abbreviations: NMO: neuromyelitis optica; LETM: longitudinally extensive myelitis; ON: optic neuritis; TM: transverse myelitis; ADEM: acute disseminated encephalomyelitis; CIS; clinically isolated syndrome.
Table 2.
Clinical spectrum of PLEX cohort at time of last follow-up
| Clinical feature | All Subjects (n=153) | PLEX Responders (n=90; 59%) | PLEX Non-responders (n=63; 41%) | PLEX Response Rate (%) |
|---|---|---|---|---|
| Disease duration at last follow-up, median (range) | 5.2 yrs (83 d to 39 yrs) | 4.8 yrs (83 d to 38 yrs) | 6.4 yrs (109 d to 39 yrs) | |
| Clinical course at last follow-up†, no. (%) | ||||
| Monophasic | 49 (35) | 30 (34) | 19 (35) | 61 |
| Relapsing | 83 (58) | 54 (62) | 29 (53) | 65 |
| Progressive* | 10 (7) | 3 (3) | 7 (13) | 30 |
| Diagnosis at last follow-up, no. % | ||||
| Definite MS* | 64 (43) | 42 (47) | 22 (36) | 66 |
| Probable MS | 9 (6) | 4 (4) | 5 (8) | 44 |
| NMO | 34 (23) | 18 (20) | 16 (26) | 53 |
| LETM | 27 (18) | 17 (19) | 10 (16) | 63 |
| Recurrent ON | 1 (1) | 0 | 1 (2) | 0 |
| TM | 9 (6) | 6 (7) | 3 (5) | 67 |
| ADEM | 2 (1) | 0 | 2 (3) | 0 |
| CIS | 4 (3) | 2 (2) | 2 (3) | 50 |
| EDSS at last follow-up, median (IQR)** | 6.5 (3.5, 8) | 4 (2, 7) | 8 (6.5, 8.5) | |
p ≤ 0.05;
p<0.001
At last follow-up, 6 responders and 17 non-responders were deceased. Cause of death MS-related in 8 non-responders and unknown in 9 non-responders; cause of death was non-MS-related in 1 responder and unknown in 5 responders.
Abbreviations: NMO: neuromyelitis optica; LETM: longitudinally extensive myelitis; ON: optic neuritis; TM: transverse myelitis; ADEM: acute disseminated encephalomyelitis; CIS; clinically isolated syndrome.
Index attack leading to PLEX
Median time from index attack to PLEX was 23 days (range 0 to 186 days), with a median of 7 exchanges (range 2 to 24). Most patients were severely disabled in at least one clinical domain with a median Expanded Disability Status Score30 (EDSS) of 8 (range 3 to 9.5) and presented with a relapsing clinical course (n=104; 68%) with typically polysymptomatic index attack symptoms (Figure 2). The most common presenting symptoms in decreasing frequency and grouped according to systems were: motor (84%), sensory (71%), sphincter (65%), cerebellar (48%), brainstem (38%) and cognitive (25%). Of interest to CNS-IDDs, 14% of patients presented at time of PLEX with either monocular or binocular optic neuritis. Symptoms associated with the highest PLEX response rates were brainstem (64%), cerebellar (63%), motor (59%) and cognitive (54%).
Figure 2. Frequency of presenting symptoms at index attack (A) and PLEX response rate by presenting symptom among all patients with that symptom (B).

Note: Most patients had polysymptomatic attacks and thus could have more than one presenting symptom.
Outcome of PLEX and clinical features associated with treatment success
Ninety patients (59%; 95% confidence interval [CI], 51% to 66%) exhibited moderate-to-marked functional improvement within the 6 months following PLEX. Table 3 summarizes logistic regression modeling of clinical features that appear to be associated with PLEX response in our clinical cohort (n=153). Patients with preserved deep tendon reflexes (DTRs) had a four-fold increase in their odds of responding to PLEX compared to areflexic patients (OR=4.3; 95%CI 1.8 to 10; p=0.001). Sex, EDSS at index attack, and time from index attack to initiation of PLEX were not associated with PLEX response. PLEX responders had a shorter median disease duration at time of PLEX compared to PLEX non-responders (1.1 yrs vs. 2.3 yrs; p=0.020; Table 1). The overall PLEX response rate among our serological cohort was 74%, with PLEX responders having a shorter median disease duration than PLEX non-responders (345 days vs. 4 yrs; p=0.042).
Table 3.
Unadjusted logistic regression models of clinical features associated with PLEX response among all patients (n=153)
| PLEX response rate (%) | Odds ratio (95% CI) | P-value | |
|---|---|---|---|
| Sex | 0.68 | ||
| Female | 58 | 1.0 | |
| Male | 61 | 1.16 (0.58 to 2.3) | |
| Time from index attack to PLEX | 0.89 | ||
| ≤ 20 days | 60 | 1.0 | |
| 21–60 days | 60 | 1.03 (0.51 to 2.1) | |
| >60 days | 55 | 0.81 (0.31 to 2.1) | |
| EDSS at index attack | 0.98 | ||
| <8 | 59 | 1.0 | |
| ≥8 | 58 | 0.99 (0.51, 1.9) | |
| Deep Tendon Reflexes | 0.001 | ||
| Hypo/Absent | 31 | 1.0 | |
| Brisk/Normal | 66 | 4.3 (1.8, 10) |
Temporal course of clinical response to PLEX and the follow-up period
Patients who exhibited functional improvement did so within a median of 4 days (range 1 to 100 days) and by a median of the 3rd exchange (range 1 to 12 exchanges). However, a small subset of patients (n=4; 6%) exhibited a delayed response to PLEX (60 days to 100 days). Patients were followed for a median of 1.9 years (IQR 8 mo., 4.4 yrs). PLEX responders were significantly less impaired at time of last follow-up (median EDSS=4; IQR 2, 7) as compared to non-responders (median EDSS=8; IQR 6.5, 8.5) (p<0.001). RRMS patients at last follow-up had the highest PLEX response rate (75%) compared to all other CNS-IDDs (52%, p=0.008). Patients who developed a progressive disease course by last follow-up had a lower PLEX response rate (30% vs. 64%; p=0.046, Table 2).
Radiographic characteristics of the cohort
Table 4 summarizes separately the radiographic spectrum for non-NMO patients with at least one brain scan (n=78) and for all subjects with at least one spine MRI (n=85). Multifocal brain lesions were present in 91% (n=70) of patients, with Barkhof criteria fulfilled in 65% (n=47). The most common lesion locations were: periventricular white matter (n=64; 89%), hemispheric/subcortical white matter (n=64; 89%), and juxtacortical white matter (n=61; 85%); followed by brainstem (n=38; 53%), corpus callosum (n=38; 53%;), of whom 6 had a butterfly configuration, deep gray (n=32; 44%), cerebellar (n=23; 32%), and cortical (n=10; 14%). Median largest lesion size on brain MRI was 3.4 cm (range 0.3 to 15), with nearly half of the cohort (46%) having a largest lesion between 2.1 to 5 cm in size. Peri-lesional edema and/or mass effect on brain lesions were noted. Representative enhancement patterns are illustrated in Figure 3. The most common enhancement patterns were: ring/arc (n=25; 52%), diffuse/patchy (n=32; 46%), fluffy/cotton ball (n=21; 30%) and nodular (n=19; 27%). Less frequent enhancement patterns included homogenous (n=12; 17%), heterogenous (n=6; 9%), punctuate (n=5, 7%), and other miscellaneous patterns (n=4; 6%). T2W hypointense rims were observed in 18 patients (25%) and co-localization of ring enhancement and T2W hypointense rims was observed in 11 (66%) of these patients.
Table 4.
Brain and spine MRI features of PLEX cohort
| Feature | Brain Scans* (n=78) | Spine Scans (n=85) |
|---|---|---|
| T2 Lesion load, number (%)a | ||
| No lesions observed | 5 (6) | 12 (15) |
| Unifocal | 2 (3) | 53 (65) |
| Multifocal | 70 (91) | 17 (21) |
| T1W+Gd lesions, number (%)b | ||
| No enhancing lesions observed | 22 (31) | 14 (21) |
| Unifocal | 16 (23) | 47 (70) |
| Multifocal | 32 (46) | 6 (9) |
| Mass Effect on brain MRI, no. (%); (n=72) | 36 (46) | — |
| Mild | 30 (42) | — |
| Moderate/Marked | 6 (8) | — |
| Edema on brain MRI, no. (%)c; (n=71) | 34 (48) | — |
| Mild | 23 (33) | — |
| Moderate/Marked | 9 (13) | — |
| Mass effect or edema on spine MRI, no. (%); (n=63) | — | 41 (65) |
| Mild | — | 8 (13) |
| Moderate/Marked | — | 33 (52) |
| Largest Lesion Size, no. (%); (n=65) | ||
| ≤ 5 cm | 46 (71) | — |
| >5 cm | 19 (29) | — |
| Largest lesion size, median (range), cm | 3.4 (0.3 to 15) | — |
| Vertebral segments involved, no. (%); (n=70) | ||
| ≤ 3 | — | 20 (29) |
| > 3 | — | 50 (71) |
| Number of scans/patient, median (range) | 1 (1 to 5) | 1 (1 to 5) |
Sample sizes: brain, n=77; spine, n=82
Sample sizes: brain, n=70; spine, n=67
Severity is unknown for two subjects
Brain MRI cohort excludes NMO patients.
Figure 3. Representative gadolinium enhancement patterns.

Homogenous (A); Heterogenous (B); Diffuse/patchy (C); Fluffy/cotton ball (D); Punctate (<2mm) (E); Nodular (>2mm) (F); Open ring to cortex (G); Arc (H); T2 hypointense rim co-localizing with ring enhancement (I). A-H; T1W MRI+Gd.
Radiographic brain features associated with PLEX response
PLEX response rates were significantly higher among patients with ring enhancement of the largest lesion (82%) compared to patients without ring enhancement (54%) and in patients with mass effect (75%) vs. patients without mass effect (50%) (Figure 4). The presence of mass effect on the largest lesions was associated with a 75% response rate compared to those without mass effect (50%). Patients with edema on the largest lesion also had higher PLEX response rates vs. patients without edema (73% vs. 54%). Expressed another way, patients with RELs of their largest lesion on pre-PLEX MRI appeared to have a four-times greater odds of exhibiting a beneficial PLEX response as compared to patients without RELs (unadjusted OR=4; 95% CI 1.03 to 15.6; p=0.029). Presence of mass effect and/or edema was associated with increased likelihood of PLEX response (mass effect: unadjusted OR=3.0; 95% CI 1.1 to 8.0; p=0.024, edema: unadjusted OR=2.3; 95% CI 0.84 to 6.5; p=0.097). There were no significant associations between PLEX response and lesion load, location, size, other enhancement patterns, multifocality or fulfillment of Barkhof criteria.
Figure 4. PLEX response rate with 95% CI (A) and odds ratio with 95% CI (B) by brain MRI feature on largest lesion.
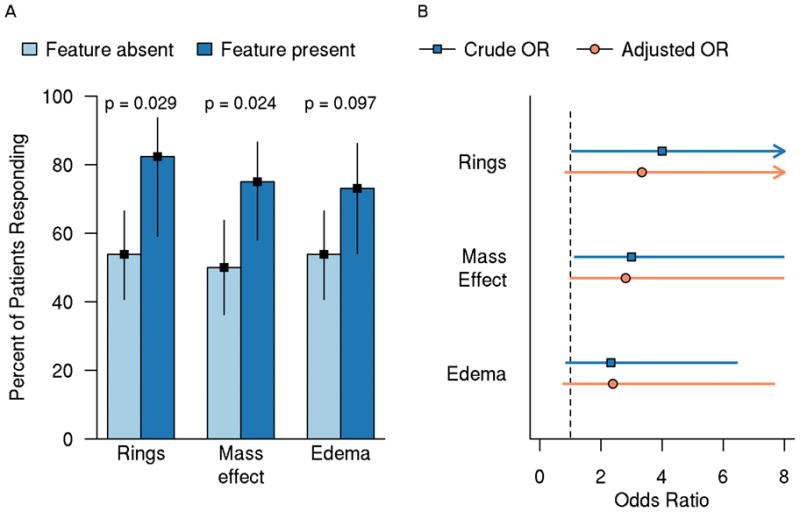
A) Bars represent PLEX response rate; lines represent 95% CI. P-values are based on unadjusted logistic regression models B) Adjusted model was adjusted for days to PLEX on the log-transformed scale, EDSS at time of PLEX, and DTRs. PLEX=plasma exchange; OR=odds ratio; CI=confidence interval; RELs=ring-enhancing lesions; EDSS=Expanded Disability Status Scale; DTRs=deep tendon reflexes.
Serological predictors of PLEX
Table 5 summarizes PLEX response by NMO-IgG serostatus. Thirty-four patients had at least one pre-PLEX serum sample available for NMO-IgG IFA analysis. The median time from blood draw to PLEX was 6 days (IQR 2, 15). NMO-IgG was detected in 22 patients (65%), with a median titer value of 1920 (range120 to 61,440). PLEX response rate did not differ significantly (p=0.44) between patients who were NMO-IgG seropositive (68%; 95% CI 47% to 84%) or NMO-IgG seronegative (83%; 95% CI 55% to 95%).
Table 5.
PLEX response by NMO-IgG serostatus (n=34)
| PLEX response | NMO-IgG Seropositive | NMO-IgG Seronegative |
|---|---|---|
| Responders | ||
| Number (%) | 15 (68%) | 10 (83%) |
| 95% CI | 47% to 84% | 55% to 95% |
| Non-Responders | ||
| Number (%) | 7 (32%) | 2 (17%) |
| 95% CI | 16% to 53% | 5% to 45% |
Discussion
Clinical features and PLEX response
Our study represents the largest series of PLEX patients treated for a steroid-refractory attack of CNS-IDD. Functional improvement within 6 months was observed in 59% of patients, which agrees with previously published PLEX response rates ranging between 40–63%.1–10 The higher PLEX response rate in our series is comparable to the 63% response rate observed in the Llufriu series10 and may be due to both studies assessing neurological improvement beyond the acute response phase.
Previously reported clinical factors predictive of PLEX response include: male sex, early initiation of PLEX, preserved deep tendon reflexes (DTRs), and early improvement.3, 10 Similar to the Llufriu series, we found no association between male sex and PLEX response.10 However, patients with preserved DTRs appeared to have a four-fold increased likelihood of PLEX response as compared to areflexic patients. Areflexia may be the consequence of irreversible anterior horn cell damage less amenable to PLEX rescue therapy. Additionally, PLEX responders in our clinical and serological cohorts had shorter pre-PLEX disease duration than PLEX nonresponders (1.1 yrs vs. 2.3 yrs clinical cohort; 345 days vs. 4.0 yrs serological cohort). Since pre-PLEX disability was not determined in the current study, the lower PLEX response rate may be related to greater preexisting disability. At time of PLEX, both PLEX responders and non-responders had a median EDSS of 8. Although this degree of disability is more typical of progressive MS, the high EDSS reflects the fulminant nature of CNS-IDD attacks within our predominantly relapsing cohort. At time of last follow-up, PLEX responders had a median EDSS of 4, further indicating these were not fixed, irreversible deficits at time of PLEX.
Two clinically relevant temporal courses must be taken into account when considering the management of patients with fulminant CNS-IDD attacks. The first is time from attack onset to PLEX initiation and the second is time from PLEX initiation to PLEX response. Early initiation of PLEX may portend a favorable response. In our previous PLEX series, the highest PLEX response rate was observed among patients receiving PLEX ≤ 20 days from attack onset.3 Although there may be a decreased likelihood of prolonged inflammation and subsequent axonal damage among patients in whom PLEX is initiated early, this observation has not been consistently replicated. Patients in our series receiving PLEX > 60, 80 and 90 days from attack onset had similar PLEX response rates as those receiving PLEX within 20 days of attack onset (55, 63, 60% vs. 60%, respectively). Indeed, previous reports have also found PLEX to be beneficial even when delayed after attack onset.1, 3, 4, 9 Although it may be appropriate to consider PLEX in patients with persistent symptoms beyond 90 days in duration, other clinical or radiographic indicators of ongoing disease activity may help guide this decision.
The second clinically relevant temporal course relates to the interval between PLEX initiation and PLEX response. Consistent with previous observations, PLEX responders in our cohort responded rapidly (median of 4 days and by the 3rd exchange). Although defining the therapeutic window of PLEX was not the subject of this study, it is noteworthy that a subset of patients (n=4, 6% of all responders) were ‘delayed PLEX responders’ (ie. 60–100 days following PLEX), as observed in the Llufriu series.10 Although the possibility of spontaneous improvement cannot be excluded, these studies suggest neurological improvement may continue beyond the initial PLEX treatment phase and is relevant when discussing functional neurologic prognosis with patients and their families.
Radiographic features and PLEX response
To our knowledge, this is the first report to identify a reliable radiographic surrogate marker predictive of a beneficial PLEX response in patients with steroid-refractory CNS-IDD attacks. In the current series, 91% of patients presented with multiple lesions at time of PLEX, which may account for the polysymptomatic presentation observed among the cohort. Large (>2cm) tumefactive lesions were common, with nearly 53% of patients demonstrating either mass effect or edema, and 52% exhibiting RELs on brain MRI. An analysis investigating potential clinical confounders driving PLEX response among patients with RELs did not reveal any significant differences in terms of diagnosis, clinical course, EDSS or other clinical variables; therefore the association between PLEX response and RELs is not driven by underlying clinical variables but rather is driven by the underlying pathobiology of the disease. RELs are more common among MS immunopattern II patients where a humoral pathology dominates, and who have been reported to be responsive to PLEX.15 Therefore, the exquisite PLEX response observed among patients with RELs in our series further supports a role for humoral pathogenic mechanisms underlying the observed favorable PLEX response.
NMO-IgG serostatus and PLEX response
The discovery of the disease-specific serum biomarker, NMO-IgG, in patients with NMO spectrum disorders, and elucidation of its antigenic target, aquaporin-4 (AQP4) has enhanced the early diagnosis of NMO. Overall PLEX response rate in our serological cohort was 74%, with NMO-IgG detected in 65% of patients (Table 5). Two studies have examined NMO-IgG serostatus and its association with PLEX response, with conflicting results.5, 7 PLEX response was not associated with NMO-IgG serostatus (p=0.44) in our cohort and was actually higher in NMO-IgG seronegative patients (83%) as compared to NMO-IgG seropositive patients (68%). Beneficial PLEX response observed in NMO patients irrespective of NMO-IgG serostatus suggests that a unified humoral pathomechanism may be operative in both NMO-IgG seronegative and seropositive patients.31 Future in vitro and in vivo studies are needed to better characterize this unique subset of patients.
Acknowledgments
The authors would like to thank Dr. Jeffrey Winters and the Mayo Clinic Apheresis Unit for their assistance in patient ascertainment and Ms. Lea Dacy for assistance with manuscript preparation. This work was funded by Mayo Foundation, NIH CTS Grant 1 TL1 RR024152-01 (SMM); NMSS RG-3185-B-3 (CFL); NINDS NS-49577-01 (CFL); and a generous gift from the Guthy-Jackson Charitable Foundation.
Role of funding source
The sponsor had no role in the study design, data collection, data analysis, data interpretation, or writing of the manuscript, and was not involved in the decision to submit the paper for publication.
Footnotes
Disclosures: “Drs. Lennon, Lucchinetti, and Weinshenker stand to receive royalties for intellectual property related to the AQP4 autoantigen.” Dr. Keegan is compensated as section editor for Neurology and as a Chief Editor for eMedicine.
Contributors
SMM, CFL, BMK, BGW, BJE, MR were involved in study design. SMM collected clinical and radiographic data. VAL and SJP performed NMO-IgG testing. SMM, CFL, JM, SW, KT were involved in data analysis and interpretation. LL assisted with retrieval of outside medical records and MRIs. SMM wrote the first draft and all authors critically evaluated the manuscript.
Conflicts of interest
VAL, CFL, BGW stand to receive royalties for intellectual property related to the AQP4 autoantigen. BMK is compensated as section editor for Neurology and as a Chief Editor for eMedicine. SMM, BJE, SJP, MR, KT, SW, JM, LL have no conflict of interest.
References
- 1.Rodriguez M, Karnes WE, Bartleson JD, Pineda AA. Plasmapheresis in acute episodes of fulminant CNS inflammatory demyelination. Neurology. 1993;43:1100–1104. doi: 10.1212/wnl.43.6.1100. [DOI] [PubMed] [Google Scholar]
- 2.Weinshenker BG, O’Brien PC, Petterson TM, et al. A randomized trial of plasma exchange in acute central nervous system inflammatory demyelinating disease. Ann Neurol. 1999;46:878–886. doi: 10.1002/1531-8249(199912)46:6<878::aid-ana10>3.0.co;2-q. [DOI] [PubMed] [Google Scholar]
- 3.Keegan M, Pineda AA, McClelland RL, et al. Plasma exchange for severe attacks of CNS demyelination: predictors of response. Neurology. 2002;58:143–146. doi: 10.1212/wnl.58.1.143. [DOI] [PubMed] [Google Scholar]
- 4.Bennetto L, Totham A, Healy P, et al. Plasma exchange in episodes of severe inflammatory demyelination of the central nervous system. A report of six cases. J Neurol. 2004;251:1515–1521. doi: 10.1007/s00415-004-0588-8. [DOI] [PubMed] [Google Scholar]
- 5.Watanabe S, Nakashima I, Misu T, et al. Therapeutic efficacy of plasma exchange in NMO-IgG-positive patients with neuromyelitis optica. Mult Scler. 2007;13:128–132. doi: 10.1177/1352458506071174. [DOI] [PubMed] [Google Scholar]
- 6.Watanabe S, Nakashima I, Miyazawa I, et al. Successful treatment of a hypothalamic lesion in neuromyelitis optica by plasma exchange. J Neurol. 2007;254:670–671. doi: 10.1007/s00415-006-0329-2. [DOI] [PubMed] [Google Scholar]
- 7.Bonnan M, Valentino R, Olindo S, et al. Plasma exchange in severe spinal attacks associated with neuromyelitis optica spectrum disorder. Mult Scler. 2009;15:487–492. doi: 10.1177/1352458508100837. [DOI] [PubMed] [Google Scholar]
- 8.Mao-Draayer Y, Braff S, Pendlebury W, Panitch H. Treatment of steroid-unresponsive tumefactive demyelinating disease with plasma exchange. Neurology. 2002;59:1074–1077. doi: 10.1212/wnl.59.7.1074. [DOI] [PubMed] [Google Scholar]
- 9.Paus S, Promse A, Schmidt S, Klockgether T. Treatment of steroid-unresponsive tumefactive demyelinating disease with plasma exchange. Neurology. 2003;61:1022. doi: 10.1212/01.wnl.0000082170.18782.97. author reply 1022. [DOI] [PubMed] [Google Scholar]
- 10.Llufriu S, Castillo J, Blanco Y, et al. Plasma exchange for acute attacks of CNS demyelination: Predictors of improvement at 6 months. Neurology. 2009;73:949–953. doi: 10.1212/WNL.0b013e3181b879be. [DOI] [PubMed] [Google Scholar]
- 11.Dau PC. Plasmapheresis in acute multiple sclerosis: rationale and results. J Clin Apher. 1991;6:200–204. doi: 10.1002/jca.2920060405. [DOI] [PubMed] [Google Scholar]
- 12.Khatri BO. Therapeutic apheresis in neurological disorders. Ther Apher. 1999;3:161–171. doi: 10.1046/j.1526-0968.1999.00149.x. [DOI] [PubMed] [Google Scholar]
- 13.Gold R, Hartung HP. Towards individualised multiple-sclerosis therapy. Lancet Neurol. 2005;4:693–694. doi: 10.1016/S1474-4422(05)70205-2. [DOI] [PubMed] [Google Scholar]
- 14.Archelos JJ, Storch MK, Hartung HP. The role of B cells and autoantibodies in multiple sclerosis. Ann Neurol. 2000;47:694–706. [PubMed] [Google Scholar]
- 15.Keegan M, Konig F, McClelland R, et al. Relation between humoral pathological changes in multiple sclerosis and response to therapeutic plasma exchange. Lancet. 2005;366:579–582. doi: 10.1016/S0140-6736(05)67102-4. [DOI] [PubMed] [Google Scholar]
- 16.Lucchinetti CF, Mandler RN, McGavern D, et al. A role for humoral mechanisms in the pathogenesis of Devic’s neuromyelitis optica. Brain. 2002;125:1450–1461. doi: 10.1093/brain/awf151. [DOI] [PMC free article] [PubMed] [Google Scholar]
- 17.Lennon VA, Wingerchuk DM, Kryzer TJ, et al. A serum autoantibody marker of neuromyelitis optica: distinction from multiple sclerosis. Lancet. 2004;364:2106–2112. doi: 10.1016/S0140-6736(04)17551-X. [DOI] [PubMed] [Google Scholar]
- 18.Lublin FD, Reingold SC. Defining the clinical course of multiple sclerosis: results of an international survey. National Multiple Sclerosis Society (USA) Advisory Committee on Clinical Trials of New Agents in Multiple Sclerosis. Neurology. 1996;46:907–911. doi: 10.1212/wnl.46.4.907. [DOI] [PubMed] [Google Scholar]
- 19.Poser CM, Paty DW, Scheinberg L, et al. New diagnostic criteria for multiple sclerosis: guidelines for research protocols. Ann Neurol. 1983;13:227–231. doi: 10.1002/ana.410130302. [DOI] [PubMed] [Google Scholar]
- 20.McDonald WI, Compston A, Edan G, et al. Recommended diagnostic criteria for multiple sclerosis: guidelines from the International Panel on the diagnosis of multiple sclerosis. Ann Neurol. 2001;50:121–127. doi: 10.1002/ana.1032. [DOI] [PubMed] [Google Scholar]
- 21.Wingerchuk DM, Lennon VA, Lucchinetti CF, et al. The spectrum of neuromyelitis optica. Lancet Neurol. 2007;6:805–815. doi: 10.1016/S1474-4422(07)70216-8. [DOI] [PubMed] [Google Scholar]
- 22.Wingerchuk DM, Lucchinetti CF. Comparative immunopathogenesis of acute disseminated encephalomyelitis, neuromyelitis optica, and multiple sclerosis. Curr Opin Neurol. 2007;20:343–350. doi: 10.1097/WCO.0b013e3280be58d8. [DOI] [PubMed] [Google Scholar]
- 23.Proposed diagnostic criteria and nosology of acute transverse myelitis. Neurology. 2002;59:499–505. doi: 10.1212/wnl.59.4.499. [DOI] [PubMed] [Google Scholar]
- 24.Tintore M, Rovira A, Martinez MJ, et al. Isolated demyelinating syndromes: comparison of different MR imaging criteria to predict conversion to clinically definite multiple sclerosis. Ajnr. 2000;21:702–706. [PMC free article] [PubMed] [Google Scholar]
- 25.Barkhof F, Filippi M, Miller DH, et al. Comparison of MRI criteria at first presentation to predict conversion to clinically definite multiple sclerosis. Brain. 1997;120 (Pt 11):2059–2069. doi: 10.1093/brain/120.11.2059. [DOI] [PubMed] [Google Scholar]
- 26.O’Brien PC. The appropriateness of analysis of variance and multiple-comparison procedures. Biometrics. 1983;39:787–794. [PubMed] [Google Scholar]
- 27.Perneger TV. What’s wrong with Bonferroni adjustments. BMJ (Clinical research ed) 1998;316:1236–1238. doi: 10.1136/bmj.316.7139.1236. [DOI] [PMC free article] [PubMed] [Google Scholar]
- 28.Rothman KJ. No adjustments are needed for multiple comparisons. Epidemiology (Cambridge, Mass) 1990;1:43–46. [PubMed] [Google Scholar]
- 29.Rothman KJ, Greenland S, Lash TL. Modern epidemiology. 3. Philadelphia: Wolters Kluwer Health/Lippincott Williams & Wilkins; 2008. p. x.p. 758. [Google Scholar]
- 30.Kurtzke JF. Rating neurologic impairment in multiple sclerosis: an expanded disability status scale (EDSS) Neurology. 1983;33:1444–1452. doi: 10.1212/wnl.33.11.1444. [DOI] [PubMed] [Google Scholar]
- 31.Amiry-Moghaddam M, Ottersen OP. The molecular basis of water transport in the brain. Nat Rev Neurosci. 2003;4:991–1001. doi: 10.1038/nrn1252. [DOI] [PubMed] [Google Scholar]