

Abstract
While spiral trajectories have multiple attractive features such as their isotropic resolution, acquisition efficiency, and robustness to motion, there has been limited application of these techniques to first pass perfusion imaging because of potential off-resonance and inconsistent data artifacts. Spiral trajectories may also be less sensitive to dark-rim artifacts (DRA) that are caused, at least in part, by cardiac motion. By careful consideration of the spiral trajectory readout duration, flip angle strategy, and image reconstruction strategy, spiral artifacts can be abated to create high quality first pass myocardial perfusion images with high SNR. The goal of this paper was to design interleaved spiral pulse sequences for first-pass myocardial perfusion imaging, and to evaluate them clinically for image quality and the presence of dark-rim, blurring, and dropout artifacts.
Keywords: Myocardial Perfusion, Spiral Pulse Sequences, Saturation Recovery
Introduction
It is estimated that 17.6 million Americans have coronary artery disease (CAD) and it is responsible for approximately 1 in 6 deaths.(1) A recent retrospective analysis of the National Cardiovascular Data Registry demonstrated that nearly 40% of the 398,987 patients without known CAD who underwent coronary angiography did not have significant CAD.(2) Thus, improvements in the accuracy of non-invasive assessment of CAD could significantly reduce health care costs resulting from unnecessary and expensive invasive procedures. Cardiac magnetic resonance (CMR) stress perfusion imaging has multiple potential advantages over existing modalities, and its combination with wall motion analysis and late gadolinium enhancement can provide additional important information to assess for the presence and extent of CAD.(3)
First-pass perfusion imaging using CMR has become clinically applicable, but has not yet gained widespread acceptance. One of the limitations has been the presence of dark-rim artifacts that may be mistaken for true perfusion abnormalities resulting in false positive studies.(4–7) Multiple factors have been hypothesized to contribute to the dark rim artifact including magnetic susceptibility differences between the myocardium and blood pool during first-pass of contrast, “Gibbs ringing” resulting from the limitations in spatial resolution predominantly in the phase encoding direction, and motion-induced phase shifts during data acquisition resulting from cardiac motion during the finite time of data acquisition.(4, 8–10)
Efforts to combat this dark rim artifact have primarily focused on imaging the heart faster to minimize effects of myocardial motion during the imaging sequence, and increasing spatial resolution to minimize the effects of “Gibbs” ringing. These have included the use of interleaved EPI pulse sequences (11,12) and using parallel imaging techniques.(12, 13)
Investigators have not frequently examined alternative acquisition strategies such as spiral imaging that may be less sensitive to motion artifacts. Spiral imaging has been applied to rapid real-time applications including imaging of the coronary arteries.(14–16) However, there has been limited application of spiral trajectories to first-pass perfusion CMR.(17, 18) Spiral trajectories have other attractive features such as efficiency in traversing k-space, isotropic resolution and point-spread functions, and the lack of discrete ghosting resulting from motion. Spiral techniques also lend themselves to parallel imaging that could further reduce imaging time and improve temporal resolution.(19–21) Potential drawbacks include sensitivity to off-resonance and concomitant field gradients that can result in blurring and signal loss and to inconsistent data artifacts when the signal intensity varies between interleaves due to non-equilibrium magnetization. However, by careful consideration of the spiral trajectory readout duration and flip angle strategy we demonstrate that these effects can be abated to create high quality first pass myocardial perfusion images. The goal of this paper was to design and evaluate interleaved spiral pulse sequences for first pass myocardial perfusion imaging.
Methods
Pulse Sequence Design
Design Criteria
To design an optimal spiral pulse sequence for perfusion imaging, specific goals for resolution, timing, and SNR must be clearly defined. To have adequate spatial coverage to describe myocardial perfusion in the modified 16 segment AHA model of the LV (17 segment model with the apical cap excluded), data must be acquired at a minimum of three short-axis slices. These slices are ideally imaged each heart beat due to the rapidity of the first-pass of gadolinium.(22) Increases in heart rate during adenosine infusion, that are typically 20% of resting HR, must also be taken into account. For these reasons, our goal was to image rapidly enough to image 3 slice locations every heart beat at heart rates up to 110 BPM. At this rate, the RR interval is 546ms and thus the time to acquire each image must be less than 182 ms for 3-slice locations.
For clinical first pass perfusion sequences, in-plane spatial resolutions (Δx) generally range from 1.8–2.8 mm in the readout (RO) direction and 2.8–3.4 mm in the phase encoding (PE) direction.(6) A rectangular FOV and decreased resolution in the PE direction are typically utilized for Cartesian sampling to minimize the total number of lines of raw data that are needed. In spiral imaging the FOV is inherently isotropic, as is the spatial resolution. Isotropic in-plane resolutions of 2.2–3.1 mm2 (with resolution defined as 1/2kmax) correspond to the same voxel volumes as in the aforementioned Cartesian case with the same slice thickness. Our minimum goal was to have spatial resolution that is superior to current Cartesian pulse sequences.
Spiral Gradient Trajectory Design
Slew-limited spiral gradient trajectories were created using the using the optimal spiral design of Meyer et al.(21) Briefly, the process consists of specifying the desired number of interleaves, sampling time, number of points per trajectory, field of view (FOV), and maximum gradient and slew rate parameters to determine the desired k-space trajectory k(τ) = Aτ(t)e−iwτ(t). An algorithm that maximizes τ, and arbitrary function of time, for each subsequent k-space step subject to the above constraints is repeated until a desired number of gradient points are achieved. The actual spatial resolution of the trajectory is then determined by integrating the gradient trajectory to determine the maximal k-space location sampled. The same gradient trajectory design technique was used to create single-shot spiral trajectories to generate a field map with each image acquisition for the semi-automatic reconstruction.
There are two competing issues when considering the optimal sampling time for each interleaf for interleaved spiral pulse sequences. Longer readout times are more efficient and require fewer spiral interleaves to collect the k-space data, but they are more sensitive to off resonance blurring and signal losses. To balance between these competing factors, while achieving the desired temporal and spatial resolution described above, spiral trajectories with readout durations between 4–12 ms per interleaf were considered, yielding between 6–16 interleaves per image.
Pulse Sequence Design
The pulse sequence is shown schematically in Figure 1. A composite saturation pulse, consisting of a combination of 3 RF pulses and crusher gradients, was used.(23) While spectral-spatial excitation pulses are often employed for spiral imaging to only excite the water resonance, at 1.5T these pulses require at least 8 ms and are time prohibitive for this application, given the achievable number of spiral interleaves for the desired temporal and spatial resolution requirements. Instead, prior to data acquisition, a spectrally selective fat saturation pulse is applied. Then two single-shot spiral images with different TE’s are acquired that are used to obtain a field map for the semiautomatic off-resonance correction performed as part of the fast conjugate phase image reconstruction.(20,24) The TR for these single-shot spirals was kept similar to that of the spiral interleaves used for data collection. Next, Nint spiral interleaves are obtained in successive TR’s to create the perfusion image. The collection of the field map results in two additional TR’s plus the ΔTE (typically 1ms) between the field map acquisitions. Thus the time to collect a single data set is (Nint+2)*TR+ ΔTE. Figure 2 shows the minimum time for a single image including the time necessary for the fat-saturation pulse for slew-limited spiral trajectories with varying numbers of interleaves. When the total sampling time for each image is kept constant, and the TR is minimized given the readout time per interleaf, the total imaging time for a perfusion image is a non-linear function of the number of interleaves. Given our spatial and temporal resolution requirements, the optimal number of interleaves is approximately six.
Figure 1.

Pulse sequence schematic for the SR spiral perfusion pulse sequence. Following the SR pulse, a single fat-saturation pulse is applied followed by two single-spiral images for field map determination and then the interleaved spiral readout module.
Figure 2.

Minimum time to image one slice with a resolution of 2.16 mm, using an interleaved spiral pulse sequence with an additional 2 interleaves for field map acquisition, as a function of the number of interleaves. For a given total sampling time, there is an optimal number of interleaves in terms of minimizing the time to acquire data for each perfusion image due to the field map acquisition.
Saturation Recovery Time Considerations
The total time needed for data collection and the desired time to image each slice set a limit on the possible saturation recovery time (TS) that can be used. We define TS as the time from the saturation preparation to the first imaging RF pulse. The saturation recovery time is the major determinant of the degree of T1 weighting, and thus both the contrast and SNR of the resulting perfusion images. Assuming that the concentrations of gadolinium in the myocardium are 0.5–2.0 mmol/L, the expected T1’s should range between 100–300ms.(25) Given this range of T1’s, as well as our timing constraints, our TS must be in the range of 60–80 ms. As a point of reference, the time to the first RF pulse for FLASH and SSFP is generally 40 ms and for EPI is typically 50 ms.(6) This increase in TS should provide an SNR gain for spiral imaging.
Flip Angle Considerations
Among the potential problems with spiral perfusion imaging are inconsistent data artifacts if similar transverse magnetization is not available on each interleaf, as this could lead to periodic modulation of k-space, manifesting as swirling artifacts in image space.. Ideally the transverse magnetization would be the same for each spiral interleaf. To minimize this issue we derived an optimal constant flip angle (θc) that exactly balances the loss in magnetization from each RF pulse to the T1 recovery of magnetization during each TR for a given TR, TS, and T1 to insure similar transverse magnetization for each spiral interleaf. This flip angle is given by:
| (1) |
where E1=exp(−TR/T1) and Es=exp(−TS/T1). Table 1 shows the optimal constant flip angles as a function of the gadolinium concentration and saturation recovery time for a TR of 12 ms. Notably, this flip angle strongly depends on the chosen saturation recovery time, but is considerably less sensitive to the gadolinium concentration. This results in reasonably constant signal evolution over a wide range of T1 values as shown in Figure 3. As a point of reference, FLASH, EPI and SSFP typically have FA of 12, 25, and 50 respectively.
Table 1.
Optimal constant flip angles for Constant Signal Evolution
| [Gado] | T1 post | TS 40 ms | TS 60 ms | TS 80 ms | TS 100 ms |
|---|---|---|---|---|---|
| 0 mmol | 850 ms | 45° | 36° | 31° | 27° |
| 0.5 mmol | 292 ms | 44° | 35° | 30° | 26° |
| 1 mmol | 176 ms | 44° | 34° | 29° | 25° |
| 2 mmol | 98 ms | 42° | 32° | 27° | 22° |
Figure 3.
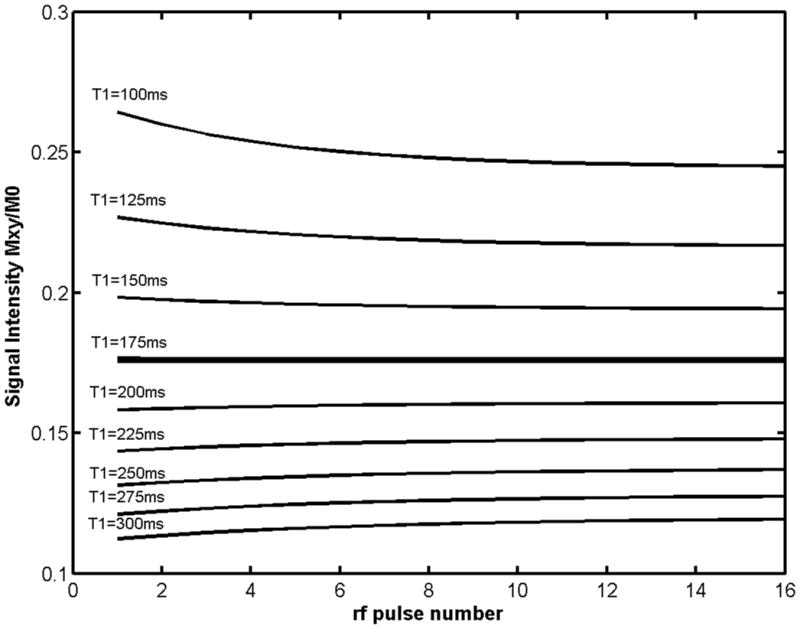
Simulated transverse magnetization curves as a function of RF pulse number for TS 80ms, TR 12 ms, and expected T1 of 175ms (corresponding to 1mmol concentration of Gd-DTPA) using the optimal constant flip angle of 29 degrees for these parameters. The signal evolution is nearly constant over the expected range of Gd-DTPA concentrations (0.5–2 mmol) corresponding to T1s of 100–300 ms.
SNR considerations
When the optimized flip angle for a given TS, TR, and T1 is used for the spiral pulse sequence the actual transverse magnetization (Mxy) following each RF pulse is Mxy=Mzsin(θc) where Mz is the transverse magnetization that recovers during TS. For a TR of 12ms, a gadolinium concentration of 2 mmol (corresponding to a T1 of 176ms) and saturation recovery times of 60–80 ms, the Mxy is approximately 0.25M0. For a gadolinium concentration of 2 mmol, the FLASH sequence will have an Mxy ~ 0.05M0, the EPI sequence will have an Mxy of ~0.15 M0, and the SSFP sequence will have a magnetization of roughly 0.23M0.(6) Thus the available transverse magnetization is greater for the spiral pulse than that of FLASH or EPI and should be comparable to that available with SSFP.
When comparing the SNR of interleaved spiral pulse sequences with the same total sampling time and spatial resolution, as a smaller number of interleaves is used, the TR must be increased due to the increased readout time per interleaf. This increased TR results in a higher optimal constant flip angle and thus a higher SNR. For interleaved spiral pulse sequences with total readout duration of 65ms and a spatial resolution of 2.18mm2, the theoretical SNR of a 4 interleaf pulse sequence would be 27% higher than the 8 interleaf pulse sequence, a the theoretical SNR for 16 interleaf pulse sequence would be 20% lower than the 8 interleaf pulse sequence. Thus from a SNR perspective a smaller number of spiral interleaves is advantageous.
Overall these considerations indicate that spiral pulse sequences should have SNR that is higher than that available with conventional Cartesian pulse sequences. This improved signal can be used to shorten acquisition time, improve off-resonance performance or increase spatial resolution.
Imaging Studies
All imaging studies were conducted on a 1.5T Magnetom Avanto (Siemens Healthcare, Erlangen, Germany). Resting spiral perfusion imaging was performed in 32 patients who were undergoing clinically ordered CMR studies with and without contrast under an IRB approved protocol. All patients signed informed consent. All of the patients had low likelihood of coronary artery disease, and none of the patients had wall motion abnormalities or evidence of myocardial scarring or fibrosis by delayed enhancement imaging. These subjects were chosen so that artifacts could be evaluated without interference from true perfusion abnormalities. Images were obtained at three slice locations during injection of 0.1 mmol/kg of gadolinium contrast agent via a peripheral IV at a rate of 4 mL/sec. Fifty images were obtained at each slice position during first pass of the contrast agent.
Multiple interleaved spiral pulse sequences were implemented and evaluated. Common sequence parameters included TS of 80 ms, TE 1.0 ms, slice thickness (TH) 10 mm, FOV 320–340 mm depending on patient size. Twelve patients were imaged with a spiral pulse sequence with 8 interleaves with a readout time of 8.1 ms and a spatial resolution of 2.18mm2, that served as the reference pulse sequence. To evaluate the effects of readout duration on image quality, 8 subjects were imaged with pulse sequences with the same spatial resolution but shorter (6.5ms 10 interleaves, N=4) or longer (10.8ms, 6 interleaves, N=4) readout times. For these experiments the spatial resolution and total data collection time were held constant between pulse sequences. To evaluate the effects of image resolution with a fixed readout time, 10 subjects were imaged with a spatial resolution of 2.63mm2 with a spiral pulse sequence with 6 interleaves. In this experiment the readout duration was matched to that of the 8-interleaved pulse sequence so that off-resonance performance would be similar. As the 6-interleaf sequence has a lower spatial resolution it should have a higher SNR, but this effect is partially offset by the decreased total data sampling time. The readout duration for the field map was matched to that of the corresponding pulse sequence. This yielded field map resolutions of 10mm for the 10 interleaved pulse sequence, 8.7mm for the 8 interleaved pulse sequence (and low resolution 6-interleave pulse sequence) and 7.2 mm for the 6 interleaved pulse sequence.
Images were reconstructed on-line on the scanner with a semi-automatic reconstruction based on Chebyshev approximation of the off-resonance phase term determined from the low resolution field map collected with each perfusion image.(20) This reconstruction method is computationally efficient and simultaneously corrects for B0 inhomogeneity and concomitant gradient field effects.
For all studies the SNR was measured on each image in an ROI placed in the LV cavity, septal myocardium, and background noise. The SNRs at maximal LV and myocardial enhancement were recorded for each slice, and averaged over the three slice positions. The mean SNRs of the LV cavity and myocardium for each of the above pulse sequences were compared using one-way ANOVA. The CNR of the myocardium for the above pulse sequences were compared using one-way ANOVA.
For the reference pulse sequence (8 interleaves), normalized upslope of the myocardial time intensity curves was determined by measuring difference in signal intensity prior to contrast arrival in the myocardium and the peak signal intensity in the myocardium and dividing by the baseline myocardial signal. This was then divided by the number of frames from the beginning of the upslope to the peak myocardial signal intensity.
All image series were evaluated for blurring, dark-rim, and signal dropout artifacts (graded as 1-mild, 2-moderate, 3-severe). Image quality was graded on a 5-point scale (1-excellent, 5-poor) independently by two cardiologists. The image quality scores were compared using one-way ANOVA. The proportion of image series corrupted with blurring, dark-rim and signal dropout were compared using z-tests corrected for multiple comparisons.
Results
Figure 4 demonstrates first-pass perfusion images at 3 slice positions from one subject using the 8-interleaf pulse sequence; the images have high SNR and minimal dark-rim or off resonance artifacts. Figure 5 shows time-intensity curves normalized to the baseline signal from the LV cavity and the myocardium of the mid-ventricular images in this subject. The SNR of the LV cavity and myocardium for the 6, 8, and 10 interleaf pulse sequences with 2.18mm resolution were 54.7 ± 13.6 and 22.0 ± 5.6, 52.6 ± 13.7 and 21.3 ± 4.2, and 38.5 ± 6.2 and 13.6 ± 3.5 respectively. There was no difference between the pulse sequences in peak SNR in the LV cavity (p=0.16) or myocardium (p=0.13). However the SNR on the 10 interleaf pulse sequence had lower point estimates of SNR in the LV cavity and myocardium as expected from the theoretical predictions. The contrast to noise ratios for the myocardium for the 6, 8, and 10 interleaf pulse sequences were 13.9±3.7, 14.3±3.2, and 10.3±4.0. There was no significant difference in CNR between these pulse sequences (p=0.11). The average upslope normalized to the baseline signal intensity for the 8 interleaf pulse sequence was 15±3%/frame. The average image quality scores for the 6, 8, and 10 interleaf pulse sequences were 1.57, 1.31, and 1.67 respectively (p=0.40). The 6 interleaf pulse sequences had the least dark-rim artifacts (10% of images with mild DRA), but 23% of the images had mild blurring, and 40% of the studies had some signal dropout due to the reduced off resonance performance of this pulse sequence (10.8 ms readout per interleaf). Dropout artifacts occurred primarily in the inferolateral wall where there are large susceptibility differences due to the proximity of the heart, to the lung and liver in this region. The 10 interleaf pulse sequence had the least blurring (6% of images) and few dropout artifacts (6% of images). However, the 10 interleaf pulse sequence had a greater number of images (40%) with at least mild dark-rim artifact. The 8 interleaf pulse sequence had less dropout artifact and blurring than the 6 interleaf sequence, likely due to the reduced readout duration, but had more studies with DRA. The proportion of image slices with dropout artifacts was significantly lower for the 8 (p<0.05) and 10 (p=0.05) interleaf pulse sequences as compared to the 6 interleaf pulse sequence. Figure 6 shows typical images from different subjects from the 6, 8, and 10 interleaf pulse sequences respectively.
Figure 4.
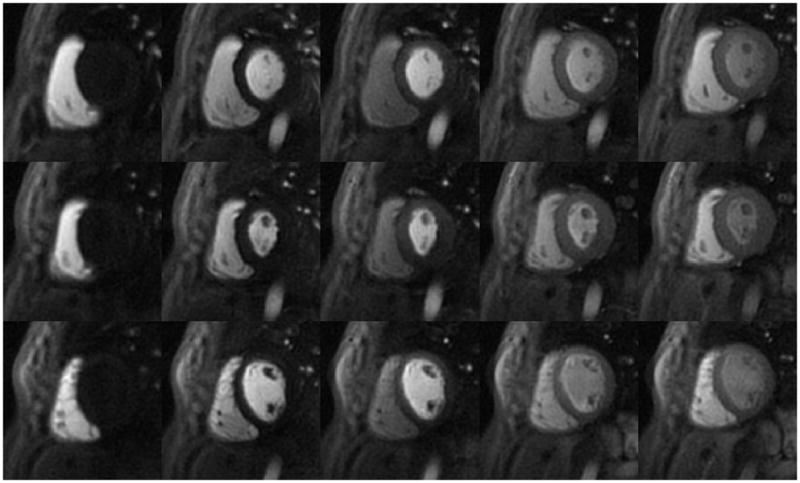
First-pass perfusion images using the 8-interleaved spiral pulse sequence (every 5th image shown through first pass). The images have minimal artifacts and high SNR.
Figure 5.

Time intensity curves from 6-segments of the mid-ventricular slice of the subject in figure 4. These curves have been normalized to the baseline signal intensity as a proton density map was not collected for intensity normalization.
Figure 6.
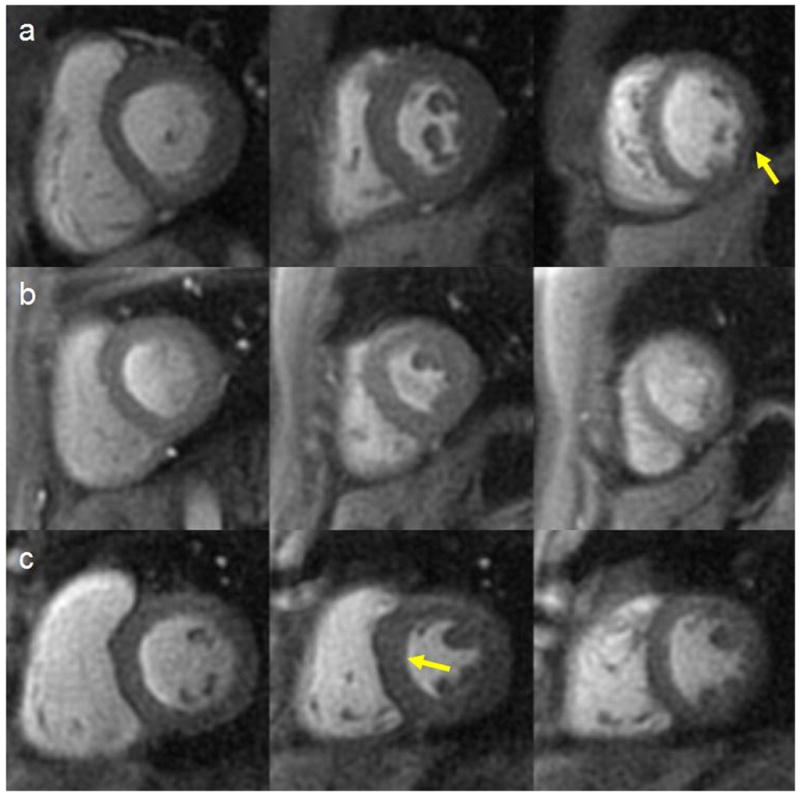
Example images from base, mid and apex from (a) 6, (b) 8, and (c) 10 interleaved pulse sequences. There is mild signal dropout on the 6 interleaf pulse sequence and a mild DRA on the 10 interleaf pulse sequence images.
For the resolution experiment, the SNR of the LV cavity and myocardium for the 6 interleaf pulse sequence with 2.63 mm2 resolution were 61.4 ± 17.6 and 22.0 ± 5.6 respectively, that was not different than that of the reference pulse sequence. Furthermore, the average image quality score was 1.57 that was worse than that of the reference pulse sequence primarily due to a high number of images with dark-rim artifacts. The increased number of images with at least some dark-rim artifact supports that concept that some of the dark-rim artifact is likely explained by Gibbs-ringing due to the lower image resolution of this perfusion imaging pulse sequence. Figure 7 shows typical images from the low-resolution 6 interleaf pulse sequence and the 8 interleaf pulse sequence with the same readout duration.
Figure 7.
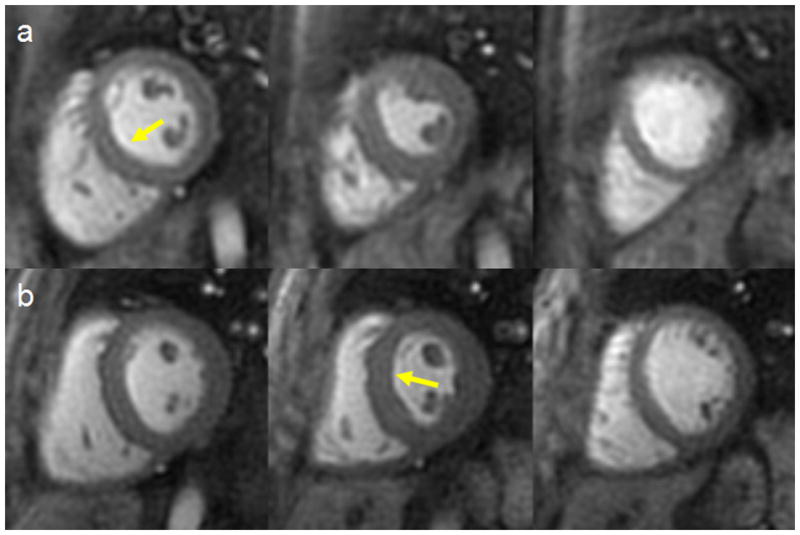
Example images from base, mid and apex obtained with (a) the 6 interleaf pulse sequence (resolution 2.63mm2) and (b) the 8 interleaf pulse sequence (resolution 2.18mm2) with the same readout duration (8.1 ms/interleaf). The 6 interleaf pulse sequence shows a mild DRA in the basal slice and the 8 interleaf sequence shows a mild DRA in the mid slice.
To look at the effect of the bolus passage on the off-resonance frequency, the low resolution field maps from the 8-interleaved pulse sequences were reconstructed. Large shifts in the mean off-resonance frequency occurred primarily when the bolus was passing through the right and left ventricular cavities. For the left ventricular cavity these shifts were typically around 20 Hz over the 3–5 images of the peak bolus passage through the left ventricle. The mean field shift in an ROI placed over the ventricular cavity from all slices analyzed was −22±4Hz, however, there was a clear spatial variation over the region of interest. Given the resolution of the field maps, ROI analysis was not feasible within the myocardium.
Discussion
We demonstrate that optimized slew-limited spiral trajectories are capable of producing high-quality first-pass perfusion images. To the best of our knowledge, this is the first full application of spirals to CMR perfusion imaging. These images have superior spatial resolution compared to current clinical perfusion protocols with adequate SNR. The temporal resolution of these pulse sequences, even without the use of parallel imaging, would enable imaging of 3 slice positions at heart rates up to 110 BMP that may be encountered during adenosine or regadenoson stress testing.
Through careful design, potential spiral artifacts have been largely eliminated. To minimize off-resonance artifacts short readout durations per interleaf were used. Off-resonance artifacts increased with increasing readout times in the range of 6–11ms. To minimize dropout and blurring artifacts, particularly in the inferolateral wall, the readout duration per interleaf should be kept to less than 8 ms. Artifacts in this region could potentially be lessened by performing a localized shim prior to the perfusion imaging study. In some cases, there appears to be mild blurring artifacts during contrast passage through the right ventricle, but this was not evident when the contrast bolus traverses the left ventricular cavity. Analysis of the field maps demonstrated significant shifts in off-resonance frequency within the left ventricle particularly during first pass of the bolus through the left ventricular cavity that were consisted with those seen by Ferreira et al. who measured field maps during first pass perfusion using a conventional gradient echo pulse sequence.(26) As the off resonance frequency is a function of the contrast dose, and the angle of the left ventricular cavity with respect to the main magnetic field, as well as patient specific anatomic factors, image quality will likely be improved by correcting off-resonance with field maps acquired during first pass of the contrast agent. Potential spiral artifacts may have also been mitigated by the use of a reconstruction that corrects for both off-resonance and concomitant gradient fields that can result in image blurring.
To minimize inconsistent data-artifacts caused by varying magnitude of transverse magnetization we derived and applied a novel expression for a constant flip angle that should theoretically result in nearly constant transverse magnetization between interleaves for a saturation recovery pulse sequence. However, this flip angle will underestimate the flip angle needed for constant evolution of magnetization when inflow effects are considered. Assuming a normal myocardial perfusion of 1mL/min-gm tissue, only 0.02% of the voxel volume is replenished per TR thus inflow effects are negligible. However, for the LV cavity assuming a mid cavity velocity of 25cm/s, 30% of the voxel volume is replenished each TR and inflow effects will be significant. We simulated the evolution of the transverse magnetization in the LV cavity for a T1 of 100ms for the optimal flip angle and for a 15 degree flip angle, and measured the percent increase in signal between the first rf-pulse and the 5th rf pulse (half of the 8 interleaf acquisition). For the optimal flip angle there was a 13% difference in Mxy, while for the 15 degree flop angle there was a 26% difference. Thus, even though the evolution is not completely flat with the optimized flip angle, there is less variation in Mxy then there would be for a small flip angle. Additionally, the mean Mxy (over 10 rf pulses) was 68% higher in the case of the optimal flip angle. This strategy appeared to work well for spiral perfusion imaging, however other factors such as the interleaf order may also play a role in reducing inconsistent data artifacts.(27)
In terms of dark-rim artifacts, fewer interleaves and higher resolution resulted in fewer dark-rim artifacts. All of the dark-rim artifacts noted were subendocardial at all phases of the cardiac cycle. We have previously demonstrated that for Cartesian pulse sequences motion induced DRA typically appears as different locations within the myocardium at different phases of the cardiac cycle.(28) While this study did not enable us to separate the effects of motion and Gibbs-ringing, the increased number of DRA in the low-resolution experiment are consistent with a contribution of Gibbs-ringing to the DRA.
In our pulse sequence, we had adequate fat-saturation using a single spectral-saturation prior to the spiral readout. A previous study of spiral coronary artery imaging demonstrated a similar performance of a single spectral fat-sat pulse and spectral-spatial excitation.(29) Given the time constraints for perfusion imaging and our current number of spiral interleaves, spectral-spatial excitation would be time prohibitive. However spectral-spatial pulses may be feasible with parallel imaging where a fewer number of excitations would be needed.
This study has a few limitations. As this study was performed during a routine clinical examination, only a single perfusion study could be obtained in each subject. This precluded direct comparison of spiral and Cartesian pulse sequences in the same patient. For the same reason, only rest perfusion images could be obtained. However, the goal of this study was to evaluate potential artifacts that could be mistaken for true perfusion abnormalities. We only enrolled patients with a very low likelihood of having coronary artery disease, and performed resting perfusion studies so that any abnormalities seen in the images would be a result of artifact rather than resulting from perfusion abnormalities. Furthermore, clinical validation will be essential to determine how sensitive and specific these pulse sequences will be for detecting perfusion abnormalities. We are planning a more comprehensive study where these pulse sequences will be evaluated using cardiac catheterization as the gold standard. We did not perform a comprehensive evaluation of different off-resonance reconstruction methods and it is possible that a different reconstruction may further improve off resonance performance. T2/T2* effects resulting from compartmentalization of gadolinium within the myocardium were not considered, however the relatively short TE should minimize these effects. These effects however, may be significant for quantification of myocardial perfusion especially given the high doses of contrast employed in this study.
This is a preliminary study in the development of spiral-based perfusion pulse sequences; the sequences could easily be extended to parallel imaging using both spatial and/or temporal acceleration techniques. Variable density spirals may enable further shortening of the readout duration thus further improving off resonance performance, and can be used for apodization of the data with careful consideration of the density compensation function.(30) This could further reduce the appearance of dark-rim artifacts.
Conclusions
High quality perfusion images can be obtained using optimized interleaved spiral pulse sequences. The advantages of spiral trajectories for myocardial perfusion imaging include its data-collection efficiency and robustness to motion that enable the rapid collection of high-spatial resolution, high SNR images with minimal motion-induced artifacts. Multiple strategies where employed to overcome the inherent off-resonance limitations of spiral trajectories including minimizing readout duration per interleaf, fat-saturation, and off-resonance deblurring using field maps collected with each perfusion image. While the focus of this manuscript was to optimize sequences from the perspective of mitigating artifacts, additional studies will be needed to determine the conspicuity of perfusion abnormalities on spiral perfusion images. Validation studies in patients with known coronary artery disease will be essential to further assess and optimize the off-resonance performance of these sequences. Further developments such as the implementation of parallel imaging techniques may make this an ideal pulse sequences for stress myocardial perfusion imaging.
Table 2.
Image Artifact Comparison
| Score | %DRA | %Blurring | %Dropout | |
|---|---|---|---|---|
| 6 leaves (high res) N=5 | 1.5±0.4 | 10% mild 0% mod |
23% mild 0% mod |
20% mild 20% mod |
| 8 leaves (high res) N=12 | 1.3±0.5 | 17% mild 13% mod |
13% mild 1% mod |
6% mild 0% mod |
| 10 leaves (high res) N=5 | 1.7±0.6 | 20% mild 20% mod |
10% mild 0% mod |
3% mild 3% mod |
| 6 leaves (low res) N=10 | 1.6±0.4 | 35% mild 12% mod |
7% mild 5% mod |
17% mild 3% mod |
Acknowledgments
Funding Sources: 10SDG2650038, 5T32EB003841, NIH R01 HL079110, Siemens Medical Solutions
References
- 1.Lloyd-Jones D, Adams RJ, Brown TM, Carnethon M, Dai S, De Simone G, Ferguson TB, Ford E, Furie K, Gillespie C, Go A, Greenlund K, Haase N, Hailpern S, Ho PM, Howard V, Kissela B, Kittner S, Lackland D, Lisabeth L, Marelli A, McDermott MM, Meigs J, Mozaffarian D, Mussolino M, Nichol G, Roger VL, Rosamond W, Sacco R, Sorlie P, Stafford R, Thom T, Wasserthiel-Smoller S, Wong ND, Wylie-Rosett J. Heart disease and stroke statistics--2010 update: a report from the american heart association. Circulation. 121(7):e46–e215. doi: 10.1161/CIRCULATIONAHA.109.192667. [DOI] [PubMed] [Google Scholar]
- 2.Patel MR, Peterson ED, Dai D, Brennan JM, Redberg RF, Anderson HV, Brindis RG, Douglas PS. Low diagnostic yield of elective coronary angiography. N Engl J Med. 362(10):886–895. doi: 10.1056/NEJMoa0907272. [DOI] [PMC free article] [PubMed] [Google Scholar]
- 3.Klem I, Heitner JF, Shah DJ, Sketch MH, Jr, Behar V, Weinsaft J, Cawley P, Parker M, Elliott M, Judd RM, Kim RJ. Improved detection of coronary artery disease by stress perfusion cardiovascular magnetic resonance with the use of delayed enhancement infarction imaging. J Am Coll Cardiol. 2006;47(8):1630–1638. doi: 10.1016/j.jacc.2005.10.074. [DOI] [PubMed] [Google Scholar]
- 4.Di Bella EV, Parker DL, Sinusas AJ. On the dark rim artifact in dynamic contrast-enhanced MRI myocardial perfusion studies. Magn Reson Med. 2005;54(5):1295–1299. doi: 10.1002/mrm.20666. [DOI] [PMC free article] [PubMed] [Google Scholar]
- 5.Gerber BL, Raman SV, Nayak K, Epstein FH, Ferreira P, Axel L, Kraitchman DL. Myocardial first-pass perfusion cardiovascular magnetic resonance: history, theory, and current state of the art. J Cardiovasc Magn Reson. 2008;10(1):18. doi: 10.1186/1532-429X-10-18. [DOI] [PMC free article] [PubMed] [Google Scholar]
- 6.Kellman P, Arai AE. Imaging sequences for first pass perfusion --a review. J Cardiovasc Magn Reson. 2007;9(3):525–537. doi: 10.1080/10976640601187604. [DOI] [PubMed] [Google Scholar]
- 7.Storey P, Chen Q, Li W, Edelman RR, Prasad PV. Band artifacts due to bulk motion. Magn Reson Med. 2002;48(6):1028–1036. doi: 10.1002/mrm.10314. [DOI] [PubMed] [Google Scholar]
- 8.Arai AE. Magnetic resonance first-pass myocardial perfusion imaging. Top Magn Reson Imaging. 2000;11(6):383–398. doi: 10.1097/00002142-200012000-00007. [DOI] [PubMed] [Google Scholar]
- 9.Fenchel M, Helber U, Simonetti OP, Stauder NI, Kramer U, Nguyen CN, Finn JP, Claussen CD, Miller S. Multislice first-pass myocardial perfusion imaging: Comparison of saturation recovery (SR)-TrueFISP-two-dimensional (2D) and SR-TurboFLASH-2D pulse sequences. J Magn Reson Imaging. 2004;19(5):555–563. doi: 10.1002/jmri.20050. [DOI] [PubMed] [Google Scholar]
- 10.Schreiber WG, Schmitt M, Kalden P, Mohrs OK, Kreitner KF, Thelen M. Dynamic contrast-enhanced myocardial perfusion imaging using saturation-prepared TrueFISP. J Magn Reson Imaging. 2002;16(6):641–652. doi: 10.1002/jmri.10209. [DOI] [PubMed] [Google Scholar]
- 11.Epstein FH, London JF, Peters DC, Goncalves LM, Agyeman K, Taylor J, Balaban RS, Arai AE. Multislice first-pass cardiac perfusion MRI: validation in a model of myocardial infarction. Magn Reson Med. 2002;47(3):482–491. doi: 10.1002/mrm.10085. [DOI] [PubMed] [Google Scholar]
- 12.Kellman P, Derbyshire JA, Agyeman KO, McVeigh ER, Arai AE. Extended coverage first-pass perfusion imaging using slice-interleaved TSENSE. Magn Reson Med. 2004;51(1):200–204. doi: 10.1002/mrm.10663. [DOI] [PMC free article] [PubMed] [Google Scholar]
- 13.Plein S, Radjenovic A, Ridgway JP, Barmby D, Greenwood JP, Ball SG, Sivananthan MU. Coronary artery disease: myocardial perfusion MR imaging with sensitivity encoding versus conventional angiography. Radiology. 2005;235(2):423–430. doi: 10.1148/radiol.2352040454. [DOI] [PubMed] [Google Scholar]
- 14.Meyer CH, Hu BS, Nishimura DG, Macovski A. Fast spiral coronary artery imaging. Magn Reson Med. 1992;28(2):202–213. doi: 10.1002/mrm.1910280204. [DOI] [PubMed] [Google Scholar]
- 15.Yang PC, Meyer CH, Terashima M, Kaji S, McConnell MV, Macovski A, Pauly JM, Nishimura DG, Hu BS. Spiral magnetic resonance coronary angiography with rapid real-time localization. J Am Coll Cardiol. 2003;41(7):1134–1141. doi: 10.1016/s0735-1097(03)00079-2. [DOI] [PubMed] [Google Scholar]
- 16.Yang PC, Nguyen P, Shimakawa A, Brittain J, Pauly J, Nishimura D, Hu B, McConnell M. Spiral magnetic resonance coronary angiography--direct comparison of 1.5 Tesla vs. 3 Tesla. J Cardiovasc Magn Reson. 2004;6(4):877–884. doi: 10.1081/jcmr-200036180. [DOI] [PubMed] [Google Scholar]
- 17.Liu C-Y, Nayak KS. High Resolution and Extended Coverage in First-Pass Myocardial Perfusion Imaging using a Real-Time Imaging Platform. Proceedings ISMRM Workshop on Real-Time MRI. 2006 [Google Scholar]
- 18.Shin T, Sung K, Pohost GM, Nayak KS. Spiral first-pass myocardial perfusion imaging at 3 Tesla: Feasibility Study. Proceedings SCMR Eleventh Scientific Sessions. 2008 [Google Scholar]
- 19.Chen W, Meyer CH. Fast automatic linear off-resonance correction method for spiral imaging. Magn Reson Med. 2006;56(2):457–462. doi: 10.1002/mrm.20973. [DOI] [PubMed] [Google Scholar]
- 20.Chen W, Meyer CH. Semiautomatic off-resonance correction in spiral imaging. Magn Reson Med. 2008;59(5):1212–1219. doi: 10.1002/mrm.21599. [DOI] [PubMed] [Google Scholar]
- 21.Meyer CH, Hu P. Spiral parallel magnetic resonance imaging. Conf Proc IEEE Eng Med Biol Soc. 2006;1:369–371. doi: 10.1109/IEMBS.2006.259758. [DOI] [PubMed] [Google Scholar]
- 22.Thiele H, Plein S, Ridgway JP, Breeuwer M, Higgins D, Schuler G, Sivananthan M. Effects of missing dynamic images on myocardial perfusion reserve index calculation: comparison between an every heartbeat and an alternate heartbeat acquisition. J Cardiovasc Magn Reson. 2003;5(2):343–352. doi: 10.1081/jcmr-120019420. [DOI] [PubMed] [Google Scholar]
- 23.Oesingmann N, Zhang Q, Simonetti O. Improved saturation RF pulse design for myocardial first-pass perfusion at 3 Tesla. Journal of Cardiovascular Magnetic Resonance. 2004;6(1):373–374. [Google Scholar]
- 24.Chen W, Sica CT, Meyer CH. Fast conjugate phase image reconstruction based on a Chebyshev approximation to correct for B0 field inhomogeneity and concomitant gradients. Magn Reson Med. 2008;60(5):1104–1111. doi: 10.1002/mrm.21703. [DOI] [PMC free article] [PubMed] [Google Scholar]
- 25.Hsu LY, Kellman P, Arai AE. Nonlinear myocardial signal intensity correction improves quantification of contrast-enhanced first-pass MR perfusion in humans. J Magn Reson Imaging. 2008;27(4):793–801. doi: 10.1002/jmri.21286. [DOI] [PubMed] [Google Scholar]
- 26.Ferreira P, Gatehouse P, Bucciarelli-Ducci C, Wage R, Firmin D. Measurement of myocardial frequency offsets during first pass of a gadolinium-based contrast agent in perfusion studies. Magn Reson Med. 2008;60(4):860–870. doi: 10.1002/mrm.21723. [DOI] [PubMed] [Google Scholar]
- 27.Nishimura DG, Irarrazabal P, Meyer CH. A velocity k-space analysis of flow effects in echo-planar and spiral imaging. Magn Reson Med. 1995;33(4):549–556. doi: 10.1002/mrm.1910330414. [DOI] [PubMed] [Google Scholar]
- 28.Salerno MRW, Judd R, Kim R. Simulation of Banding Artifacts Resulting From Realistic Cardiac Motion During Single Shot Myocardial Perfusion Imaging. 10th Scientific Meeting of the Society of Cardiovascular Magnetic Resonance; 2007. [Google Scholar]
- 29.Bornert P, Stuber M, Botnar RM, Kissinger KV, Manning WJ. Comparison of fat suppression strategies in 3D spiral coronary magnetic resonance angiography. J Magn Reson Imaging. 2002;15(4):462–466. doi: 10.1002/jmri.10078. [DOI] [PubMed] [Google Scholar]
- 30.Salerno MKC, Meyer CH. Myocardial Perfusion Imaging with Variable Density Spiral Trajectories. Proceedings of the 19th ISMRM; 2010. p. 3624. [Google Scholar]