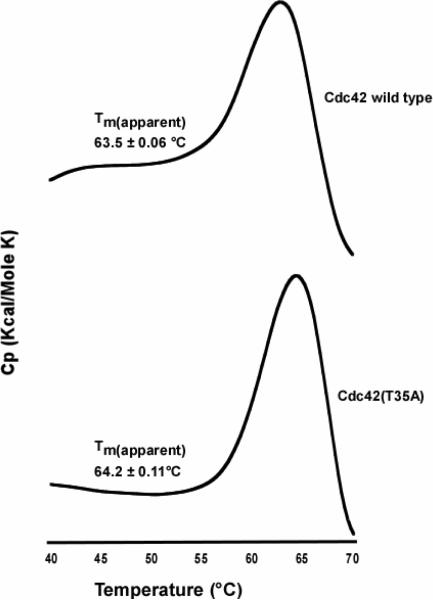
Figure 7.
Representative differential scanning calorimetry thermograms showing the unfolding of Cdc42 wild type (Top panel), and Cdc42(T35A) (Bottom panel). The Tm values are calculated from experiments done in triplicate for both proteins. The protein concentration for each protein was 1.0 mg/mL in buffer as described in the Methods section. Both thermograms were corrected for background noise, and each of the experiments (run in triplicate) were performed at a scan rate of 1.0 °C/min.

