Abstract
The reliable in-line monitoring of pharmaceutical processes has been regarded as a key tool toward the full implementation of process analytical technology. In this study, near-infrared (NIR) spectroscopy was examined for use as an in-line monitoring method of the paracetamol cooling crystallization process. The drug powder was dissolved in ethanol-based cosolvent at 60°C and was cooled by 1°C/min for crystallization. NIR spectra acquired by in-line measurement were interpreted by principal component analysis combined with off-line characterizations via X-ray diffraction, optical microscopy, and transmission electron microscopy. The whole crystallization process appeared to take place in three steps. A metastable form II polymorph of paracetamol was formed and transformed into the stable form I polymorph on the way to the growth of pure form I by cooling crystallization. These observations are consistent with a previous focused beam reflectance method-based study (Barthe et al., Cryst Growth Des 8:3316–3322, 2008).
Key words: crystallization, in-line monitoring, NIR, paracetamol, PAT, polymorph
INTRODUCTION
Paracetamol (or acetaminophen) is a widely used over-the-counter analgesic and antipyretic (http://en.wikipedia.org/wiki/Paracetamol). It is commonly used for the relief of headaches and other minor aches and pains. It is also a major ingredient in numerous cold and flu remedies. Paracetamol is known to have three polymorphs: stable form I (monoclinic), metastable form II (orthorhombic), and unstable form III (1). Below −120°C, the form II polymorph becomes more stable than form I. Among the polymorphs, the form II notably contains well-defined slip planes in the crystal structure, which would consequently facilitate direct compression for tablet manufacturing (2).
The selective production of a desired polymorph for paracetamol using polymeric heteronuclei was studied. A diverse library of commercial polymers and combinatorially cross-linked polymers was examined (3). Paracetamol was prepared by a laminar flow tubular crystallizer (LFTC) with rapid batch cooling. In a short run time, LFTC introduced smaller crystals in comparison to the batch crystallization process (4). Membrane crystallizers were used to control the evaporation rate, which modulates the supersaturation state during paracetamol crystallization (5). A good review regarding polymorphism in solution crystallization processes was found in the literature (6). The cooling temperature linearly affected the crystal size and the size distribution. This was probably a result of the change in the extent of supersaturation, which consequently modified the nucleation and crystal growth processes (7).
One of the key issues in pharmaceutical crystallization processes is a relatively poor reproducibility, which can be improved upon by new methodologies that allow more precise control. Recently, the FDA and other global agencies have encouraged the implementation of process analytical technology (PAT) as “a framework for innovative pharmaceutical development, manufacturing and quality assurance” (8,9). Since then, studies concerning in-line/on-line measurements of critical quality attributes using appropriate analytical tools have been a trend in both the pharmaceutical industry and academia.
Near-infrared (NIR) has been extensively studied for on-line/in-line monitoring of the crystallization processes of various active pharmaceutical ingredients (APIs). Roggo et al. (10) reviewed the combined application of NIR spectroscopy and chemometrics in pharmaceutical areas. NIR was applied to monitor the cooling crystallization and filtration of an API. It was used to analyze the phase transition based on the principal component regression technique, and it was concluded that NIR measurements were substantially helpful in understanding and optimizing complex crystallization processes (11). For example, the accelerated transformation between the three pseudo-polymorphs of azithromycin was studied employing NIR spectroscopy. Partial least square (PLS) calibration models were used for the qualitative analysis (12). NIR and Raman spectroscopy were used for in-line monitoring of the polymorphic transition during the fluidized motion of theophylline. The conversion was tracked via PLS regression and confirmed by X-ray diffraction (XRD) measurement and water content analysis (13). The concentration of etoricoxib in toluene solution prior to seeding was measured in-line by NIR. This method was successfully applied as a robust pilot process involving the detection of prematurely crystallized solids or bubbles before seeding (14). The solvent-mediated polymorphic transition (SMPT) processes of two APIs, taltirelin and timepidium bromide, were analyzed in situ by focused beam reflectance method (FBRM), Raman, and NIR spectroscopy. Contrary to FBRM and Raman, NIR was unsuitable as an in-line monitoring tool in this case because of the water and the low concentration of API (15).
In the literature, two types of studies were surveyed regarding the crystallization of paracetamol. These studies were the characterization of polymorphs and the monitoring of crystallization processes. For the former study, Fourier transform Raman spectroscopy was employed for a fast and simple quantitative analysis method of the polymorph mixtures in paracetamol powder. PLS models using an orthogonal signal correction algorithm had excellent prediction performance (2). Raman and Fourier transform infrared spectroscopy (FTIR) were reported as suitable for the quantitative determination of forms I and II in a powder mixture based on a linear correlation (16). Raman detected differential scanning calorimetry (DSC) was used to monitor the DSC thermodiagrams during the supercooling of paracetamol. When Raman and DSC were combined for characterization, thermally driven polymorphic transitions were assigned unambiguously (17).
Various monitoring studies of the paracetamol crystallization process are summarized below. Laser backscattering and attenuated total reflectance FTIR were applied to a seeded aqueous crystallization of paracetamol to measure solution concentration and chord-length distribution, respectively (18). In a continued study, the kinetic parameters of crystallization were estimated from the metastable zone width data (19). A cooling crystallization process was explored utilizing FBRM to detect the formation and transformation of the polymorphs in situ. Chord-length density functions were generated from the different shapes of form I and form II paracetamol crystals for quantitative and qualitative analysis. The presence of transient form II was clearly observed by FBRM (20).
As summarized above, there has been no successful application of NIR for the in-line monitoring of the solution crystallization of paracetamol. In this study, the whole process was investigated by NIR measurement and interpreted by principal component analysis (PCA). In particular, the transient formation phenomena of the form II and its swift conversion to form I was uniquely and reproducibly monitored by a PC score plot from PCA. Thus, it would be feasible to control the whole process as well as every unit step through NIR-based in-line monitoring for PAT implementation.
MATERIALS AND METHODS
Materials
Monoclinic paracetamol (USP grade, form I) was purchased from Sigma-Aldrich (St. Louis, MO, USA). The orthorhombic paracetamol (form II) was prepared by melt crystallization based on a previous literature report (21) where form I powder was melted at 200°C for 12 h and was cooled to room temperature. These two polymorphs were used as the standard reference materials (as form I and form II) after conforming by powder X-ray diffraction (PXRD) and DSC. All solvents used in this study were of high-performance liquid chromatography grade including ethanol (99.9%, Fisher Sci., Korea) and methanol (99.9%, Burdick & Jackson, Korea).
Crystallization Process
Paracetamol was crystallized in a solution by cooling. Our experimental conditions were similar to a previous study (20) but varied slightly in concentration and temperature. The cosolvent was a mixture of 5 mL of methanol with 95 mL of ethanol. Paracetamol (form I, 30 g) was dissolved in colsolvent (70 g) at 60°C. The crystallization began by cooling the resultant 100 mL paracetamol solution from 60°C to 10°C at a rate of −1°C/min. Thus, the whole process took 50 min. Throughout the cooling process, the solution was agitated at 400 rpm, and the solution temperature was precisely controlled using a coolant circulator (Eupharmtech C-E1, Korea) with a PID (Woojin WIDS-2, Korea) controller. For calibration, samples (3 mL) were taken at each of four designated time points. The sampling times were based on PCA results. The sampled solutions were immediately filtered under vacuum and dried at room temperature.
Near-Infrared Spectroscopy
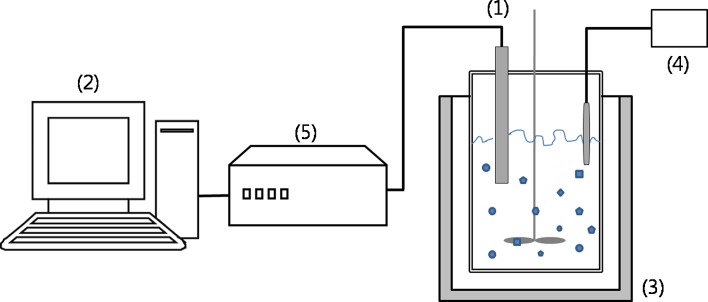
An FT-NIR spectrometer (FTPA 2000-260; ABB Bomem, Quebec, QC, Canada) equipped with a tungsten–halogen source and an InGaAs detector was employed for in-line monitoring. The experimental apparatus contained a fiber-optic probe that was connected to the NIR spectrometer, which is illustrated in Fig. 1. NIR spectra were collected in real-time during the entire crystallization process via a fiber-optic diffuse reflectance probe (FOCON FO; ABB Bomem). All NIR in-line spectra were continuously collected using the GRAMS/AI 7.00 software (Galactic Ind., Salem, NH, USA). Each spectrum was acquired by averaging 48 scans with a resolution of 64 cm−1 and over the range of 4,000–14,000 cm−1. The acquisition of a full spectrum took approximately 6 s. The spectral preprocessing and PCA was performed using the PLSplus/IQ program provided with the GRAMS/AI 7.00 software.
Fig. 1.
Experimental apparatus: (1) NIR fiber-optic probe, (2) computer system, (3) crystallization reactor bath, (4) PID temperature controller, and (5) NIR detector
Characterization of the Paracetamol Powders
Powder XRD (Rigaku MiniFlex, Japan) analysis was performed to differentiate the two polymorphs, form I and form II. The diffractometer used Cu Kα radiation (λ = 1.54 Å) at an acceleration voltage of 30 kV and a current of 15 mA. The samples and reference powders were scanned from 5° to 40° of 2θ with a step size of 0.01°. Each sample was mounted onto an aluminum plate holder and measured in triplicate. The differentiation of two polymorphs was confirmed by differential scanning calorimetry (DSC Pyris1, Perkin-Elmer, USA) measurements. Approximately samples of 5 mg each (form I, form II, sample 1, and sample 2) were heated from 50°C to 200°C at 10°C/min under nitrogen atmosphere. Optical microscopy (Leetech IMS-2M-345, Korea) analysis was carried out to measure the morphology and particle size of the paracetamol powders. Each specimen was dispersed in pentane prior to microscopic observation. Transmission electron microscopy (TEM; Philips CM-30, the Netherlands) was performed at an accelerating voltage of 50–300 kV to enable identification of the transient phase (form II) by electron diffraction patterns.
RESULTS
Characterization of the Paracetamol Polymorphs
The paracetamol form I (purchased) and form II (synthesized) have distinctly different XRD patterns as shown in Fig. 2. In terms of peak position and peak intensity profile, two XRD patterns agree well with those reported in the literature (21). The three strongest diffraction peaks of form I and the largest peak of form II are quantified in Table I, which includes the Bragg angle and the I/Imax percent value. Because the peak at 24.03° for form II is in a distinguishable position from the peaks at 23.48 and 24.37° of form I, evidence of the transient polymorph (form II) was clearly detected by powder XRD analysis.
Fig. 2.
Powder XRD patterns for form I and form II of paracetamol
Table I.
Comparison of Forms I and II in Terms of Bragg Angle and I/I max Values
NIR In-line Monitoring
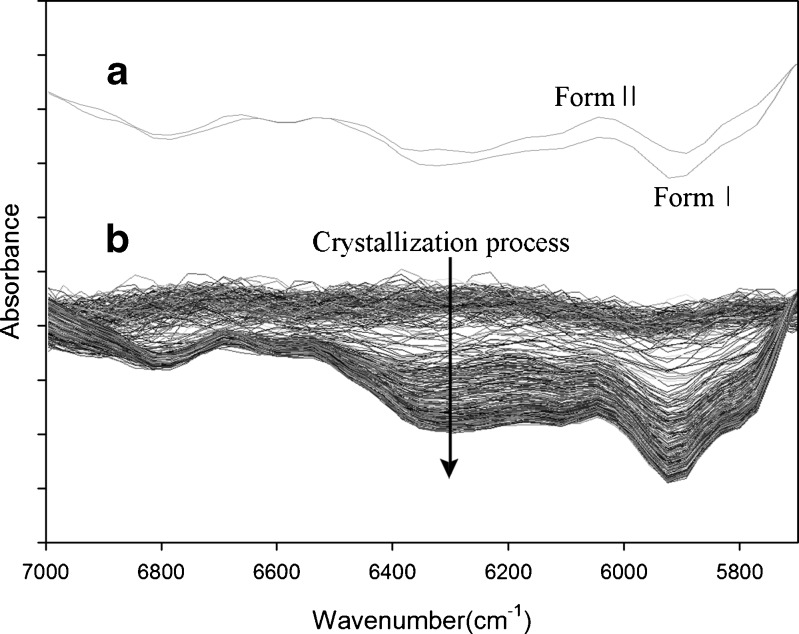
Figure 3a shows the typical NIR spectra of the two references powders. The second derivative method was used to preprocess each spectrum. As anticipated by the intrinsic characteristics of NIR spectroscopy, both spectra were highly reproducible. As illustrated by the figure, the two reference polymorphs are distinctly distinguishable in 6,400–5,700 cm−1 range, which became the spectral region of primary concern for this study.
Fig. 3.
a NIR spectra of form I and form II of paracetamol and b NIR spectra for the entire crystallization process
Figure 3b illustrates a typical example of the overall in-line NIR spectral variation during an entire crystallization process. All spectra underwent second derivative preprocessing, which effectively works to remove baseline offset effects. The crystallization proceeded in direction of the arrow. Spectra of the paracetamol solution at an earlier stage appear as a horizontal profile with some ripples. They change as the crystallization advances by a gradual cooling. NIR spectra at the bottom look similar to those seen for the form I reference powder.
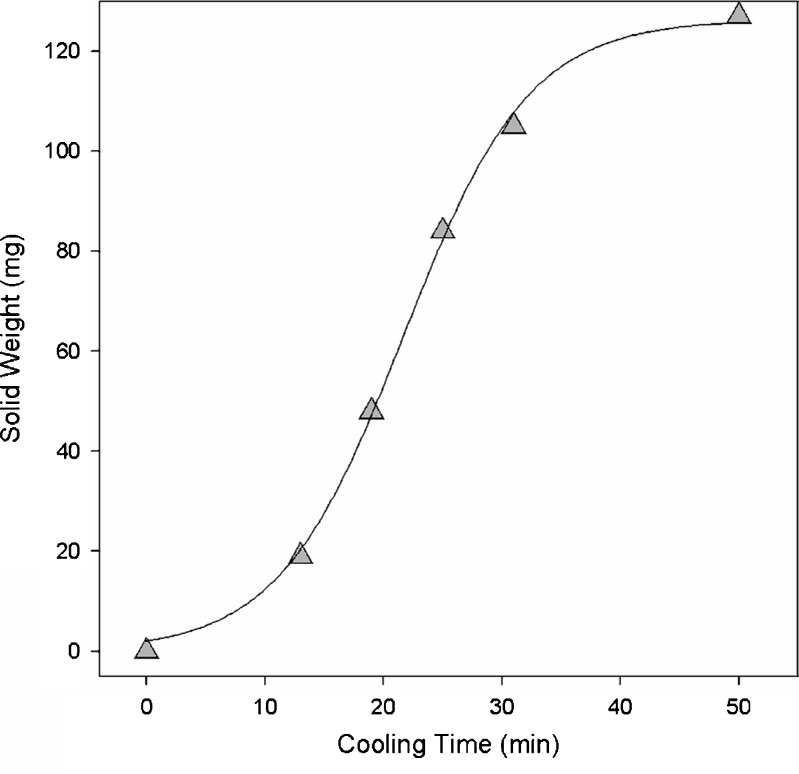
A plot of the powder weight variation versus the crystallization time is shown in Fig. 4. It appears as a typical nonlinear curve that is probably composed of three steps. The initial step seems to include a significant induction time. Although calibration samples were taken during the initial step at 15 min (T = 45°C), the solid content of paracetamol was too low to obtain any meaningful analytical results.
Fig. 4.
A plot of powder weight in the 3-mL sample solutions versus crystallization time
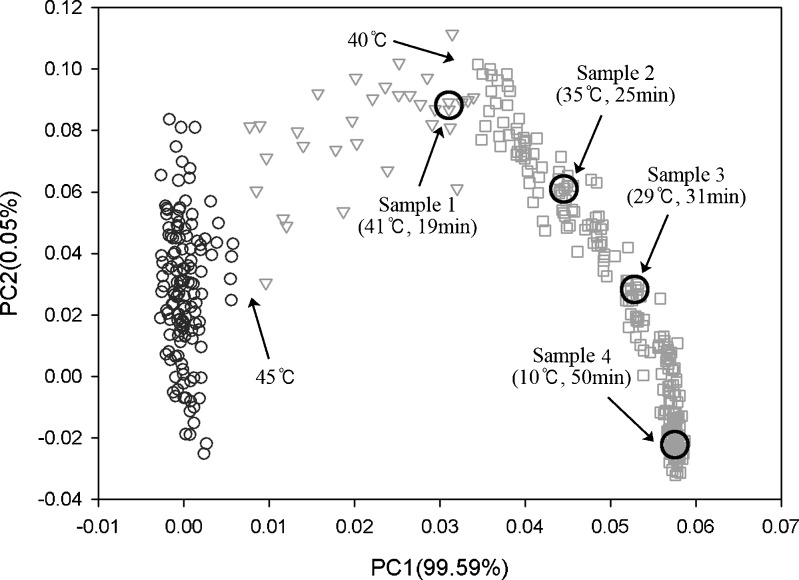
PCA was performed with the NIR spectra between 7,000 and 5,700 cm−1 in Fig. 3b, and the PC score plot for the entire process is presented in Fig. 5. Overall, the plot points followed a reversed U-shaped path as the crystallization proceeded. The starting point was on the bottom left while the end point was on the bottom right of the PC score plot. Samples were taken at four time points, 19 min (T = 41°C), 25 min (T = 35°C), 31 min (T = 29°C), and 50 min (T = 10°C). These samples were characterized by powder XRD, optical microscopy, and TEM for calibration. Principal component 1 (PC1) and PC2 describe 99.59% and 0.05% of the spectral variation, respectively.
Fig. 5.
A typical PC score plot for the entire crystallization process
Characterization for Off-line Calibration
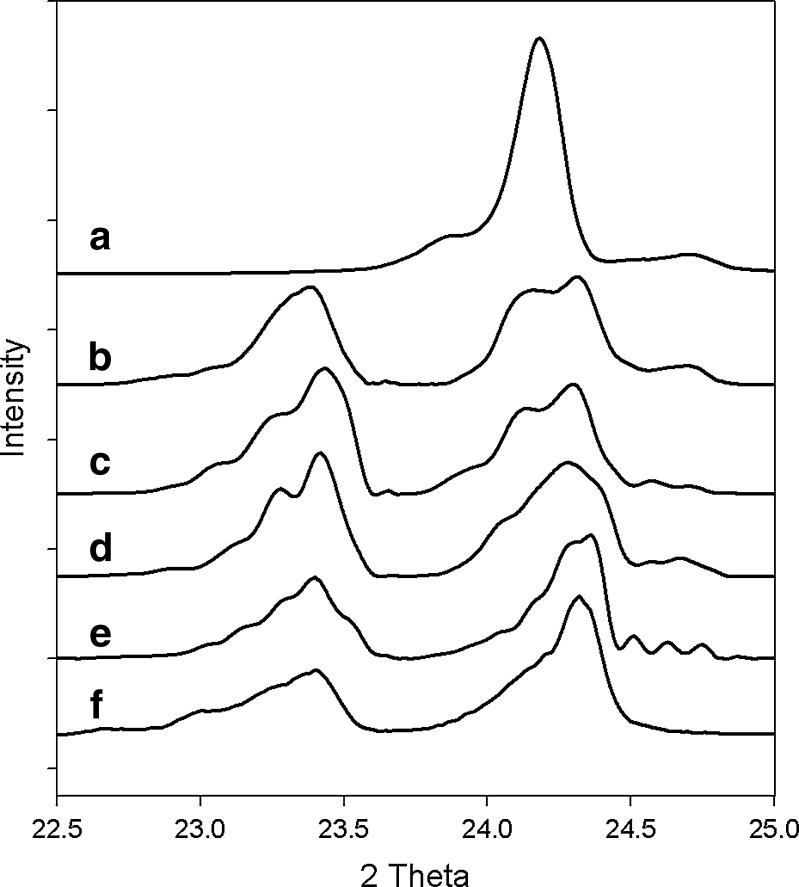
The powder XRD patterns of four samples are compared to the two reference paracetamol powders in the 2θ range of 22.5–25° (Fig. 6). The XRD patterns of the samples varied from Fig. 6b–e as the crystallization proceeded whereas Fig. 6a, f is pure form II and form I, respectively. The peak intensity scale was adjusted to facilitate comparative analysis. Therefore, a quantitative comparison between the patterns would not be useful.
Fig. 6.
Comparison of PXRD patterns of various paracetamol powders: a form II, b sample 1, c sample 2, d sample 3, e sample 4, and f form I
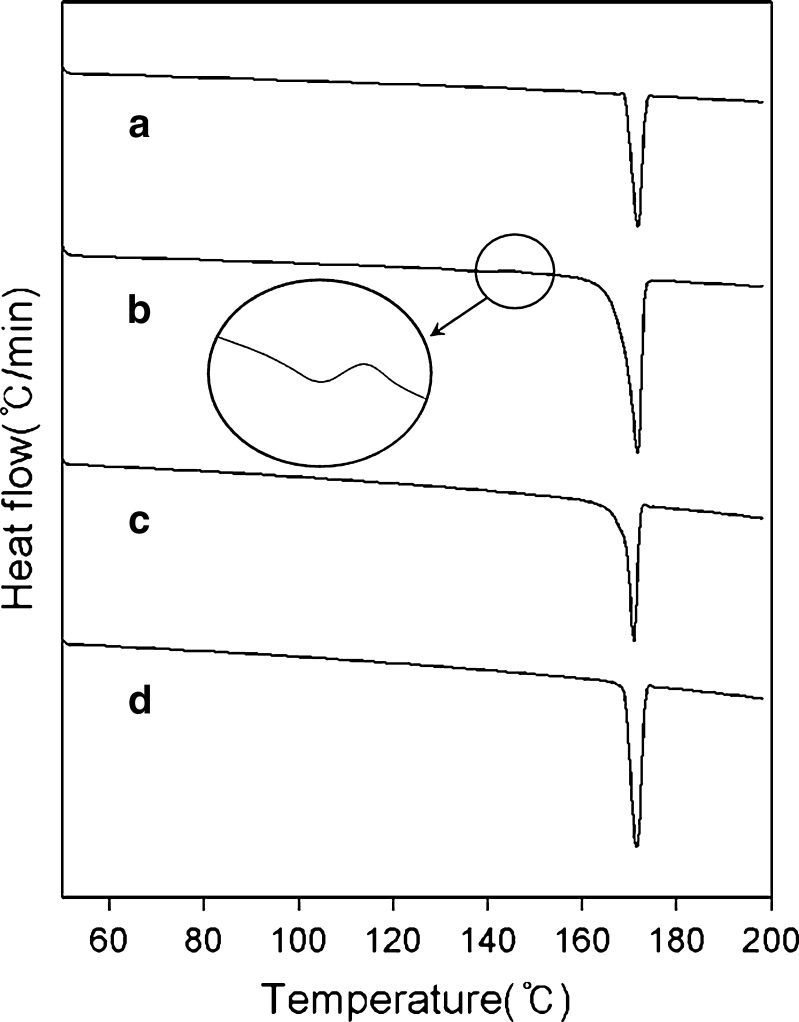
DSC curves of two samples are compared with two references in Fig. 7. As it was reported that DSC typically has not been informative for the studies of polymorphism in paracetamol especially when crystallized in solutions, there was no appreciable difference between references in terms of melting temperature. Nevertheless, the DSC curve of reference form II (Fig. 7b) is skewed to the left unlike that of form I, which is well concordant to a previous DSC study (22). The very small shoulder near 140°C in Fig. 7b was also observed as in the above article.
Fig. 7.
Comparison of DSC curves of various paracetamol powders: a form I, b form II, c sample 1, and d sample 2
Although there was no small shoulder at around 140°C, the shape of sample 1’s DSC curve (Fig. 7c) is skewed to the left similar to Fig. 7b that of form II. On the other hand, Fig. 7d is very like Fig. 7a. Unlike the form II, however, the sample 1 did not show an apparent small shoulder peak near 140°C. It seems to indicate that the sample 1 is not a pure form II but a mixture of form I and form II. According to the off-line characterizations via powder XRD and DSC, the sample 1 contains the transient polymorph form II whereas the sample 2 is very close to pure form I.
Figure 8 illustrates typical optical micrographs of various sample powders. As shown in Fig. 8a, sample 1 was a paracetamol powder with a particle size of 5–15 μm and was a mixture of octahedrons and rod-like particles. The rod-shaped particles imply the existence of the form II polymorph. As the cooling crystallization progressed, rod-like particles disappeared and the particle size was increased as seen in Fig. 8b, c. The size of some particles went beyond 40 μm in Fig. 8c.
Fig. 8.
Optical micrographs of paracetamol powders: a sample 1, b sample 2, and c sample 3
To provide proof for the existence of transient polymorph form II in the pathway to the formation of paracetamol form I, TEM analysis was performed to detect electron diffraction patterns of form II from sample 1. The result, however, was inconclusive due to unclear diffraction patterns.
DISCUSSIONS
Paracetamol was reported to undergo an SMPT from form II to form I (7). A recent FBRM-based study concluded that during the cooling crystallization of paracetamol, both forms I and II were nucleated initially. However, the form II polymorph was swiftly transformed into form I so that the crystals grown were pure form I (20).
In this study, the in-line NIR measurements were taken to monitor the cooling crystallization process of paracetamol, which included a polymorph transition. Based on a typical PC score plot as shown in Fig. 5, the entire process could be divided into three steps. The first step can be expressed as the upward movement of data points from the start to approximately 45°C (t = 15 min). The second step is a rather fast displacement from 45°C to 41°C lasting only 4 min. The third step constitutes a large part (31 min) of the process and lasts through the end of crystallization.
As illustrated in Fig. 6, sample 1 (19 min, 41°C) seems to contain a substantial portion of the form II polymorph. This observation was confirmed by an optical micrograph Fig. 8a. As the cooling crystallization proceeds further, the form II content gradually decreases. Although sample 3 (31 min, 29°C) still has a small shoulder for form II, sample 4 (50 min, 10°C) shows an XRD pattern almost identical to pure form I.
One notable characteristic of Fig. 6b–d is the relatively larger peak ratio (∼1) between 23.5° and 24.3° compared to the ration (0.6) found in the literature for the form I powder. This may be associated with sample amount measured by powder XRD. The amounts of three samples may have not been sufficient enough to construct a good randomly oriented powder specimen.
A more comprehensive interpretation can be made by combining above findings. The first 15-min step appears to correspond to the change of a sub-saturated solution to a supersaturated state by cooling in methanol–ethanol cosolvent. This explains the small quantity of solid contained in sample 1. A similar phenomenon was observed in a previous study where a noticeable precipitation started at approximately 40°C (20). The second step appears to be associated with the rapid nucleation of crystalline paracetamol. According to the previous study, forms I and II were nucleated together (20). This finding was supported by the optical micrograph in Fig. 8a as well as the powder XRD pattern of the sample 1 in Fig. 6b. The last step of the cooling crystallization of paracetamol was characterized by the transformation of form II to form I and then the subsequent crystal growth of pure form I. In terms of particle size, sample 1 ranged from 5 to 15 μm whereas sample 3 appeared to be 20–40 μm. This size observation is similar to previously reported results (20).
CONCLUSION
In this study, we have monitored the cooling crystallization process of paracetamol using in-line NIR spectroscopy. Based on the PC score plot and the off-line characterization by powder XRD, DSC, and optical microscopy, the whole process can be divided into three steps: (1) cooling to supersaturation, (2) simultaneous nucleation of forms I and II, and (3) SMPT of form II to form I and crystal growth. Our results are not only consistent with previously reported data but also demonstrate the potential of a fiber-optic in-line NIR spectroscopy combined with PCA to give rise to PAT implementation in pharmaceutical processes.
Acknowledgments
This work was fully supported by the 2010 Inje University Research Promotion Grant. In addition, we acknowledge the instrumental assistance from ABB for the in-line NIR spectroscopy.
References
- 1.Di Martino P, Conflant P, Drache M, Huvenne JP, Guyot Hermann AM. Preparation and physical characterization of form II and III of paracetamol. J Thermal Anal. 1997;48:447–58. doi: 10.1007/BF01979491. [DOI] [Google Scholar]
- 2.Kachrimanis K, Braun DE, Griesser UJ. Quantitative analysis of paracetamol polymorphs in powder mixtures by FT-Raman spectroscopy and PLS regression. J Pharm Biomed Anal. 2007;43:407–12. doi: 10.1016/j.jpba.2006.07.032. [DOI] [PubMed] [Google Scholar]
- 3.Price CP, Grzesiak AL, Matzger AJ. Crystalline polymorph selection and discovery with polymer heteronuclei. J Am Chem Soc. 2005;127:5512–7. doi: 10.1021/ja042561m. [DOI] [PubMed] [Google Scholar]
- 4.Mendez del Rio JR, Rousseau RW. Batch and tubular-batch crystallization of paracetamol: crystal size distribution and polymorph formation. Cryst Growth Des. 2006;6:1407–14. doi: 10.1021/cg060025v. [DOI] [Google Scholar]
- 5.Profio GD, Tucci S, Curcio E, Drioli E. Controlling polymorphism with membrane-based crystallizers: application to form I and II of paracetamol. Chem Mater. 2007;19:2386–8. doi: 10.1021/cm0701005. [DOI] [Google Scholar]
- 6.Mangin D, Puel F, Veesler S. Polymorphism in processes of crystallization in solution: a practical review. Org Proc Res Dev. 2009;13:1241–53. doi: 10.1021/op900168f. [DOI] [Google Scholar]
- 7.Al-Zoubi N, Kachrimanis K, Malamataris S. Effects of harvesting and cooling on crystallization and transformation of orthorhombic paracetamol in ethanolic solution. Euro J Pharm Sci. 2002;17:13–21. doi: 10.1016/S0928-0987(02)00129-X. [DOI] [PubMed] [Google Scholar]
- 8.US-DHHS, US-FDA. 2002. Pharmaceutical CGMPs for the 21st century: a risk-based approach; a science and risk-based approach to product quality regulation incorporating an integrated quality systems approach. http://www.fda.gov/oc/guidance/gmp.html.
- 9.US-DHHS, US-FDA, CDER/CVM/ORA . PAT—a framework for innovative pharmaceutical development, manufacturing, and quality assurance, pharmaceutical CGMPs. Washington, DC: US-DHHS, US-FDA, CDER/CVM/ORA; 2004. [Google Scholar]
- 10.Roggo Y, Chalus P, Maurer L, Lema-Martinez C, Edmond A, Jent N. A review of near infrared spectroscopy and chemometrics in pharmaceutical technologies. J Pharm Biomed Anal. 2007;44:683–700. doi: 10.1016/j.jpba.2007.03.023. [DOI] [PubMed] [Google Scholar]
- 11.Fevotte G, Calas J, Puel F, Hoff C. Application of NIR spectroscopy to monitoring and analyzing the solid state during industrial crystallization processes. Int J Pharm. 2004;273:159–69. doi: 10.1016/j.ijpharm.2004.01.003. [DOI] [PubMed] [Google Scholar]
- 12.Blanco M, Valdes D, Llorente I, Bayod M. Application of NIR spectroscopy in polymorph analysis: study of pseudo-polymorph stability. J Pharm Sci. 2005;94:1336–42. doi: 10.1002/jps.20362. [DOI] [PubMed] [Google Scholar]
- 13.Aaltonen J, Kogermann K, Strachan CJ, Rantanen J. In-line monitoring of solid-state transitions during fluidization. Chem Eng Sci. 2007;62:408–15. doi: 10.1016/j.ces.2006.08.061. [DOI] [Google Scholar]
- 14.Zhou GX, Crocker L, Xu J, Tabora J, Ge Z. In-line measurement of a drug substance via near infrared spectroscopy to ensure a robust crystallization process. J Pharm Sci. 2006;95:2337–47. doi: 10.1002/jps.20581. [DOI] [PubMed] [Google Scholar]
- 15.Kobayashi R, Fujimaki Y, Ukita T, Hiyama Y. Monitoring of solvent-mediated polymorphic transitions using in situ analysis tool. Org Proc Res Dev. 2006;10:1219–26. doi: 10.1021/op060046y. [DOI] [Google Scholar]
- 16.Al-Zoubi N, Koundourellis JE, Malamataris S. FT-IR and Raman spectroscopic methods for identification and quantitation of orthorhombic and monoclinic paracetamol in powder mixes. J Pharm Biomed Anal. 2002;29:459–67. doi: 10.1016/S0731-7085(02)00098-5. [DOI] [PubMed] [Google Scholar]
- 17.Kauffmana JF, Batykeferb LM, Tuschelb DD. Raman detected differential scanning calorimetry of polymorphic transformations in acetaminophen. J Pharm Biomed Anal. 2008;48:1310–5. doi: 10.1016/j.jpba.2008.09.008. [DOI] [PubMed] [Google Scholar]
- 18.Fujiwara M, Chow PS, Ma DL, Braatz RD. Paracetamol crystallization using laser backscattering and ATR-FTIR spectroscopy: metastability, agglomeration, and control. Cryst Growth Des. 2001;2:363–70. doi: 10.1021/cg0200098. [DOI] [Google Scholar]
- 19.Nagy ZK, Fujiwara M, Woo XY, Braatz RD. Determination of the kinetic parameters for the crystallization of paracetamol from water using metastable zone width experiments. Ind Eng Chem Res. 2008;47:1245–52. doi: 10.1021/ie060637c. [DOI] [Google Scholar]
- 20.Barthe SC, Grover MA, Rousseau RW. Observation of polymorphic change through analysis of FBRM data: transformation of paracetamol from form II to form I. Cryst Growth Des. 2008;8:3316–22. doi: 10.1021/cg800232x. [DOI] [Google Scholar]
- 21.Nichols G, Frampton CS. Physicochemical characterization of the orthorhombic polymorph of paracetamol crystallized from solution. J Pharm Sci. 1998;87:684–93. doi: 10.1021/js970483d. [DOI] [PubMed] [Google Scholar]
- 22.Boldyreva EV, Drebushchak VA, Paukov IE, Kovalevskaya YA, Drebushchak TN. DSC and adiabatic calorimetry study of the polymorphs of paracetamol. J Therm Anal Calorim. 2004;77:607–23. doi: 10.1023/B:JTAN.0000038998.47606.27. [DOI] [Google Scholar]


