Abstract
The aim of this work is to prepare tretinoin/dimethyl-beta-cyclodextrin complexes and fully characterize them through various analytical techniques. According to the phase solubility studies performed, the equilibrium for maximum complexation is reached in about 8 days presenting an AL-type diagram (soluble complexes) corresponding mainly to 1:1 stoichiometry (Ks = 13,600 M−1), although the possibility of the presence of 1:2 complexes was mathematically proven. Differential scanning calorimetry, X-ray diffraction and all the other analytical techniques have proven the presence of true complex formation in all the preparation methods tested. H-NMR and FTIR spectra allowed the selection of the best complexation method. The comparison between Raman spectra revealed that the more relevant feature is the band at 1,573 cm−1, which corresponds to the entire delocalization of the superconjugated system, and after inclusion is observed as a positive frequency shift. Based on these results and the data obtained by molecular modelling calculations, it is proposed that the structure of the drug included into the cyclodextrin corresponds to the side chain including the functional group COOH. The complex was also analysed by atomic force microscopy to determine its size distribution which was heterogeneous and polymodal. However, it could be observed that they all have the same phase constitution.
KEY WORDS: analytical methods, complexation methods, dimethyl-beta-cyclodextrin, stoichiometry complexes, tretinoin
INTRODUCTION
Topical retinoids are derivative products from vitamin A and are classified in three groups: non-aromatics—tretinoin and isotretinoin, monoaromatics—adapalen and polyaromatics—tazaroten. Tretinoin corresponds to the trans-retinoic acid form (C20H28O2) as shown in Fig. 1 (1,2).
Fig. 1.
Chemical structure of tretinoin
Retinoids are considered the first line treatment for acne, being also a maintenance therapy. However, the retinoids can irritate the skin and provoke sensitization to the solar exposition. A recent study with the retinoic acid/β-CD complex shows a significant increase of the effectiveness and tolerance to the acne vulgaris treatment, which will also increase the patients’ compliance to this treatment (3).
Concerning the chemical instability of retinoids, the retinoid degradation displays characteristics that are typical of radical reactions—catalysis by light, transition metals and free radical-producing substances and inhibition by free radical-quenching chemicals. The double bonds in the polyene chain of retinoids can undergo cis–trans isomerization, especially at positions 9, 11 and 13 of the molecule (4).
Cyclodextrins (CDs) are water soluble molecules and cyclic oligosaccharides composed of 6, 7 or 8 glucopiranose units (α-, β- or γ-CD, respectively) with a relatively hydrophobic central cavity and a hydrophilic outer surface (5,6).
There are many factors involved on the inclusion complex formation such as the molecule size, stereochemistry, electronic effects, temperature, pH and co-solvents. In this process, any covalent bond is formed or broken and its driving force is the enthalpy reduction with the water release from the CD hydrophobic cavity (7).
The α-CDs are usually complex with aliphatic hydrocarbons and gases; the β-CDs with small aromatic molecules, such as terpene derivatives or hydrocortisone, and γ-CDs can accept larger molecules, including vitamin D2 or other large organic molecules. The β-CD is widely used for pharmaceutical applications due not just to the appropriate size of its cavity, but also to its easy attainment and reasonable price (6).
The inclusion complex formation with many drugs presents several advantages, especially technological ones. Therefore, the main applications of CDs in drug topical administration could be: enhancement of drug release and/or permeation and consequently less necessary dose to reach the therapeutic effect; drug stabilization in formulation; reduction of the adverse effects, mainly the cutaneous irritation due to the lower quantity of free drug fraction; sustaining of drug release from vehicle; alteration of drug bioconversion in the viable skin; formulation of incompatible compounds; fixation of volatile compounds and improvement of the organoleptic properties and reduction of the quantity or absence of surfactants agents in emulsions. Regarding the CDs safety, a number of studies have been carried out to find safe and suitable permeation enhancers to promote subcutaneous absorption of drugs. The use of CDs as permeation enhancers has gained tremendous popularity over the past few years such as 2,6 dimethyl-beta-CD and hydroxypropyl-beta-CD (6,8–11).
The aim of this work is to prepare tretinoin/dimethyl-beta-cyclodextrin (DM-β-CD) complexes by different methods that can be applied to the industry and fully characterize them through various analytical techniques.
MATERIALS AND METHODS
Materials
Tretinoin was purchased from Fagron (Barcelona, Spain) and DM-β-CD (degree of substitution, 1.8) was a generous gift from Wacker (Munich, Germany). All other reagents were of analytical reagent grade.
Methods
Complex Preparation Methods
Co-evaporation
2,6-DM-β-CD (800 mg) was dissolved in 20 mL of deionized water and 184 mg of tretinoin in 200 mL of ethanol. The two solutions were mixed in a closed dark glass container and stirred with a magnetic stirrer at about 500–700 rpm, during 8 days. After that time, 40 mL of deionized water was added in order to precipitate the fraction of non-complexed drug, and the final solution was filtered through a syringe filter (12). The water removal and the powder complex form were obtained at 35°C (rotavapor Buchi R110, Flawil, Switzerland).
Freeze-Drying
2,6-DM-β-CD (800 mg) was dissolved in 20 mL of deionized water and 184 mg of tretinoin in 200 mL isopropanol. Both solutions were mixed during 8 days and finally filtered, as described before. Then, the final powder complex form was obtained by freeze-drying (freeze-dryer Christ, Alpha 1–4, B. Braun Biotech International, Allentown, PA, USA). Samples were previously frozen at −20°C and then dried at 0.0045–0.0070 mbar.
Spray-Drying
The initial complex preparation was similar as described before for the co-evaporation method. The water and ethanol mixture removal was performed at 80°C by spray-drying (spray-dryer Buchi, Flawil, Switzerland). The following conditions were used: flow rate = 5 mL/min, Tin = 80°C, corresponding to a Tout of approximately 60°C, compressed air at 600 L/h and the aspirator at 31.5 m3/h.
Kneading
Deionized water (0.267 mL) was added gradually to 800 mg of 2,6-DM-β-CD (1 water/3 CDs molar ratio) while mixing in a porcelain mortar, for 5 min, until a homogeneous viscous paste was obtained. Then 184 mg of tretinoin was added and mixed for 5–10 min. The paste obtained was dried at about 40°C for approximately 10 h followed by pulverization.
Complex Characterization
Phase Solubility Studies
Phase solubility studies were performed according to Higuchi and Connors method (13) using the Eq. 1. It consists of adding constant excesses of guest to increasing concentrations of CD solutions in water. After thermodynamic equilibrium is reached, changes in guest solubility (S) are plotted as a function of CD concentration. The stability constant (Ks) can be obtained from the slope and the intrinsic drug aqueous solubility (So).
 |
1 |
Aqueous (deionized water, pH = 5.5) solutions were prepared in an increasing gradient of DM-β-CD from a stock solution (35 mM), and an excess of tretinoin was added, in relation to its solubility, to each solution. The sealed vials were protected from light and shacked (125 rpm) in a thermostatic water bath at about 37°C until the equilibrium was reached (≈194 h). After that time, the samples were filtered out and assayed, by UV–VIS at 355 nm, for the tretinoin.
X-Ray Diffraction
X-ray diffraction (diffractor Bruker D8 Advance, Billerica, Massachusetts, USA) was operated according to the following conditions: 40 kV, 30 mA, between 5º and 40º (2 theta); 0.02º step and 5 s step time.
Differential Scanning Calorimetry
The temperature scale of the instrument (calorimeter MDSC 2920 model, TA Instruments Inc., New Castle, USA) had been previously standardized by taking the onsets of the fusion peaks of the five standards (n-decane (243.75 K), n-octadecane (301.77 K), hexatriacontane (347.30 K), indium (430.61 K) and tin (506.03 K). The heat flow scale was calibrated by measuring the enthalpy of fusion of indium (ΔHfus = 28.71 J g−1). The dried samples were weighed (3–5 mg; Mettler UMT2 ultra-micro balance, Columbus, USA) on aluminium pans which were sealed under air. Helium (Air Liquide N55) at a flow rate of 30 cm3 min−1 was used as the purging gas. All scans were performed in the range of 0–300°C at a heating rate of 5 K min−1.
Infrared Spectroscopy
The samples were prepared in KBr disks, and the spectra were recorded in the frequency range of 4,000–400 cm−1 using an IR spectrometer (FTIR Spectrophotometer Nicolet Impact 400, USA). The spectra peak positions were assigned with the help of OMNIC® software (OMNIC® software, Nicolet Corporation, WI, USA).
Proton Nuclear Magnetic Resonance Spectroscopy
The samples were dissolved in deuterium methanol. The spectra obtained from 400 MHz Ultrashield Proton NMR equipment (Massachusetts, USA) were analysed with Bruker TOPSPIN 1.2 software (16 scans).
Raman Spectroscopy
The Raman spectra of the solid samples, at 20°C, were recorded on a triple-monochromator Jobin-Yvon T64000 Raman system (0.640 m, f/7.5) with holographic gratings of 1,800 grooves mm−1. The premonochromator stage was used in the subtractive mode. The detection system was a liquid nitrogen-cooled non-intensified charge-coupled device. The 514.5 nm line of an argon laser (Coherent, model Innova 300, CA, USA) was used as excitation radiation, providing ca. 5 mW at the sample position, and a 90° geometry was used. The entrance slit was set to 200 μm, and the slit between the premonochromator and the spectrograph was opened to 13.2 mm. An integration time of 5 s and 20 to 30 scans were used in all the experiments. Samples were sealed in Kimax glass capillary tubes with an inner diameter of 0.8 mm. Under these conditions the error in wave numbers was estimated to be within 1 cm−1.
Molecular Modelling Approach
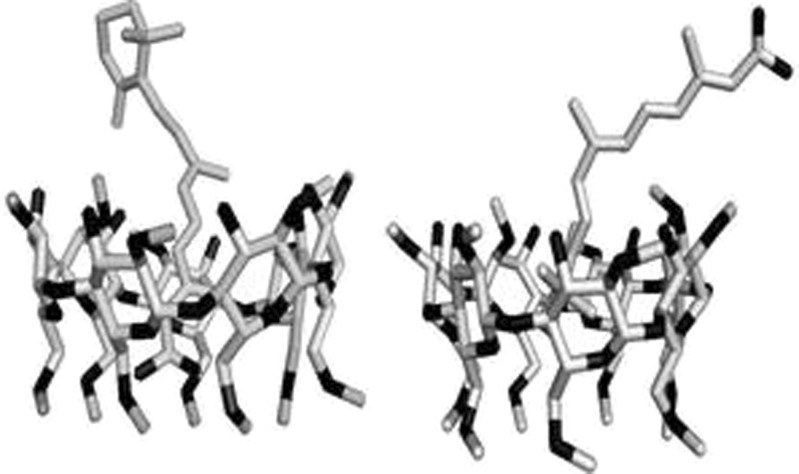
The geometries of 2,6-DM-β-CD and tretinoin molecules have been optimized by the use of density functional theory (14,15) with B3LYP hybrid functional (16,17) and the 3–21 G basis set using Gaussian 03 program package (Gaussian 03, Revision C.02, 2004; 18). Modelling was carried out by docking the geometrically optimized structure of tretinoin molecule into the 2,6-DM-β-CD cavity. The energy of the formed complexes was first minimized by using the Amber99 force field implemented in Molecular Operating Environment software package (19). These final (complex) structures were then geometrically optimized using the same level of energy that was used before to optimize the single molecules, and the complexation energies were calculated. Calculations with both drug orientations (with the ring of the drug directed to the cavity of CD and left outside of the cavity on the opposite direction) have been performed to identify the most stable complex. The electrostatic potential was calculated and mapped over a surface of constant electronic iso-density and was visualized with the aid of Molekel package. Figures 8, 9, 10 were built with PyMOL (20) and Molekel software (21). All the calculations were performed on iMed.UL and GIRM scientific clusters.
Fig. 8.
Molecular modelling of tretinoin/DM-β-CD complex (stable and unstable structure, respectively)
Fig. 9.
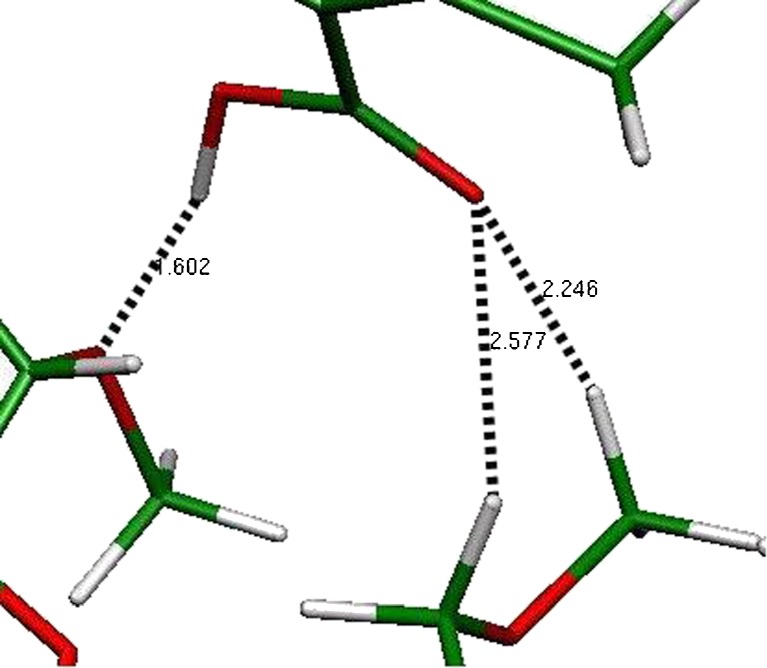
The length of possible links (hydrogen bonds) between the COOH group of drug and part of the CD cavity
Fig. 10.
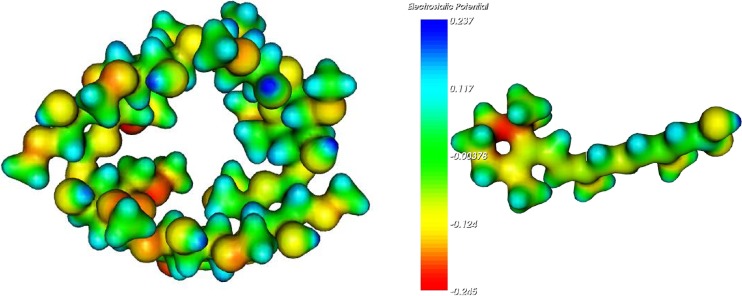
MEP of the stable complex in different perspectives
Atomic Force Microscopy
A NanoWizard II equipment (JPK Instruments, Berlin, Germany) mounted on the top of an Axiovert 200 inverted microscope (Carl Zeiss, Jena, Germany) was used for imaging the complexes. The atomic force microscopy (AFM) head is equipped with a 15-μm z-range linearized piezoelectric scanner and an infrared laser. The complexes were diluted to 1/500 in Milli-Q water and deposited on freshly cleaved muscovite mica for 20 min. After subsequent washes to remove the non-adherent complexes, the sample was allowed to dry out at room conditions. Imaging of the tretinoin/DM-β-CD complexes were performed in air tapping mode. Oxidized sharpened silicon tips (ACL tips from Applied Nanostructures, CA, USA) with a tip radius of 6 nm, resonant frequency of about 190 kHz and spring constant of 45 N/m were used for the imaging. The imaging parameters were adjusted to minimize the force applied on the scanning of the topography of the complexes. The scanning speed was optimized to 0.3 Hz, and the acquisition points were 512 × 512. The imaging data were analysed with the JPK image processing v.3 (JPK Instruments, Berlin, Germany). The width and the height of the complexes were calculated from the cross-section plots. All complex dimension measurements were performed using the Gwyddion software (Czech Metrology Institute, Brno, Czech Republic), version 2.19. The histograms of the structure width of each studied complex were constructed choosing the ideal bin size to achieve the best-fitted Gaussian model peak length. The selected binning size was 8.5 nm. The maximum values of the Gaussian peaks represent the different statistical measures of the width of the complexes.
RESULTS AND DISCUSSION
Phase Solubility Studies
According to the phase solubility studies, the complex formed is soluble, represented by an AL diagram (Fig. 2); in the absence of further information, it is usually assumed that it corresponds to a 1:1 stoichiometry complex.
Fig. 2.
Phase solubility study of tretinoin/DM-β-CD complex (n = 5; three replications, SD < 0.01518)
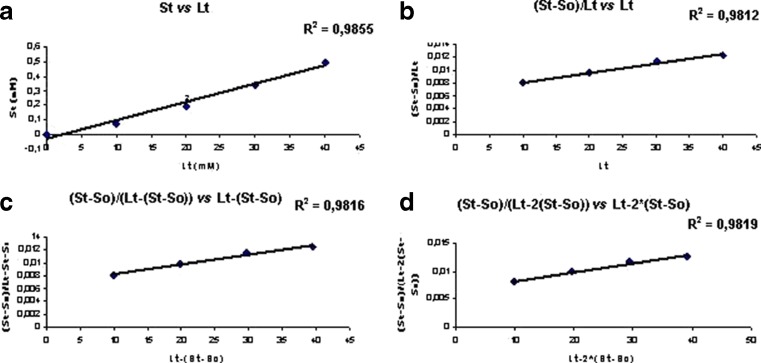
In another study, using the phase solubility results and fitting those to mathematical equations (13), it seems that a mixture of other complexes with both stoichiometries 1:1 and 1:2 could also be present (Fig. 3). This feature may be related to the existence of different inclusion modes or different geometries for the inclusion complexes (22).
Fig. 3.
Phase solubility studies of tretinoin/DM-β-CD complexes, where Lt (total ligand) is the concentration of DM-β-CD (mM) and St (total substrate) is the concentration of tretinoin (mM) considering different stoichiometries: a 1:1 stoichiometry, b mixture of 1:1 and 1:2 stoichiometries, c mixture of 1:1 and 1:2 stoichiometries but mainly 1:1 and d mixture of 1:1 and 1:2 stoichiometries but mainly 1:2
According to Fig. 2, the maximum complexation is reached at the 8th day and the complexation stability constant (Ks) can be considered slightly high and is about 13,600 M−1 (Eq. 1), as expected for very hydrophobic molecules which shape fits well into the cavity of the CD. The lipophilic character of retinoids provides the main driving force for their inclusion into the apolar CDs cavities (22). The literature refers complexation constant values in a wider range, from 100 to 20,000 M−1 (6). From the therapeutic point of view, it is more advantageous to obtain moderately stable complexes, in which there is an equilibrium between the complex and the free forms of CD and the drug (13,23,24).
The Ks was calculated according to the Eq. 1 and considering the 4th sample (Fig. 2) and the aqueous solubility (So) 1.06 × 10⁻⁶ M, was the average water solubility of drug determined experimentally in the absence of CD. The interception solubility (Sintercept) was not used because it corresponds to a negative Ks value. It is possible to obtain a negative interception with very insoluble drugs like tretinoin and/or in the presence of drug impurities and in the case of interaction between drug monomers, which would result in the decrease of the drug-free fraction to combine with the CD. According to Loftsson and Hreinsdóttir (25), this diagram corresponds to the AL− profile (Sintercept < So). These authors also pointed some limitations of obtaining the complexation constant by Higuchi and Connors method (13) and the associated error is higher when the drug solubility is low (So < 1 mg/mL), as is the case of tretinoin. According to the former authors, the Ks corresponds to a combination of several constants that describe various mechanisms of solubilization that coexist in a non-ideal system.
There are other methods to obtain the complexation constant described in the literature: potentiometric (26), electrophoretic, membrane permeation, molecular modelling (27), etc. Theoretically, there is no ideal method, and the one that best suits the complex type should be chosen. The Ks values for the same complex obtained by the different techniques differ because of the different experimental conditions that can influence the complexation process.
It is known that the pH of the medium influences the drug solubility and consequently the complex formation. According to Loveday and Singh (4), binding between retinoids and CD is most favourable at neutral pH. It is noteworthy that the present study was performed at about pH 5 which corresponds approximately to the tretinoin pKa (≈4). According to the literature (22), the association constants for the complexes of vitamin A (a similar molecule) with β-CD and DM-β-CD are log Ka = 3.54–3.77.
X-Ray Diffraction and Differential Scanning Calorimetry
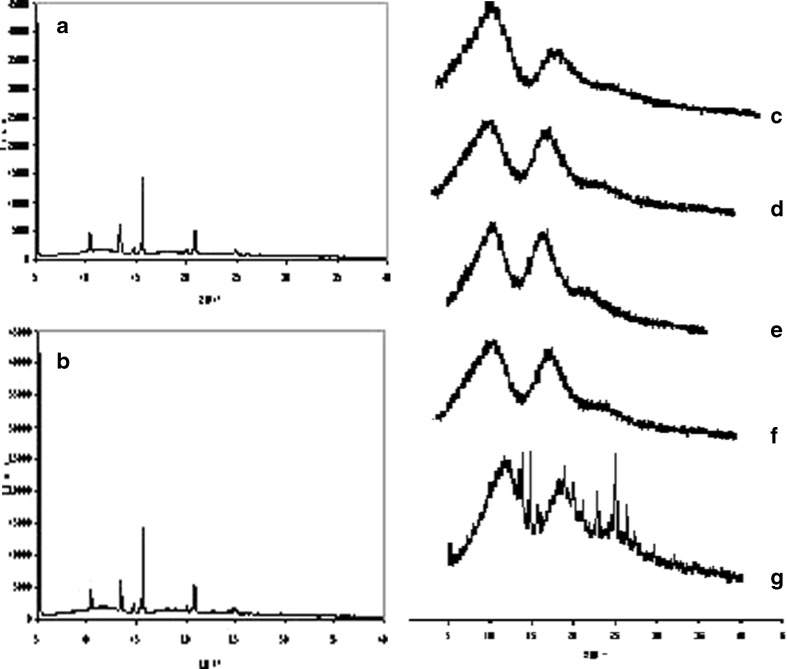
The results of both techniques may confirm the presence of a complex without free drug. The tretinoin peak disappeared in the complexed form (Figs. 4 and 5). Regarding the physical mixture diffractogram, it is similar to the tretinoin diffractogram because the tretinoin powder is more crystalline than CD and diffraction increases with crystallinity (Fig. 4). Montassier et al. (12) also used the scanning electron microscope and reported that tretinoin appears as long rectangular-shaped crystals, hydroxypropyl-beta-CD is amorphous and dimethyl-beta-CD is bulky and in the form of very well-defined lamellae.
Fig. 4.
Diffractograms of a tretinoin, b physical mixture, c DM-β-CD, d co-evaporated complex, e freeze-drying complex, f spray-drying complex and g kneading complex
Fig. 5.
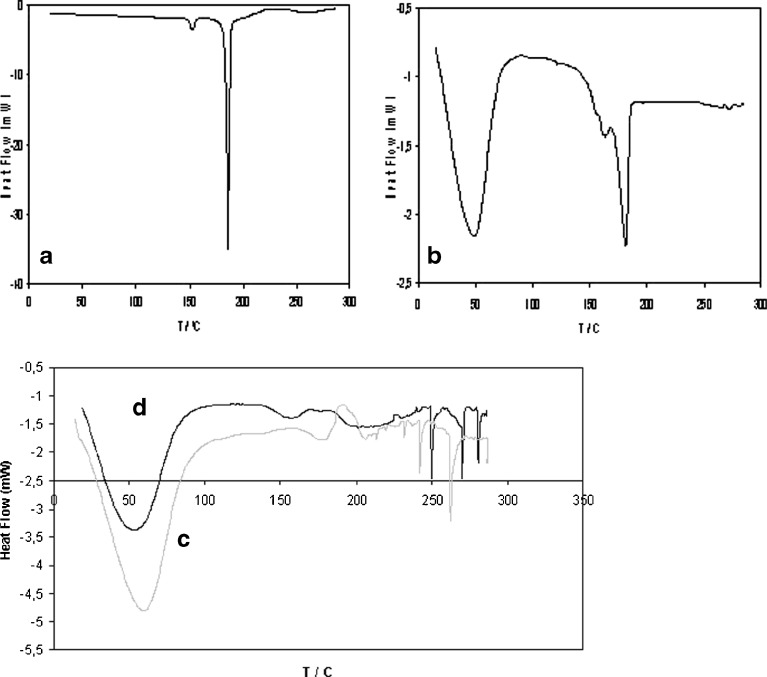
DSC thermograms of a tretinoin, b physical mixture, c co-evaporated complex and d kneading complex
The complex powder is more amorphous than the pure tretinoin, which presents peaks with higher intensity, as also observed by other authors (12). Indeed, the interactions between the drug and CD are non-covalent providing a lower stable complex structure and hence, the X-ray diffraction could be weak. The kneading complex diffractogram presents some characteristic drug peaks (for example, the peak at around 15° (2 theta)), probably because there is more drug-free fraction in this complex. It should be noted that the first peak of tretinoin diffractogram next to the Y-axis corresponds to the interference with the cell itself.
Differential scanning calorimetry (DSC) is a powerful qualitative analytical technique for the physico-chemical characterization of complexes, especially when coupled with other techniques. When guest molecules are included in CD cavities or a crystal lattice, their melting, boiling and sublimation points shift to different temperatures or disappear. The difference in energy input required to maintain the sample and reference at exactly the same temperature is plotted as a function of the sample temperature (28).
The physical mixture thermogram is obtained by the sum of both profiles (drug and CD), unlike the complex, as expected (Fig. 5). In this thermogram, there is an endothermic event at about 50°C corresponding to the water release by evaporation from the CD cavity and another endothermic peak at about 184.1°C, corresponding to the drug melting. When the sample is hygroscopic and the water is absorbed or weakly linked, the water release from the CD cavity may occur before 100°C, causing an extended peak. This was also obtained in the other study (12).
The drug peak disappears in all the complex thermograms (e.g. co-evaporation and kneading methods), which is a strong indication that drug complexation and/or amorphization really occurred. In addition, the thermograms showed other small peaks at about 250°C, approximately, which may be associated to the CD fusion/decomposition/fusion (12). Such results lead to assume that there is no association between the drug and CD when the two powders are just mixed, unlike when preparing the powder by the various techniques of complexation studied in this work.
FTIR, Proton Nuclear Magnetic Resonance, and Raman Spectroscopy
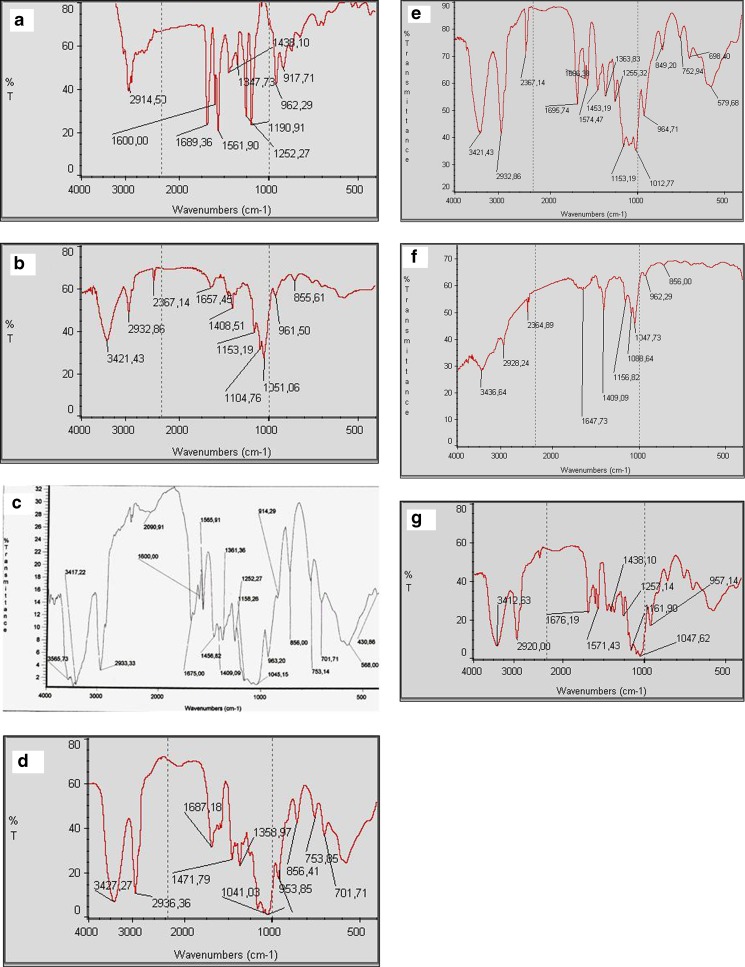
The interaction between the drug and the CD can be determined by FTIR and proton nuclear magnetic resonance (1H-NMR). FTIR spectra showed marked structural differences between pure components and the association complexes. The physical mixture spectrum is the overlap of the individual spectra of tretinoin and DM-β-CD. Some peaks of the tretinoin such as the peak around 1,200–1,250 cm−1 corresponding to COOH group vibrations, as shown in Fig. 6 and Table I, disappeared in the complexes spectra (12).
Fig. 6.
IR spectra (4,000–400 cm−1) of a tretinoin, b DM-β-CD, c physical mixture, d spray-drying complex, e freeze-drying complex, f co-evaporated complex and g kneading complex
Table I.
IR Peaks Correspondent to the Chemical Groups of DM-β-CD and Tretinoin
| DM-β-CD | Tretinoin | ||
|---|---|---|---|
| Peaks (cm−1) | Chemical Group | Peaks (cm−1) | Chemical Group |
| 1,080–1,150 | Ether C–O | 2,500–3,600 (3,000) + 1,200–1,250 | Carboxylic acid C=O–OH |
| 3,000–3,600 | Alcohol O–H | 1,620–1,680 | Alcene |
| 1,099 (1,104) | Pyrani C5O | ≈1,674 | Trimethyl/methylcyclohexene |
| 1,400–3,000 | Alcane C–C/methyl | – | – |
DM-β-CD dimethyl-beta-cyclodextrin
It is noteworthy that the peak 2,500–3,600 cm−1 for the same chemical group may be masked by the OH group’s wide peak of CD (3,000–3,600 cm−1). The co-evaporated complex spectrum is what most differentiates, suggesting greater inclusion within the CD cavity, especially by this part of the molecule (COOH). This spectrum showed a shift from 3,421.43 to 3,436.64 cm−1 of the band corresponding to hydrogen-bonded OH group. The intense bands that were observed in the physical mixture at about 1,700–1,500 cm−1 were also significantly reduced in this complex. This suggests that some of the existing hydrogen bonds formed between the OH groups on the narrow side of DM-β-CD might be broken after the formation of inclusion complexes. The difference of the various transmittance spectra is related to the KBr disk thickness analysed.
The interaction between tretinoin and DM-β-CD was further investigated by 1H-NMR (Table II).
Table II.
Chemical Shifts of H3, H5 and H2 Protons of DM-β-CD in the 1H-NMR Spectrum
| Sample | δ (ppm) | |Δ δ| | ||||
|---|---|---|---|---|---|---|
| H3 | H5 | H2 | H3 | H5 | H2 | |
| DM-β-CD | 3.940 | 3.825 | 3.629 | |||
| Physical mixture | 3.941 | 3.837 | 3.628 | 0.001 | 0.012 | 0.001 |
| Co-evaporated complex | 3.941 | 3.733 | 3.563 | 0.092 | 0.017 | 0.066 |
| Kneading complex | 3.931 | 3.816 | 3.501 | 0.009 | 0.009 | 0.128 |
| Freeze-drying complex | 3.939 | 3.826 | 3.605 | 0.001 | 0.001 | 0.024 |
1 H-NMR proton nuclear magnetic resonance spectroscopy, DM-β-CD dimethyl-beta-cyclodextrin
In the physical mixture, there were no significant deviations in the 1H-NMR chemical shift values, as expected. For the complexes, there was a greater difference in chemical shift values of H3 and H5 in the co-evaporated complex and, in contrast, a larger shift in H2 in the kneading complex, which is in agreement with the results obtained by other techniques used in this work.
These data evidenced that the presence of tretinoin induces upfield changes in the 1H-NMR chemical shift values for both the protons (H3 and H5) which are located inside of the CD cavity. These protons showed an upfield shift due to the shielding effect exerted by the guest molecule. This is consistent with the insertion of the drug inside the lipophilic void core of CD with the formation of an inclusion complex (5).
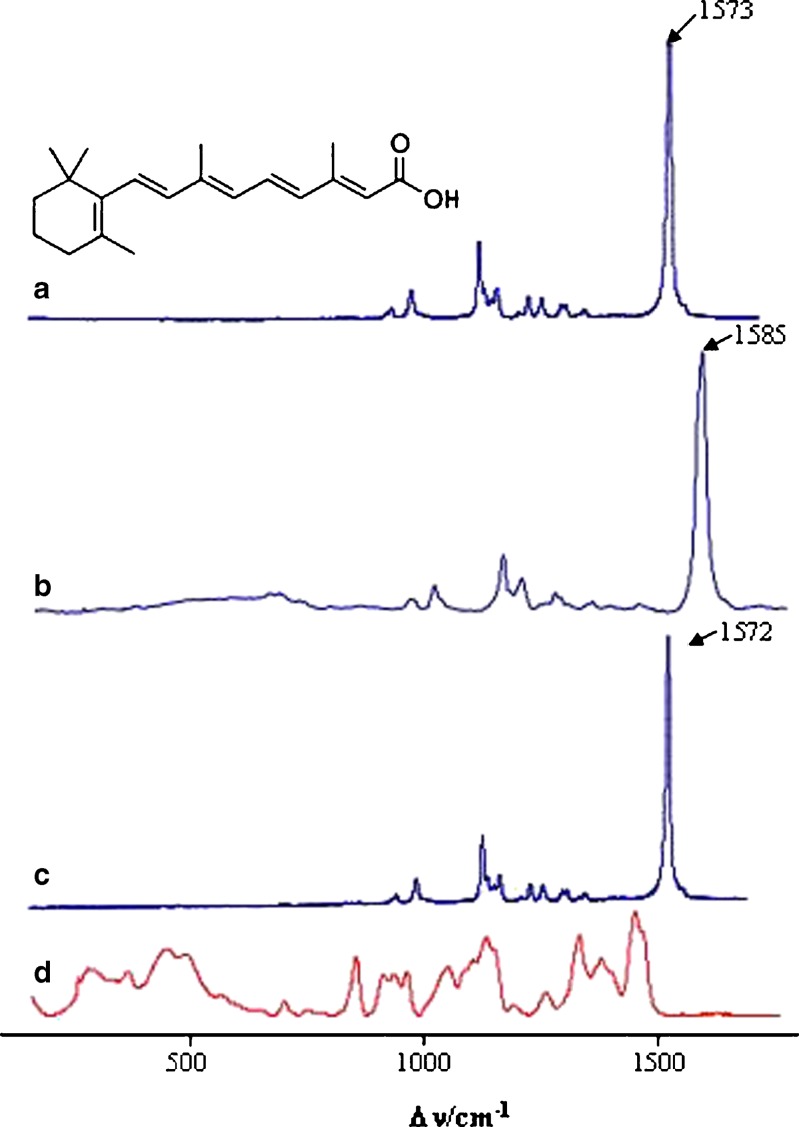
The results suggested a higher complexation yield for the complex prepared by co-evaporation method rather than by kneading according to 1H-NMR and FTIR spectra. The characterization of tretinoin inclusion complex was complemented by recording Raman spectra of the free drug at solid state (Fig. 7a)) and of its co-evaporated complex with the DM-β-CD (Fig. 7b)), the complex with more promising results. The Raman spectra of the physical mixture, using a ratio of 1:1, and of the DM-β-CD were also recorded (Fig. 7c and d, respectively).
Fig. 7.
Raman spectra of a tretinoin, b tretinoin/DM-β-CD co-evaporated complex, c physical mixture of tretinoin and DM-β-CD and d DM-β-CD in the most significant spectral regions (150–1,750 cm−1)
In the region 150–1,750 cm−1, the tretinoin bands can be roughly assigned to: C=C stretching (1,500–1,600 cm−1), the CCH in-plane rocks (1,250–1,400 cm−1), C–C stretching (1,100–1,250 cm−1) and the hydrogen out-of-plane wags (~1,000 cm−1). The most intense band at 1,573 cm−1 results from a symmetric combination of C2=C3, C4=C5, C6=C7, C8=C9, C10=C11 and stretching modes. The bands at 1,162 and 1,198 cm−1 are assigned to C=C stretching. The band at 1,272 cm−1 is attributed to the CH rock and that at 1,014 cm−1 to the symmetric in-plane rocking combination involving mainly the two methyl groups of the polyenic chain.
The comparison between these spectra reveals that the more relevant feature is the band at 1,573 cm−1. As mentioned above, this band corresponds to the entire delocalization of the superconjugated system, and after inclusion is observed as a positive frequency shift (ΔνC=C = +12 cm−1). The inclusion affects νC=C; but in the physical mixture, this band was not affected by the DM-β-CD. This may show that inclusion occurs with polyenic double bonds inside the DM-β-CD cavity.
The other interesting feature is the ΔνC=O assigned at 1,604 cm−1 (from the carboxylic group). Positive shifts were observed for the inclusion complex (ΔνC=O = +12 cm−1) and physical mixture (ΔνC=O = +8 cm−1), respectively. This band could be influenced by hydrogen bond interactions when DM-β-CD is present in the mixture. Probably this group fits near the cavity in the inclusion complex, in a different environment, explaining the larger shift, when compared with the physical mixture. Table III summarizes the most important spectral results.
Table III.
Raman Frequencies (cm−1)a
| System | νC=C | ΔνC=C | ΔC=O | ΔνC=O |
|---|---|---|---|---|
| Tretinoin | 1,573 | – | 1,604 | |
| Tretinoin/DM-β-CD | 1,585 | 12 | 1,716 | 12 |
| Physical mixture | 1,572 | 1 | 1,712 | 8 |
| DM-β-CD | b | b | ||
DM-β-CD dimethyl-beta-cyclodextrin
aFor asymmetric band shapes, single quoted frequencies correspond to the maxima of band envelopes
bSpectral window
In the other significant spectral region of 2,000–3,800 cm−1 (Csp3-H symmetric and asymmetric stretching), the Raman spectra analysis of the inclusion compounds was difficult due the strong fluorescent effect.
Molecular Modelling
The data obtained by our molecular modelling studies suggest that the more stable drug CD complex is obtained when the alkyl chain with the COOH group is inside the CD cavity leaving the cyclohexene ring outside the CD hydrophobic cavity. The energy of the more stable complex is −5,723.432 hartrees and the complexation energy, −32.5 kcal/mol, is lower than the one in which the ring is inside the CD cavity (−5723.399 hartrees and −11.9 kcal/mol, respectively; Fig. 8).
The enhanced complex stability arises from the hydrogen bonds formed between the COOH group of the drug and the bottom of the CD cavity, the distance between those groups is 1.6 Å (Fig. 9). Normally, it is considered that there is a hydrogen bond when the distance between two molecules is between 1.5 and 2 Å.
These data also suggest that the drug inclusion occurs at the side chain, including the COOH group. Probably, the methyl groups of DM-β-CD may induce some stereo hindrance. Our results are in complete agreement with other authors (22,28) who stated that the more stable complexes are the one where the cyclohexene ring is outside the cavity of the HP-β-CD, being oriented to the rim of the wider side of the cyclodextrin. The inclusion of the alkyl chain in the CD cavity increases the photostability by decreasing the possibility of isomerisation.
The possibility of this drug to complex with the two DM-β-CD molecules has also been tested, but our calculations suggest that this complexation is very energetically unfavourable, showing positive complexation energy around 100 kcal/mol.
The molecular electrostatic potential (MEPs) representations identify the distribution of the electrostatic potential in these molecules, identifying “areas” which are more “positive” or more “negative”: red areas correspond to more electronegative potential surfaces and the blue ones to more electropositive potential, as it can be observed by the scale of Fig. 10. MEPs generated this way have been proved to be very insightful in understanding molecular interactions.
From Fig. 10, an easier understanding of the calculated results can be obtained. From an electrostatic point of view, the side chain of the drug shows a more positive potential therefore interacting in a stronger mode with the CD more negative oxygen groups located inside the cavity. It is also important to note that the smaller volume of the drug side chain possibly makes the complex formation kinetics faster and permits a closer interaction between this side chain and some of the more electrostatically negative oxygen atoms of the CD.
Imaging of Complexes by AFM
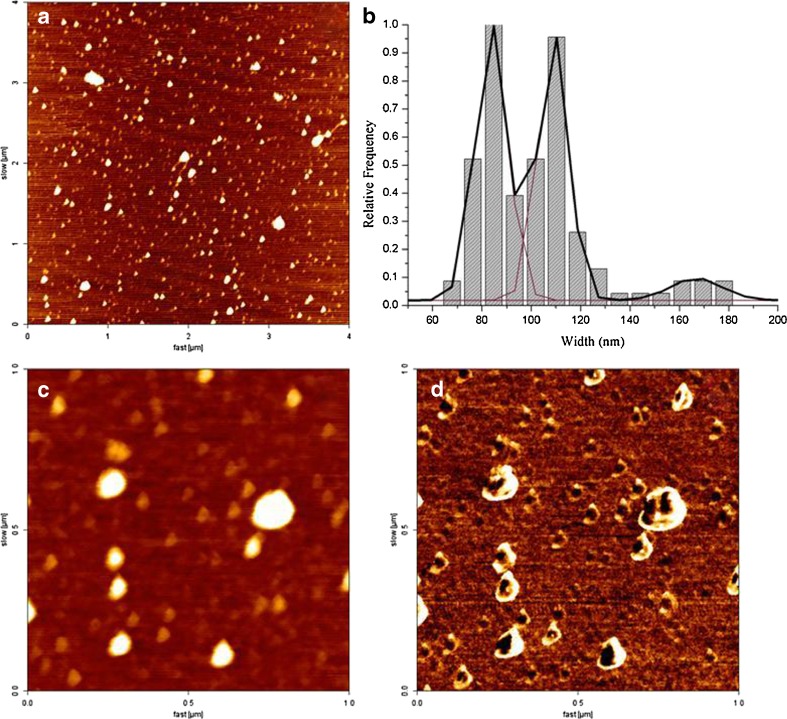
AFM images (Fig. 11) showed isolated discoidal structures with height values between 2.0 and 12 nm. After plotting the height vs. width cross section for each observed complex imaged on Fig. 11a, a width histogram (Fig. 11b) was built and an observation was made that the size distribution of this system was heterogeneous and polymodal, with three distinct sub-populations with different average cross-section widths: 83.9 ± 0.3 nm (group 1), 108.9 ± 0.3 nm (group 2) and 166.9 ± 4.4 nm (group 3). These sub-populations presented different relative frequencies on the whole sample constitution, which is 46% for group 1, 44% for group 2 and 10% for group 3. Group 3 could represent complex agglomerates, which is observed in the lower quantity on the sample than the isolated structures. Although these groups have different sizes, from the phase image (Fig. 11d), it could be observed that they all have the same phase constitution. The size distribution and shape of the complexes are in accordance with other authors who developed CD-DNA complexes loaded liposomes (29). The existence of different populations with cross-section length with a space of ~25 nm (groups 1 and 2) could be due to the different formulations of the tretinoin/CD complex molecular tubes or the existence of these molecules on a non-complexed state. From the AFM experiments, it could be concluded that there are isolated complexes at the sample, which are stable and do not change their structure upon scanning with the AFM tip.
Fig. 11.
Tretinoin/DM-β-CD co-evaporated complex imaged by atomic force microscopy on air tapping mode conditions. AFM images of flat round shape complexes with different sizes. a Height image (4 × 4 μm2). b Histogram of the relative frequencies of the different complex population widths. c, d Height and phase images (1 × 1 μm2), respectively, of the same sample area
CONCLUSION
This study has demonstrated that it is possible to complex tretinoin with DM-β-CD by different techniques, obtaining a relatively high complexation constant and higher drug solubility. The phase solubility studies allowed the determination of stoichiometry and equilibrium constant of the complex. The stoichiometry was 1:1 of tretinoin/CD, which had also been demonstrated by molecular modelling calculations.
The proof of the inclusion was given by the drug peak disappearance in DSC thermograms and X-ray diffractograms and also by the changes in the chemical shift detected for the H3 and H5 protons of DM-β-CD by 1H-NMR.
According to the FTIR and 1H-NMR spectra, the best method of complex preparation was the co-evaporation method. The drug portion structure preferentially included inside the CD cavity is probably the side chain of the molecule, including the COOH functional group, leaving the ring out (considering 1:1 stoichiometry). This interaction was also confirmed by molecular modelling calculations and Raman spectra of the complex. Finally, it could be concluded by the AFM results that there are isolated complexes at the sample, which are stable and do not change their structure upon scanning with the AFM tip.
ACKNOWLEDGEMENTS
We thank Dias de Sousa Company and Évora University for their X-ray technical support.
REFERENCES
- 1.European Pharmacopoeia 6.0, edom, 2008. (electronic version)
- 2.Tretinoin and Dimethyl-beta-cyclodextrin in: http://www.chemexper.com (accessed on Sept. 2008)
- 3.Anadolu RY, Sen T, Tarimci N, Birol A, Erdem C. Improved efficacy and tolerability of retinoic acid in acne vulgaris: a new topical formulation with cyclodextrin complex psi. Eur. J. Acad. Dermatol. Venereol. 2004;18:416–21. doi: 10.1111/j.1468-3083.2004.00929.x. [DOI] [PubMed] [Google Scholar]
- 4.Loveday SM, Singh H. Recent advances in technologies for vitamin A protection in foods. Trends in Food Sci. & Tech. 2008;XX:1–12. [Google Scholar]
- 5.Szejtli J. Cyclodextrins properties and applications. Drug Invest. 1990;2:11–21. [Google Scholar]
- 6.Challa R, Ahuja A, Ali J, Khar R. Cyclodextrins in drug delivery: an updated review. AAPS PharmSciTech. 2005;6:329–57. doi: 10.1208/pt060243. [DOI] [PMC free article] [PubMed] [Google Scholar]
- 7.Singh M. Biotechnological applications of cyclodextrins. Biot. Adv. 2002;20:341–59. doi: 10.1016/S0734-9750(02)00020-4. [DOI] [PubMed] [Google Scholar]
- 8.Marques HC. Applications of cyclodextrins. Thermodynamic aspects of cyclodextrin complexes. Rev. Port. Farm. 1994;44:85–96. [Google Scholar]
- 9.Szejtli J. Utilization of cyclodextrins in industrial products and processes. J. Mat. Chem. 1997;7:575–87. doi: 10.1039/a605235e. [DOI] [Google Scholar]
- 10.Matsuda H, Arima H. Cyclodextrins in transdermal and rectal delivery. Adv. Drug Deliv. Rev. 1999;36:81–99. doi: 10.1016/S0169-409X(98)00056-8. [DOI] [PubMed] [Google Scholar]
- 11.Mosher G, Thompson D. Complexation and cyclodextrins. In: Swarbrick J, Boylan JC, editors. Encyclopedia of pharmaceutical technology. New York, NY: Marcell Dekker; 2006. pp. 49–88. [Google Scholar]
- 12.Montassier P, Duchêne D, Poelman M-C. Inclusion complexes of tretinoin with cyclodextrins. Int. J. Pharm. 1997;153:199–209. doi: 10.1016/S0378-5173(97)00104-X. [DOI] [Google Scholar]
- 13.Higuchi T, Connors KA. Phase-solubility techniques. In: Reilly CN, editor. Advances in analytical chemistry and instrumentation. New York: Wiley; 1965. pp. 117–212. [Google Scholar]
- 14.Hohenberg P, Kohn Inhomogeneous electron gas. W Phys Rev. 1964;136:B864. doi: 10.1103/PhysRev.136.B864. [DOI] [Google Scholar]
- 15.Becke AD. Density-functional thermochemistry. III. The role of exact exchange. J Chem Phys. 1993;98:5648. doi: 10.1063/1.464913. [DOI] [Google Scholar]
- 16.Binkley JS, Pople JA, Hehre WJ. Self-consistent molecular orbital methods. 21. Small split-valence basis sets for first-row elements. J. Am. Chem. Soc. 1980;102:939. doi: 10.1021/ja00523a008. [DOI] [Google Scholar]
- 17.Lee C, Yang W, Parr RG. Development of the Colle-Salvetti correlation-energy formula into a functional of the electron density. Phys. Rev. 1988;B37:785. doi: 10.1103/physrevb.37.785. [DOI] [PubMed] [Google Scholar]
- 18.Frisch MJ, Trucks GW, Schlegel HB, Scuseria GE, Robb MA, Cheeseman JR, et al. Gaussian 03, Revision C.02. Wallingford CT: Gaussian, Inc; 2004. [Google Scholar]
- 19.MOE—the Molecular Operating Environment in: http://www.chemcomp.com/ (accessed on 2007/08)
- 20.http://pymol.sourceforge.net/ (accessed on 2007/08)
- 21.Molekel is an opensource (GPL) multiplatform molecular visualization program being developed by the Visualization and Data Analysis group at the Swiss National Supercomputing Centre (CSCS). The development website is hosted at http://bioinformatics.org/molekel (accessed on 2007/08).
- 22.Muñoz-Botella S, Martín MA, del Castillo B, Lerner DA, Menéndez JC. Differentiating geometrical isomers of retinoids and controlling their photo-isomerization by complexation with cyclodextrins. Anal Chim Acta. 2002;468:161–70. doi: 10.1016/S0003-2670(02)00629-3. [DOI] [Google Scholar]
- 23.Uekama K, Ono N, Hirayama F, Arima H. Determination of the stability constants for inclusion complexes of cyclodextrins with various drug molecules by high performance liquid chromatography. Chem Pharm Bull. 1978;26:3477–84. [Google Scholar]
- 24.Waleczek KJ, Cabral MH, Hempel B, Schmidt PC. Phase solubility studies of pure (−)-alfa-bisabolol and camomile essencial oil with beta-cyclodextrin. Eur J Pharm Biopharm. 2003;55:247–51. doi: 10.1016/S0939-6411(02)00166-2. [DOI] [PubMed] [Google Scholar]
- 25.Loftsson T, Hreinsdóttir D, Masson M. Evaluation of cyclodextrin solubilization of drugs. Int J Pharm. 2005;302:18–28. doi: 10.1016/j.ijpharm.2005.05.042. [DOI] [PubMed] [Google Scholar]
- 26.Miyaji T, Kurono Y, Uekama K, Ikeda K. Simultaneous determination of complexation equilibrium constants for conjugated guest species by the extended potentiometric titration method on the barbiturate-β-cyclodextrin system. Chem Pharm Bull. 1976;24:1155–9. doi: 10.1248/cpb.24.1155. [DOI] [PubMed] [Google Scholar]
- 27.Cirri M, Maestrelli F, Orlandini S, Furlanetto S, Pinzauti S, Mura P. Determination of stability constant values of flurbiprofen-cyclodextrin complexes using different techniques. J Pharm Sci. 2004;37:995–1002. doi: 10.1016/j.jpba.2004.09.044. [DOI] [PubMed] [Google Scholar]
- 28.Yap KL, Liu X, Thenmozhiyal JC, Ho PC. Characterization of the 13-cis-retinoic acid/cyclodextrin inclusion complexes by phase solubility, photostability, physico-chemical and computational analysis. Eur. J. Pharm. Sci. 2005;25:49–56. doi: 10.1016/j.ejps.2005.01.021. [DOI] [PubMed] [Google Scholar]
- 29.Tavares GD, Viana CM, Araújo JGVC, Ramaldes GA, Carvalho WS, Pesquero JL, Vilela JMC, Andrade MS, Oliveira MC. Development and physico-chemical characterization of cyclodextrin–DNA complexes loaded liposomes. Chem Phys Letters. 2006;429:507–12. doi: 10.1016/j.cplett.2006.08.043. [DOI] [Google Scholar]


