

Abstract
The purpose of this study is to determine whether sodium alginate solutions’ rheological parameters are meaningful relative to sodium alginate’s use in the formulation of calcium alginate gels. Calcium alginate gels were prepared from six different grades of sodium alginate (FMC Biopolymer), one of which was available in ten batches. Cylindrical gel samples were prepared from each of the gels and subjected to compression to fracture on an Instron Universal Testing Machine, equipped with a 1-kN load cell, at a cross-head speed of 120 mm/min. Among the grades with similar % G, (grades 1, 3, and 4), there is a significant correlation between deformation work (LE) and apparent viscosity (ηapp). However, the results for the partial correlation analysis for all six grades of sodium alginate show that LE is significantly correlated with % G, but not with the rheological properties of the sodium alginate solutions. Studies of the ten batches of one grade of sodium alginate show that ηapp of their solutions did not correlate with LE while tan δ was significantly, but minimally, correlated to LE. These results suggest that other factors—polydispersity and the randomness of guluronic acid sequencing—are likely to influence the mechanical properties of the resultant gels. In summary, the rheological properties of solutions for different grades of sodium alginate are not indicative of the resultant gel properties. Inter-batch differences in the rheological behavior for one specific grade of sodium alginate were insufficient to predict the corresponding calcium alginate gel’s mechanical properties.
Key words: apparent viscosity, calcium alginate gel, compression, gel properties, viscoelasticity
INTRODUCTION
Sodium alginate is a linear unbranched, amorphous copolymer composed of β-d-mannuronic acid (M) and α-l-guluronic acid (G) linked by 1 → 4 glycosidic bonds. The M and G units in the alginates may be randomly or non-randomly organized as heterogeneous or homogeneous sequences (Fig. 1). Commercially available sodium alginate is usually extracted from various seaweeds. The chemical composition and sequence distribution of sodium alginate depends on the species and parts of the seaweed employed for extraction (1). Chemical compositions for sodium alginate extracted from some common seaweed species are listed in Table I (2).
Fig. 1.

Sodium alginate sequences (from top to bottom): homogeneous G sequence, homogeneous M sequence, and heterogeneous MG sequence. M mannuronic acid, G guluronic acid
Table I.
Fractional Chemical Composition of Sodium Alginates Extracted from Various Seaweed
| Source | G | M |
|---|---|---|
| Ascophyllum nodosum (old tissue) | 0.36 | 0.64 |
| Ascophyllum nodosum (fruiting bodies) | 0.10 | 0.90 |
| Durvillea antartica | 0.29 | 0.71 |
| Laminaria digitata | 0.46 | 0.54 |
| Laminaria hyperborea (Stipe) | 0.68 | 0.32 |
| Laminaria hyperborea (Leaf) | 0.55 | 0.45 |
| Laminaria hyperborea (outer cortex) | 0.75 | 0.25 |
| Laminaria japonica | 0.31 | 0.69 |
| Macrocystis pyrifera | 0.39 | 0.61 |
Sodium alginate is widely used as a gelling agent due to its ability to form gels under mild conditions with divalent cations such as calcium. Calcium alginate gels have been used in wound dressings, dental impression materials, controlled release drug delivery systems, and the encapsulation of living cells (3–6). The ionotropic gelation of sodium alginate with calcium cations is conventionally described by the “egg-box” model, where calcium cations interact with guluronic acid monomers in the cavities formed by pairing up of the G sequences of the alginate molecular chains (Fig. 2) (7,8). Recent studies on calcium alginate gel formation reveal three distinct and successive steps of calcium binding to alginate with increasing calcium concentration: (1) interaction of calcium with a single G monomer; (2) formation of egg-box dimers; and, (3) lateral association of dimers to form multimers (9). The G sequence and molecular weight of sodium alginate determine the association modes of dimers and multimers of the resultant calcium alginate gels (9).
Fig. 2.

Illustration of the “egg-box” model for calcium alginate gel and the interaction between calcium cations and oxygen atoms (filled circles) on the guluronic acid monomers (7,8)
Since sodium alginate is extracted from seaweed, commercial pharmaceutical grade alginates can be expected to be heterogeneous due to the differences in seaweed species, seaweed parts employed, harvesting location, and the harvesting season. As a result, sodium alginates from different manufacturers are unlikely to exhibit the same properties. Furthermore, the alginates provided by a specific manufacturer may be expected to show batch-to-batch variations.
Pharmaceutical excipients are required to adhere to specifications listed in their monographs in US Pharmacopeia-National Formulary. Each batch or lot of the excipient is tested by the excipient manufacturer to ensure compliance with the monograph specification; each shipment of the excipient would be accompanied by the manufacturer’s certificate of analysis (CoA). However, pharmacopoeial specifications for sodium alginate make no mention of the viscosity of sodium alginate’s solutions, even though the viscosity of its solutions is directly influenced by alginate molecular weight, M or G composition, and solution concentration. The manufacturer’s CoA often provides viscosity data for sodium alginate solutions but seldom reports % G values for each batch. However, even when the manufacturer’s viscosity data is provided, it is a “one-point” value, i.e., determined at one concentration, one shear condition, and one temperature. Consequently, this datum may not reveal relevant rheological information regarding sodium alginate’s behavior in alginate-containing formulations.
Previous studies on calcium alginate gels have shown that gel strength is influenced by both molecular weight and % G of the sodium alginate: higher molecular weights or higher % G are associated with stronger gels (10–15). For those sodium alginates with similar % G, it was reported that higher molecular weights or higher solution apparent viscosities correlated with higher calcium alginate gel strength (12,14,15). However, no quantitative relationship among apparent viscosity, gel strength, molecular weight, and/or % G was proposed or suggested. Furthermore, most of the sodium alginates employed in these studies were not pharmaceutical grades.
Earlier work in our laboratory (paper accepted by AAPSPharmSciTech for publication) demonstrated that rheological methods are capable of differentiating among multiple pharmaceutical grades and batches of sodium alginate varying in average molecular weight and chemical composition. Furthermore, the “one-point” viscosity values reported in the CoAs do not reflect the inter-batch variability in the solutions’ apparent viscosities at 2% w/w. The purpose of this work is to determine whether sodium alginate solutions’ rheological parameters are meaningful relative to the subsequent use of the various sodium alginates in the formulation of calcium alginate gels. Calcium alginate samples were prepared from 2% w/w solutions of the six grades and ten batches of sodium alginate previously studied. Gel properties were evaluated by compression using an Instron Universal Testing Machine and the correlation between the gel properties and the solution properties of sodium alginate was investigated.
MATERIALS
Six grades (one batch each) and ten batches of one of the grades of sodium alginate were provided by FMC Biopolymer (Drammen, Norway). Physicochemical properties of the various grades and batches are listed in Tables II and III, respectively. Deionized water was obtained from a Milli-Q ultrapure water system (Millipore Corp., Billerica, MA, USA). Calcium phosphate dibasic dihydrate and gluconic acid-δ-lactone were purchased from Sigma-Aldrich (St. Louis, MO, USA) and used as supplied.
Table II.
Physicochemical Properties Including % G, Intrinsic Viscosity [η], and Average Molecular Weights Calculated Based on Intrinsic Viscosity of the Six Grades of Sodium Alginate
| Grade | % G a (% range) | [η] (dL/g; mean ± SD)b | M w (kDa) | M n (kDa) |
|---|---|---|---|---|
| 1 | 37–42 | 5.53 ± 0.15 | 263 | 68 |
| 2 | 33–36 | 6.04 ± 0.09 | 288 | 75 |
| 3 | 38–42 | 6.43 ± 0.06 | 306 | 80 |
| 4 | 39–43 | 8.72 ± 0.24 | 418 | 109 |
| 5 | 48–53 | 8.54 ± 0.12 | 409 | 107 |
| 6 | 43–47 | 11.26 ± 1.21 | 541 | 142 |
aValues were determined by solid-state NMR
b n = 6
Table III.
Physicochemical Properties Including% G, Intrinsic Viscosity [η], and Average Molecular Weights Calculated Based on Intrinsic Viscosity of the Ten Batches of One Grade of Sodium Alginate (Grade 3)
| Batch | % G a (% range) | [η] (dL/g; mean ± SD)b | M w (kDa) | M n (kDa) |
|---|---|---|---|---|
| A | 37–41 | 7.80 ± 0.20 | 373 | 97 |
| B | 38–41 | 7.14 ± 0.07 | 341 | 89 |
| C | 38–41 | 7.32 ± 0.18 | 350 | 91 |
| D | 38–40 | 7.48 ± 0.11 | 357 | 93 |
| E | 38–41 | 6.67 ± 0.12 | 318 | 83 |
| F | 37–41 | 6.87 ± 0.27 | 328 | 85 |
| G | 39–41 | 6.53 ± 0.39 | 311 | 81 |
| H | 38–40 | 6.91 ± 0.29 | 330 | 86 |
| I | 39–42 | 7.33 ± 0.19 | 350 | 91 |
| J | 39–42 | 7.16 ± 0.09 | 342 | 89 |
aValues were determined by solid-state NMR
b n = 6
METHODS
Rheological Measurements of Sodium Alginate Solutions
The procedures employed in generating the steady shear and small amplitude oscillatory data for the sodium alginate solutions were described in our previous paper (accepted by AAPSPharmSciTech for publication).
Calcium Alginate Gel Preparation
Sodium alginate gels were prepared by the “internal gelification” method (14,16): an amount of calcium ion equivalent to one half the alginate monomer molar content (n2+ca = 1/2 nmonomer1) was thoroughly dispersed in 2% w/w sodium alginate solutions. The dispersions were mixed at 2,000 rpm for 2 min via a Thinky Mixer (Model ARM 310, Thinky USA, Laguna Hills, CA, USA) to remove air bubbles. By adding equivalent molar amounts (n = n2+Ca) of gluconic acid-δ-lactone to the dispersion under vigorous stirring, calcium ions were slowly released into the solution. The resultant dispersions were quickly poured into a 24-well plate (Falcon® 3047 Multiwell™, Becton Dickinson Labware, Franklin Lakes, NJ, USA) and stored at room temperature for 24 h. Cylindrical gel samples were formed inside the wells (∼15 mm in diameter × 17 mm in height).
Mechanical Tests of Gels
Cylindrical gel samples were subjected to compression to fracture at a cross-head speed of 120 mm/min on an Instron Universal Testing Machine (model 5800) equipped with a 1-kN load cell (Instron, Norwood, MA, USA) (Fig. 3). Instron software, Bluehill®2, was used to operate the instrument and collect data. The cross-head and base were both covered with sandpaper (fine grade 150, 3 M, St. Paul, MN, USA) to prevent gel slippage between the platens. All tests were replicated six times, and the mean values and standard deviations calculated.
Fig. 3.
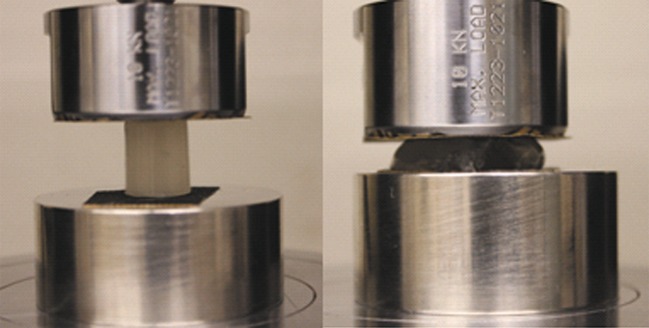
Illustration of cylindrical gel sample placed between two platens on an Instron Universal Testing Machine (left, beginning of compression; right, gel fracture under compression)
Data Analysis
During compression, the cylindrical gel sample became barrel-shaped. Nonetheless, the cross-sectional area between the gel sample and the platens was assumed to be constant. The instantaneous values of applied force F(t) and sample height H(t) were converted into engineering stress, σE, and engineering strain, εE, as follows:
 |
1 |
 |
2 |
where A0 is the cross-sectional area between the sample and the platen, and H0 is the initial height of the cylindrical gel sample.
The stress–strain relationship was fitted by a power-law model (17):
 |
3 |
where k is the rigidity constant, indicative of the stiffness of the gel, while n is the degree of stress–strain curve concavity. Deformation work at gel fracture (LE), per unit volume, is calculated as the area under the stress–strain curve:
 |
4 |
Statistical Analysis
The differences in calcium alginate gel properties among the various grades and batches were analyzed via analysis of variance (ANOVA) and Levene’s test for homogeneity of variance using PASW Statistics 18 for Windows (SPSS Inc., Chicago, IL, USA). Post hoc testing (p < 0.05) of the multiple comparisons was performed by either the Tukey’s honestly significant difference test or Games–Howell test depending on whether Levene’s test was insignificant or significant, respectively. Partial correlation tests for gel properties and rheological properties of sodium alginate solutions were conducted using PASW Statistics 18 for Windows (SPSS Inc., Chicago, IL, USA).
RESULTS AND DISCUSSION
Grades of Sodium Alginate
All gel samples exhibited syneresis after 24 h at room temperature. The actual alginate concentration in the gel samples was estimated taking into account the loss of free water. The actual and nominal concentrations are quite similar among the six grades of sodium alginate; their ratio averaged 1.06 ± 0.02, similar to the ratio reported by Mancini et al. (14) for their calcium sodium alginate gels. The observed stress (σE)–strain (εE) relationships for the calcium alginate gels prepared from the six grades of sodium alginate were concave as shown in Fig. 4. Table IV summarizes the engineering strain (εE), stress (σE), and deformation work (LE) at gel fracture along with empirical parameters k and n determined in accordance with Eq. 3 by nonlinear regression analysis (r2 > 0.99) via GraphPad Prism (version 5, GraphPad Software, Inc., La Jolla, CA, USA).
Fig. 4.

Representative results for compressive engineering stress (σ E) up to gel fracture as a function of engineering strain (ε E) for cylindrical samples of calcium alginate gels prepared from six different grades of sodium alginate
Table IV.
Engineering Strain (ε E), Stress (σ E), Work of Deformation (L E) at Gel Fracture, and Parameters (k and n) from the Stress–Strain Equation (Eq. 3) for Six Grades of Sodium Alginate
| Grade | ε E | σ E (kPa) | L E (kJ/m3) | log k | n |
|---|---|---|---|---|---|
| 1 | 0.53 ± 0.006 | 244.58 ± 9.15 | 33.68 ± 1.72 | 3.18 ± 0.006 | 2.88 ± 0.026 |
| 2 | 0.52 ± 0.005 | 123.32 ± 3.42 | 17.04 ± 0.85 | 2.87 ± 0.012 | 2.78 ± 0.049 |
| 3 | 0.58 ± 0.004 | 344.00 ± 10.55 | 49.98 ± 1.97 | 3.25 ± 0.010 | 3.01 ± 0.017 |
| 4 | 0.60 ± 0.015 | 471.88 ± 29.42 | 69.17 ± 4.39 | 3.36 ± 0.024 | 3.11 ± 0.14 |
| 5 | 0.59 ± 0.004 | 679.15 ± 17.79 | 101.02 ± 2.84 | 3.52 ± 0.009 | 2.93 ± 0.035 |
| 6 | 0.61 ± 0.012 | 661.47 ± 61.57 | 96.85 ± 9.92 | 3.50 ± 0.025 | 3.24 ± 0.063 |
Data were reported as mean ± standard deviation calculated based on six replicates
The differences in the stress–strain profiles among the six grades of sodium alginate are reflected in their log k and n values. All of the gels prepared from the six grades of sodium alginate demonstrated strain-hardening compressive behavior with n values larger than one. This behavior has been reported in previous studies (14,16) and could be the result of the densification of the cross-linked junctions in the calcium alginate gels (18). Generally, n values correlate with log k values, indicating that gels with higher stiffness are also more strain-hardening.
The σE and LE at gel fracture correlate with the stiffness of the gel as reflected in the log k values: gels with high log k values also have high fracture stresses/deformation work. The εE, σE, and LE at gel fracture range from 0.52 to 0.61, 123 to 679 kPa, and 17 to 101 kJ/m3, respectively, among the six grades of sodium alginate. ANOVA and post hoc multiple comparisons tests of the LE at gel fracture among the six grades reveal that grades 5 and 6 are not significantly different from each other while the other grades do differ significantly from one another.
The relationship of calcium alginate gel strength (LE) to the% G of sodium alginate and the rheological properties (ηapp and tan δ) of the sodium alginate solutions reported in our previous paper (accepted by AAPSPharmSciTech for publication) was analyzed by partial correlation tests via PASW Statistics 18. Among the grades with similar % G, i.e. grades 1, 3, and 4, there is a significant correlation between LE and ηapp (r = 0.696, P = 0.003). However, the results for the partial correlation analysis for all six grades of sodium alginate show that LE is significantly correlated with % G (r = 0.781; P < 0.01), but not with the rheological properties of the sodium alginate solutions.
Multiple Batches
Gel samples prepared from multiple batches of sodium alginate exhibited syneresis after 24 h at room temperature. The ratio between the actual and nominal concentration is almost the same among the multiple batches (1.08 ± 0.03). Gel compression properties of the ten batches are shown in Fig. 5 and Table V.
Fig. 5.

Compressive engineering stress (σ E) up to gel fracture as a function of engineering strain (ε E) of cylindrical samples of calcium alginate gels prepared from multiple batches of grade 3 of sodium alginate
Table V.
Engineering Strain (ε E), Stress (σ E), Deformation Work (L E) at Gel Fracture, and Parameters (k and n) from the Stress–Strain Equation for the Ten Batches of Sodium Alginate (Grade 3)
| Batch | ε E | σ E (kPa) | L E (kJ/m3) | Log k | n |
|---|---|---|---|---|---|
| A | 0.55 ± 0.006 | 298.75 ± 5.86 | 42.16 ± 1.01 | 2.87 ± 0.012 | 2.78 ± 0.049 |
| B | 0.54 ± 0.013 | 265.13 ± 15.62 | 36.99 ± 3.23 | 3.20 ± 0.005 | 2.90 ± 0.008 |
| C | 0.57 ± 0.008 | 334.00 ± 9.72 | 48.30 ± 2.20 | 3.26 ± 0.007 | 2.99 ± 0.052 |
| D | 0.56 ± 0.005 | 331.91 ± 10.80 | 47.52 ± 1.69 | 3.26 ± 0.020 | 2.96 ± 0.095 |
| E | 0.56 ± 0.007 | 326.56 ± 14.32 | 45.97 ± 3.10 | 3.25 ± 0.012 | 2.98 ± 0.012 |
| F | 0.56 ± 0.008 | 322.96 ± 12.5 | 46.00 ± 2.47 | 3.25 ± 0.012 | 2.95 ± 0.072 |
| G | 0.57 ± 0.007 | 335.67 ± 11.72 | 48.87 ± 2.40 | 3.25 ± 0.008 | 2.99 ± 0.053 |
| H | 0.57 ± 0.005 | 326.29 ± 7.93 | 46.59 ± 1.62 | 3.26 ± 0.008 | 3.05 ± 0.06 |
| I | 0.58 ± 0.005 | 393.31 ± 5.75 | 55.08 ± 0.38 | 3.34 ± 0.014 | 3.15 ± 0.069 |
| J | 0.57 ±0.006 | 383.22 ±11.52 | 54.84 ± 2.12 | 3.31 ± 0.006 | 2.99 ± 0.031 |
Data were reported as mean ± standard deviation calculated based on six replicates
The εE, σE, and LE at gel fracture range from 0.54 to 0.58, 265 to 393 kPa, and 37 to 55 kJ/m3 among these batches. The % G values for these batches determined by solid-state NMR are in the same range (37–41%) as shown in Table III. It would be expected that higher apparent viscosities would lead to higher gel strength. However, partial correlation tests indicate that LE is not significantly correlated with ηapp (r = 0.001).
Our previous studies of the rheological properties of the ten batches of sodium alginate demonstrated that the ηapp of 2% w/w solutions at 25°C of batch A is significantly higher than that of the other batches. No significant differences are evident among the other nine batches (paper accepted by AAPSPharmSciTech for publication). However, batch A exhibits the second lowest gel strength (LE: 42.16 kJ/m3) among the multiple batches. Batches J and K, which have relatively low apparent viscosities compared with other batches, exhibit much higher gel strength (LE, 55.08 and 54.84 kJ/m3). As a result, the apparent viscosities of the sodium alginate solutions from multiple batches are not indicative of the resultant calcium alginate gel strength as depicted in Fig. 6. On the other hand, the viscoelastic behavior of the multiple batches demonstrates a significant, although minimal, correlation (Fig. 7, r = 0.426; P = 0.001) between LE and tan δ.
Fig. 6.

Deformation work (L E) of calcium alginate gel samples prepared from the multiple batches of grade 3 as a function of the corresponding apparent viscosity (η app) of sodium alginate solutions (2% w/w, 1 Pa shear stress, 25°C)
Fig. 7.

Deformation work (L E) of calcium alginate gel samples prepared from the multiple batches of grade 3 as a function of the corresponding tan δ of sodium alginate solutions (2% w/w, 1 rad/s, 25°C)
ANOVA test on LE values for the multiple batches demonstrated significant differences among batches (P < 0.001). The subsequent multiple comparisons test yields the information on the pair-to-pair differences as summarized in Table VI along with their differences in rheological properties. Those batches that are significantly different in their tan δ values are also significantly different in their LE values. However, some batches that are not significantly different in their tan δ values still display significant differences in their LE values.
Table VI.
Results for Multiple Comparisons Test of the Gel Deformation Work and Rheological Properties Among the Ten Batches of Sodium Alginate (Grade 3)
| Batch | ||||||||||
|---|---|---|---|---|---|---|---|---|---|---|
| A | A | |||||||||
| B | a | B | ||||||||
| C | a, t, g | g | C | |||||||
| D | a, g | g | –* | D | ||||||
| E | a | g | –* | a | E | |||||
| F | a | g | –* | –* | –* | F | ||||
| G | a, g | g | –* | –* | –* | –* | G | |||
| H | a, g | g | –* | –* | –* | –* | –* | H | ||
| I | t, g | t, g | g | t, g | g | t, g | t, g | t, g | I | |
| J | t, g | t, g | g | t, g | t, g | t, g | t, g | t, g | –* | J |
The letters in the cells correspond to significant differences in paired data for specific rheological outcomes or gel properties, as follows: a log η app, t tan δ, and g L E
*No significant differences
Inadequate knowledge of the monomer sequence and distribution of the alginate molecular chains complicates the interpretation of these data (19). While solid-state NMR can be used to determine the total amount of each monomer in intact sodium alginate powder, it cannot be easily used to determine the amounts of diad and triad sequences due to the broad linewidths and decreased resolution typically seen in amorphous materials. Even though solution NMR spectroscopy has been applied to determine the monad (G or M), diad (GG, MM, or MG), and triad (GGG, GGM, MGG, MGM, etc.) frequencies within the alginate molecule (20,21), it requires partial acid hydrolysis of the sodium alginate sample which could lead to sample alteration or loss of part of the polymer chain. Furthermore, assuming the data obtained from solution NMR were accurate, the monomer sequence length distribution can only be obtained by simulation assuming a statistical model for monomer distribution, which is usually an oversimplification of the biosynthesis of alginate (22). Commercially available sodium alginates are very likely produced from different types or parts of seaweeds and blended together to achieve a final chemical composition. In these situations, NMR data with statistical models are not sufficient to depict the monomer sequence length distribution (23).
It was reported that a minimum length of G sequence is required to form junction with divalent cations (about eight for calcium alginate gel at 20°C) and longer G sequence results in stronger gels (23–25). In addition, molecular weight distribution of sodium alginate would influence the interactions of dimers and multimers of the resultant calcium alginate gels (9). The variability in G sequence and molecular weight distribution among these grades and batches may not be directly reflected in the rheological properties of sodium alginate solutions. Therefore, it is difficult to predict the calcium alginate gel properties based on the rheological properties of sodium alginate solutions.
As a result, for calcium alginate gel formulations, e.g., calcium alginate hydrogels, microcapsules, etc., it is recommended that calcium alginate gel properties, such as deformation work at gel fracture, be used to define the design space.
CONCLUSIONS
The mechanical strength (i.e., LE) of calcium alginate gels prepared from multiple grades is significantly correlated with % G of the corresponding sodium alginates. However, the rheological properties of solutions of these different grades of sodium alginate are not indicative of the resultant gel properties. For the one specific grade of sodium alginate available in multiple batches, inter-batch differences in the rheological behavior were insufficient to predict the corresponding calcium alginate gel’s mechanical properties even though the viscoelastic behavior of the multiple batches demonstrated a significant, although minimal, correlation between LE and tan δ. As a result, the use of steady shear and SAO methods to characterize sodium alginate solutions do not offer adequate insight into the resultant calcium alginate gel properties. Other rheological methods such as extensional rheology may ultimately prove to be more effective and meaningful. In the interim, until additional studies are done, we recommend that calcium alginate gels’ mechanical properties be measured directly in order to ensure interchangeability of new batches or lots of sodium alginate used in gel preparation.
ACKNOWLEDGMENTS
The authors thank Dr. Brian Carlin (FMC Biopolymer, Princeton, NJ) for providing the various grades and batches of sodium alginate used in this study.
Footnotes
The number of moles of sodium alginate monomers (nmonomer) can be calculated as malginate/(198 g/mole).
REFERENCES
- 1.McHugh DJ. Production, properties and uses of alginates. In: McHugh DJ, editor. Production and utilization of products from commercial seaweeds. Rome: Food & Agriculture Organization of the United Nations (FAO); 1988. p. 43–91.
- 2.Skjaak-Braek G, Martinsen A. Application of some algal polysaccharides in biotechnology. In: Guiry MD, Blunden G, editors. Seaweed resources in Europe: uses and potentials. New York: Wiley; 1991. pp. 219–257. [Google Scholar]
- 3.Wells LA, Sheardown H. Extended release of high pI proteins from alginate microspheres via a novel encapsulation technique. Eur J Pharm Biopharm. 2007;65:329–335. doi: 10.1016/j.ejpb.2006.10.018. [DOI] [PubMed] [Google Scholar]
- 4.Rubio MR, Ghaly ES. In-vitro release of acetaminophen from sodium alginate controlled release pellets. Drug Dev Ind Pharm. 1994;20:1239–1251. doi: 10.3109/03639049409038364. [DOI] [Google Scholar]
- 5.Thomas S. Alginate dressings in surgery and wound management—part 1. J Wound Care. 2000;9:56–60. doi: 10.12968/jowc.2000.9.2.26338. [DOI] [PubMed] [Google Scholar]
- 6.King S, See H, Thomas G, Swain M. Determining the complex modulus of alginate irreversible hydrocolloid dental material. Dent Mater. 2008;24:1545–1548. doi: 10.1016/j.dental.2008.03.021. [DOI] [PubMed] [Google Scholar]
- 7.Grant GT, Morris ER, Rees DA, Smith PJC, Thom D. Biological interactions between polysaccharides and divalent cations: the egg-box model. FEBS Lett. 1973;32:195–198. doi: 10.1016/0014-5793(73)80770-7. [DOI] [Google Scholar]
- 8.Morris ER, Rees DA, Thom D, Boyd J. Chiroptical and stoichiometric evidence of a specific, primary dimerisation process in alginate gelation. Carbohydr Res. 1978;66:145–154. doi: 10.1016/S0008-6215(00)83247-4. [DOI] [Google Scholar]
- 9.Fang Y, Al-Assaf S, Phillips GO, Nishinari K, Funami T, Williams PA, et al. Multiple steps and critical behaviors of the binding of calcium to alginate. J Phys Chem B. 2007;111:2456–2462. doi: 10.1021/jp0689870. [DOI] [PubMed] [Google Scholar]
- 10.Haug A, Myklestad S, Larsen B, Smidsrod O. Correlation between chemical structure and physical properties of alginates. Acta Chem Scand. 1967;21:768–778. doi: 10.3891/acta.chem.scand.21-0768. [DOI] [Google Scholar]
- 11.Penman A, Sanderson GR. A method for the determination of uronic acid sequence in alginates. Carbohydr Res. 1972;25:273–282. doi: 10.1016/S0008-6215(00)81637-7. [DOI] [PubMed] [Google Scholar]
- 12.Draget KI, Simensen MK, Onsoyen E, Smidsrod O. Gel strength of Ca-limited alginate gels made in situ. Hydrobiologia. 1993;260/261:563–569. doi: 10.1007/BF00049071. [DOI] [Google Scholar]
- 13.Smidsrod O, Haug A. Properties of poly (1, 4-hexauronates) in gel state. II. Comparison of gels of different chemical composition. Acta Chem Scand. 1972;26:79–88. doi: 10.3891/acta.chem.scand.26-0079. [DOI] [Google Scholar]
- 14.Mancini M, Moresi M, Rancini R. Mechanical properties of alginate gels: empirical characterisation. J Food Eng. 1999;39:369–378. doi: 10.1016/S0260-8774(99)00022-9. [DOI] [Google Scholar]
- 15.Kakita H, Kamishima H. Some properties of alginate gels derived from algal sodium alginate. J Appl Phycol. 2008;20:543–549. doi: 10.1007/s10811-008-9317-5. [DOI] [Google Scholar]
- 16.Mancini M, Moresi M, Rancini R. Uniaxial compression and stress relaxation tests on alginate gels. J Texture Stud. 1999;30:639–657. doi: 10.1111/j.1745-4603.1999.tb00235.x. [DOI] [Google Scholar]
- 17.Peleg M, Campanella OH. The mechanical sensitivity of soft compressible testing machines. J Rheol. 1989;33:455–467. doi: 10.1122/1.550022. [DOI] [Google Scholar]
- 18.Peleg M. Review: Mechanical properties of dry cellular solid foods. Food Sci Technol Int. 1997;3:227–240. doi: 10.1177/108201329700300401. [DOI] [Google Scholar]
- 19.Draget KI, Strand B, Hartmann M, Valla S, Smidsrod O, Skjak-Braek G. Ionic and acid gel formation of epimerized alginates; the effect of AlgE4. Int J Biol Macromol. 2000;27:117–122. doi: 10.1016/S0141-8130(00)00115-X. [DOI] [PubMed] [Google Scholar]
- 20.Grasdalen H, Larsen B, Smidsrød O. A p.m.r. study of the composition and sequence of uronate residues in alginates. Carbohydr Res. 1979;68:23–31. doi: 10.1016/S0008-6215(00)84051-3. [DOI] [Google Scholar]
- 21.Grasdalen H. 1H-n.m.r. spectroscopy of alginate: sequential structure and linkage conformations. Carbohydr Res. 1983;118:255–260. doi: 10.1016/0008-6215(83)88053-7. [DOI] [Google Scholar]
- 22.Larsen B. Biosynthesis of alginate. Proc Int Seaweed Symp. 1981;10:7–34. [Google Scholar]
- 23.Stokke BT, Smidsrod O, Bruhelm P, Skjaak-Braek G. Distribution of uronate residues in alginate chains in relation to alginate gelling properties. Macromolecules. 1991;24:4637–4646. doi: 10.1021/ma00016a026. [DOI] [Google Scholar]
- 24.Stokke BT, Smidsrod O, Zanetti F, Strand B, Skjaak-Braek G. Distribution of uronate residues in alginate chains in relation to alginate gelling properties—2: enrichment of β-d-mannuronic acid and depletion of α-l-guluronic acid in sol fraction. Carbohydr Polym. 1993;21:39–46. doi: 10.1016/0144-8617(93)90115-K. [DOI] [Google Scholar]
- 25.Skják-Bræk G, Smidsrød O, Larsen B. Tailoring of alginates by enzymatic modification in vitro. Int J Biol Macromol. 1986;8:330–336. doi: 10.1016/0141-8130(86)90051-6. [DOI] [Google Scholar]