Abstract
Cochlear implant function, as assessed by psychophysical measures, varies from one stimulation site to another within a patient’s cochlea. This suggests that patient performance might be improved by selection of the best-functioning sites for the processor map. In evaluating stimulation sites for such a strategy, electrode configuration is an important variable. Variation across stimulation sites in loudness-related measures (detection thresholds and maximum comfortable loudness levels), is much larger for stimulation with bipolar electrode configurations than with monopolar configurations. The current study found that, in contrast to the loudness-related measures, magnitudes of across-site means and the across-site variances of modulation detection thresholds were not dependent on electrode configuration, suggesting that the mechanisms underlying variation in these various psychophysical measures are not all the same. The data presented here suggest that bipolar and monopolar electrode configurations are equally effective in identifying good and poor stimulation sites for modulation detection but that the across-site patterns of modulation detection thresholds are not the same for the two configurations. Therefore, it is recommended to test all stimulation sites using the patient’s clinically assigned electrode configuration when performing psychophysical evaluation of a patient’s modulation detection acuity to select sites for the processor map.
INTRODUCTION
Patients with cochlear implants show various degrees of perceptual ability for signals such as speech and music (Munson and Nelson, 2005; Gfeller et al., 2008; Wilson and Dorman, 2008). Correspondingly, there is considerable variation in perception assessed by basic psychophysical tasks including simple stimulus detection and loudness perception, discrimination of temporal features of the stimuli, and discrimination of one stimulation site from another (Donaldson et al., 1997; Donaldson and Nelson, 2000; Fu, 2002; Pfingst and Xu, 2005; Pfingst et al., 2008a).
Many individual cochlear implant users show evidence of both good and poor perception depending on the site of the stimulation in the multisite electrode array. One possible strategy for optimizing processor fitting is to identify stimulation sites for which psychophysical performance is best and increasing the contributions of those sites in the processor map (Zwolan et al., 1997; Pfingst et al., 2008b; Bierer and Faulkner, 2010).
In developing a strategy for site selection based on psychophysical data from individual stimulation sites, it is important to consider what electrode configuration to use for evaluating the stimulation sites. A prevalent hypothesis postulates that narrow bipolar stimulation or other “focused” configurations such as tripolar or phased-array configurations have the advantage of sampling a more restricted population of neurons and being able to better localize the stimulation sites where performance is best (Bierer and Faulkner, 2010; Chatterjee and Yu, 2010; Long et al., 2010).
The current study considered this hypothesis in the context of modulation detection thresholds (MDTs). MDTs were chosen as a potential candidate for evaluation of stimulation sites because most modern cochlear implants use temporal modulation of the envelopes of pulse trains to convey much of the information about speech. It is not surprising that MDTs have been found to be strongly correlated with speech recognition across subjects (Fu, 2002; Colletti and Shannon, 2005; Luo et al., 2008).
The model supporting the choice of focused electrode configurations for selection of stimulation sites is based primarily on data for psychophysical detection threshold levels (T levels). It is well known that the T levels for narrow bipolar and other “focused” electrode configurations are consistently higher than those for monopolar stimulation and that variation in T levels across stimulation sites is considerably larger for bipolar than for monopolar stimulation (Pfingst and Xu, 2004; Bierer, 2007). These facts have been taken as evidence that bipolar stimulation samples a more restricted region of the neural array and thus would be more sensitive to local variation along the array.
The idea with respect to T levels is that if more neurons are activated, less current is required to activate a sufficient population to achieve stimulus detection because more fibers are contributing to the ensemble response and∕or because the probability of activating the most sensitive neurons is greater if a larger population of fibers is sampled. Similar mechanisms might apply to MDTs. More fibers carrying partial information about the temporal properties of the signal might result in greater sensitivity to the temporal modulation.
With regard to across-site variation, the hypothesis is that if the stimulation of a given site activates a small localized population of neurons (as is assumed for bipolar stimulation), it would be sensitive to local conditions, resulting in high variance across stimulation sites. In contrast, thresholds for a broader excitation pattern (attributed to monopolar stimulation) would reflect the average response for a variety of local conditions resulting in low across-site variance. A similar mechanism could potentially apply to MDTs. However, the hypothesis was previously challenged because across-site variation in maximum comfortable loudness levels (C levels), where the size of the neural population is presumably large, is similar in magnitude to across-site variation in T levels (Pfingst and Xu, 2004).
An alternative explanation of the effect of electrode configuration on detection thresholds is that the higher T levels and the larger across-site variation in T levels under bipolar stimulation might be due in large part to the effects of electrode configuration on the rate of decline in current level as a function of distance from the electrodes (Pfingst and Xu, 2004; Pfingst et al., 2008b). Variation along the electrode array in the electrode to neuron distance could account for variation in the amount of current required to reach the threshold of the target neurons. Such variation would be larger if the current versus distance gradient were steeper. This mechanism should not affect across-site variance of MDTs because they are not measures of current levels.
To evaluate the models described above, the specific hypotheses tested in the current study were that narrow bipolar stimulation (BP + 0) would produce higher across-site means (ASMs) and greater across-site variances (ASVs) for MDTs than would monopolar (MP) stimulation. For comparison, ASMs and ASVs of T levels and C levels were determined for the same subjects and stimulation parameters.
METHOD
Subjects
Seven postlingually deafened adults fitted with Nucleus cochlear implants participated in the study. Subjects were implanted with Nucleus 24 R(CS) Contour scala-tympani electrode arrays. The Contour electrode arrays have 22 electrodes that are positioned on one side of the carrier intended to orient the current toward the modiolus. The arrays are precurved with the intention that the electrodes will lie close to the modiolus after the array is implanted. Demographic and clinical characteristics of the subjects are detailed in Table TABLE I.. The use of human subjects for this research was approved by the University of Michigan Medical School Institutional Review Board.
Table 1.
Subject demographics.
| Subject | Gender | Age at onset of profound deafness (years) | Etiology | Duration of deafness prior to implant (years) | Duration of implant use at time of testing (years) |
|---|---|---|---|---|---|
| S45 | Male | 44 | Head trauma | 1 | 6.0 |
| S46 | Female | 31 | Familial | 3 | 6.0 |
| S60 | Male | 62 | Familial | 2 | 4.8 |
| S67 | Male | 59 | Familial | <1 | 7.2 |
| S69 | Male | 61 | Noise exposure | 4 | 2.7 |
| S72 | Female | ∼5 | Enlarged vestibular aqueduct | ∼60 | 4.7 |
| S73 | Male | 50 | Unknown | 12 | 3.6 |
Independent variable
Two electrode configurations were tested: the narrowest bipolar configuration that was physically possible (BP + 0) and a monopolar configuration (MP). The BP + 0 configuration comprised stimulation between two adjacent electrodes, separated by approximately 0.64 mm center to center with no intervening electrodes. The MP configuration comprised stimulation between an electrode in the scala tympani and two extracochlear returns in parallel: one on the base of the receiver stimulator and one placed under the temporalis muscle.
Dependent variables
Two summary statistics were used to characterize data for the entire electrode array: across-site mean (ASM) and across-site variation (ASV). ASM is the average of values obtained at each individual stimulation site tested in the electrode array and ASV is the corresponding variance (i.e., mean squared deviations from the ASM). There could be up to 22 sites for MP stimulation and 21 sites for BP + 0 stimulation. However, the number of tested sites was usually slightly smaller because we did not test electrodes that had been deactivated by the clinician in the subject’s everyday processor due to undesirable sensations. Furthermore, in order to keep the number of MP sites equal to the number of BP + 0 sties, we did not include MP stimulation of electrode 22.
Hardware and software for electrical stimulation
The listeners completed psychophysical tests wearing a laboratory-owned SPrint processor (serial number 408594) connected to a Processor Control Interface. The input to the processor was generated through the Nucleus Implant Communicator software libraries (NIC1 version 3.27) and an IF5 ISA card. Listeners’ own implanted receiver∕stimulators received radio frequency signals generated by the processor, and the receiver∕stimulator then generated electrical current pulses that were transmitted to the appropriate sites in the implanted electrode array. A calibration value of each listener’s receiver∕stimulator was obtained from Cochlear Corporation and used to calculate the stimulation levels in peak microamperes. These levels were then converted to decibels of current using the formula
where x is the level in microamperes.
Psychophysical testing
Listeners completed psychophysical tests to determine thresholds (T levels), comfort levels (C levels), and modulation detection thresholds (MDTs) at all available sites in the electrode array. T and C levels were obtained using symmetric-biphasic pulses of 200 or 300 μs∕phase with an 8 μs interphase gap and a pulse rate of 250 pulses∕s. The stimulus burst duration was 500 ms presented in an on∕off duty cycle with an approximately 1050 ms interburst interval. The experiment used relatively long phase durations in order to be able to stimulate with both electrode configurations over the subjects’ complete dynamic ranges within the limited range of current amplitudes available from the implanted stimulators. The 200 μs∕phase stimuli were adequate for all subjects except S67 where 300 μs∕phase stimuli were required.
Listeners used the method of adjustment to set T levels and C levels. Each trial started with the initiation of the on∕off cycling of the stimulus. To record the T level, listeners were instructed to adjust the level of the signal up or down until it was “just barely audible.” Adjustments were made in current level units (CLUs) where 1 CLU equaled 0.176 dB of current. Subjects adjusted the current level by using the computer mouse to click on large and small boxes on the computer screen representing 5 CLU and 1 CLU increases and decreases. Listeners recorded their T level by clicking on a button when they were satisfied that the level they reached was barely audible. Once the T level was recorded, listeners began increasing the stimulus level until the C level was reached. Listeners were instructed to record a C level when they reached a level that was “the loudest they could listen to comfortably for an extended period of time.” Again, listeners adjusted the current level in 1 or 5 CLU steps until they were satisfied that they had determined the C level and then they clicked a button to record the level.
T and C level estimates were obtained in random order for all available stimulation sites and the two electrode configurations. The process was then repeated using a new randomization and the resulting two estimates were averaged. However, if the values obtained in the first two estimates differed by more than 7 CLUs, a third estimate was obtained and the two closest values were averaged. Dynamic ranges were calculated by subtracting the mean T level from the mean C level.
Modulation detection thresholds were obtained at 30% of the dynamic range (DR) of each available stimulation site for BP + 0 and MP stimulation, where DRs were in CLUs. The relatively low stimulation level was used to avoid any ceiling effects in subjects whose performance reached asymptote at moderate levels. The stimulus parameters for the modulation detection task matched those for the T and C level measurements (symmetric-biphasic pulses with a mean pulse duration of 200 or 300 μs∕phase and an interphase gap of 8 μs). The pulse rate was 250 pulses∕s and stimulus duration was 500 ms. The duration of each phase of the pulses was modulated by a 10 Hz sinusoid which started and ended at zero phase. The positive and negative phases of the pulses were modulated equally to maintain charge balance while the interphase gap was held constant. Phase duration modulation rather than amplitude modulation was used for these experiments because the implanted stimulators allowed finer control of charge per phase when phase duration was modulated compared to when amplitude was modulated.
The modulation index (m) was defined as:
where PDmax and PDmin are the maximum and minimum phase durations, respectively. We report modulation values in dB re 100% modulation (i.e., 20 log m).
MDTs were obtained using a two-interval, forced-choice procedure with flanking cues. On each trial, listeners were presented with four sequential observation intervals marked by squares on the computer screen. These squares were illuminated in sequence (left to right) as the electrical stimuli were presented to the implant. The interstimulus interval was 500 ms. The first and fourth interval contained identical unmodulated pulse trains which served as flanking cues. One of the other intervals (interval 2 or interval 3, chosen at random on each trial) also contained this unmodulated signal. The modulated pulse train occurred in the remaining interval. Listeners were instructed to choose the interval (interval 2 or interval 3) containing the stimulus that sounded different from the other three. Selections were made by using the computer mouse to click on the desired square.
A two-down, one-up adaptive procedure (Levitt, 1971) was used, starting with a modulation depth of 50% and ending when 14 reversals were recorded. Modulation depth was increased or decreased in steps of 6 dB to the first two reversals, 2 dB for the next two reversals, and 1 dB for the next 10 reversals. The MDT was defined as the mean of the modulation depths at the last eight reversal points. MDTs were measured in each listener at all available stimulation sites and at both electrode configurations in random order and then the measurements were repeated with a new randomization. The resulting two estimates were averaged. However, if the values obtained in the first two estimates differed by more than 7 dB, a third estimate was obtained and the two closest values were averaged.
RESULTS
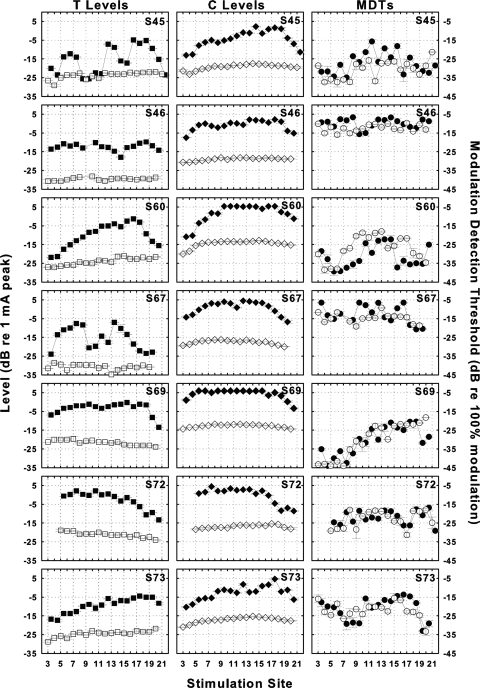
Across-site patterns of T levels, C levels and MDTs for BP + 0 stimulation and MP stimulation for the seven subjects are shown in Fig. 1. T levels (left column) and C levels (middle column) were higher for BP + 0 stimulation (filled symbols) than for MP stimulation (open symbols) with the exception of T levels at a few sites for S45. ASVs of T and C levels were always larger for BP + 0 stimulation than for MP stimulation as detailed below. MDTs at 30% DR (right column) were similar for the two configurations with the exception of S60 where MDTs for MP stimulation were higher across several consecutive stimulation sites in two regions of the array. Importantly, the ASVs of the MDTs were similar in most cases.
Figure 1.
Across-site patterns for T levels (left column), C levels (middle column) and MDTs (right column) for BP + 0 (filled symbols), and MP (open symbols) stimulation for the seven subjects (one subject per row). Means and ranges of MDTs for the two electrode configurations at each stimulation site are shown. Subject identification numbers are shown in the upper-right corner of each panel. Stimulation sites were numbered from base to apex with 1 being the most basal sites. For MP stimulation data are plotted along the abscissa at the number of the scala tympani electrode. For BP + 0 stimulation, data are plotted on the abscissa between the numbers of the two adjacent scala tympani electrodes. The left ordinate label applies to the left two columns and the right ordinate label applies to the right column.
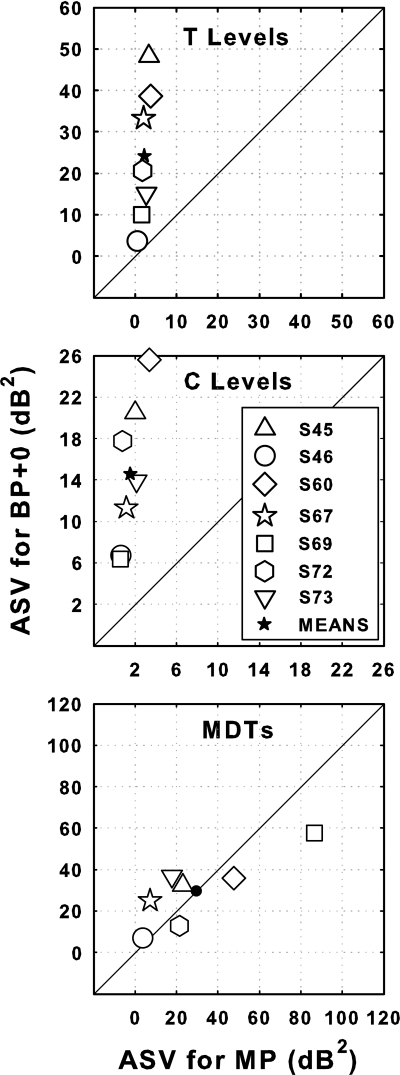
The ASVs for the data shown in Fig. 1 are compared for BP + 0 vs MP stimulation in Fig. 2. For T levels (top panel) and C levels (middle panel), the ASV values were larger for BP + 0 stimulation (ordinate) than for MP stimulation (abscissa) for all seven subjects. The mean ASV in T levels for BP + 0 stimulation was 10.77 times larger than that for MP stimulation and for C levels the corresponding ratio was 9.53 Table TABLE II.. In contrast, for MDTs at 30% DR, the effects of electrode configuration on ASVs were relatively small and not consistent across subjects (Fig. 2, bottom panel). Four of the subjects showed larger ASVs for BP + 0 stimulation and three showed larger ASVs for MP stimulation. The across-subject mean ASV values for MDTs for the two configurations (shown by the filled circle) were nearly identical (29.7 dB2 for MP and 29.6 dB2 for BP + 0).
Figure 2.
Scatter plots comparing across-site variances (ASVs) of T levels (top panel), C levels (middle panel) and MDTs (bottom panel) for BP + 0 (ordinate), and MP (abscissa) stimulation for the seven subjects (open symbols). Mean ASV for the seven subjects for BP + 0 and MP stimulation are shown by filled symbols. Filled stars indicate statistically significant differences between the means for BP + 0 vs MP (p < 0.01). Filled circles indicate that the differences were not statistically significant (p > 0.01).
Table 2.
Average across-site variances (dB2) of T levels and C levels for the two electrode configurations.
| BP + 0 | MP | Ratio BP + 0∕MP | |
|---|---|---|---|
| T Levels | 24.23 | 2.25 | 10.77 |
| C Levels | 14.60 | 1.53 | 9.53 |
| Ratio T∕C | 1.66 | 1.47 |
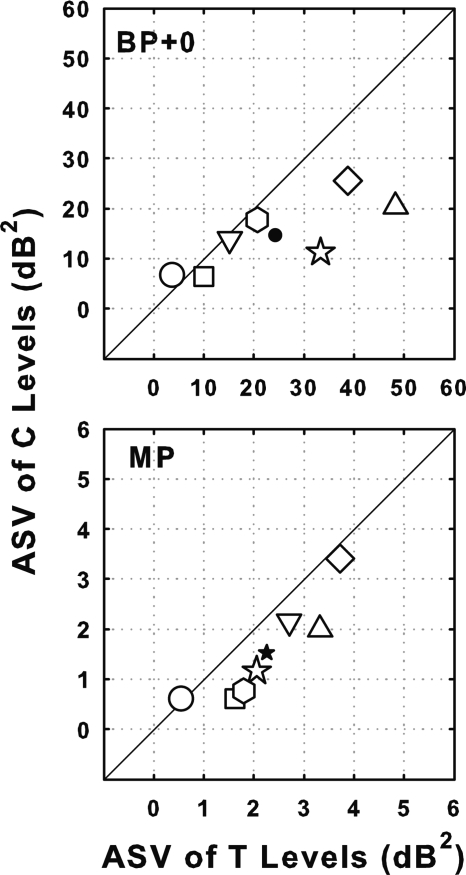
ASVs of C levels were lower in most cases than those of T levels (Fig. 3). However the ratios of the ASVs for T levels to the ASVs for C levels for BP + 0 and MP stimulation (1.66 and 1.47 for BP + 0 and MP, respectively) were small compared to the ratios of ASVs for BP + 0 to the ASVs for MP stimulation (10.77 and 9.53 for T levels and C levels respectively; Table TABLE II.).
Figure 3.
Scatter plot comparing ASV of T levels with that of C levels for BP + 0 (top panel) and MP (bottom panel) stimulation for the seven subjects. Symbols are the same as those used in Fig. 2.
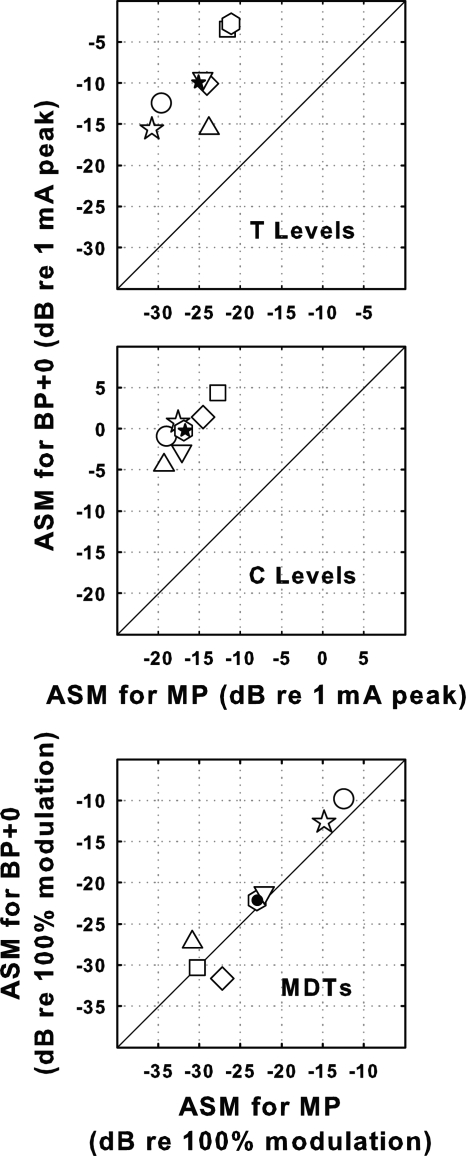
The effects of electrode configuration on ASMs of MDTs at 30% DR were quite different from the effects of electrode configuration on the ASMs of T and C levels (Fig. 4). For T levels, the ASMs for BP + 0 stimulation were an average of 15.2 dB higher than those for MP stimulation, and C levels for BP + 0 stimulation were an average of 16.5 dB higher than those for MP stimulation. In contrast, for MDTs the ASMs were nearly identical in most cases (lower panel of Fig. 4; mean difference of 0.8 dB).
Figure 4.
Scatter plots comparing across-site means (ASMs) of T levels (top panel), C levels (middle panel), and MDTs (bottom panel) for BP + 0 and MP stimulation for the seven subjects. Symbols are the same as those used in Fig. 2.
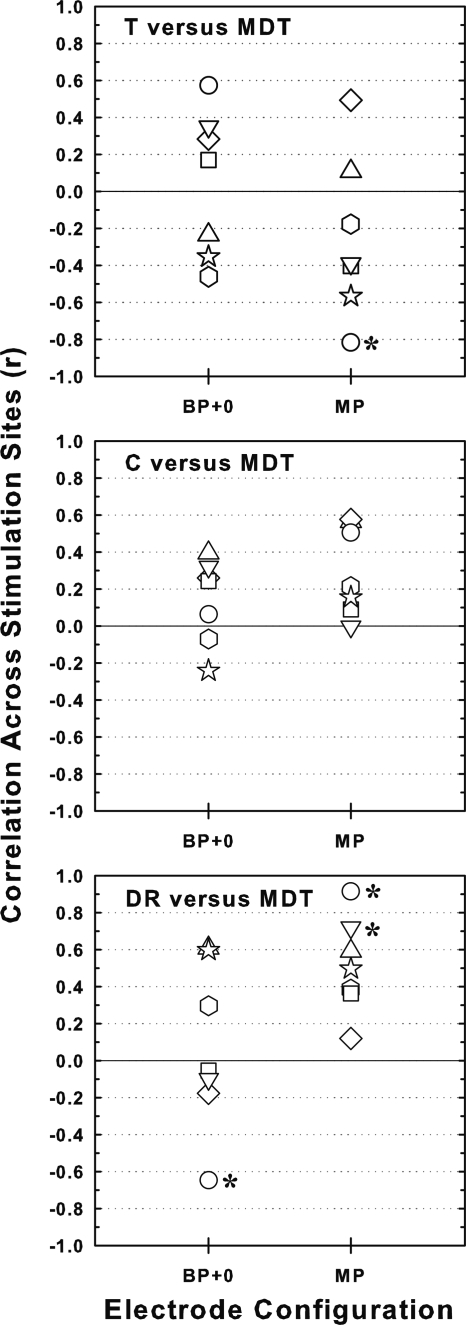
Consistent with previously published results (Pfingst et al., 2008a), the loudness related measures (T levels, C levels and DRs) were not reliable predictors of MDTs for most subjects. Correlations of MDTs with the loudness-related measures were highly variable across subjects for both BP + 0 and MP stimulation (Fig. 5). They were statistically significant for only a few cases and then for only one of the two electrode configurations.
Figure 5.
Correlations across stimulation sites of MDTs with three loudness-related measures: T levels in the top panel, C levels in the middle panel, and dynamic ranges (DRs) in the bottom panel. Correlations for BP + 0 stimulation are shown on the left and those for MP stimulation are shown on the right. Open symbols identify the individual subjects (see legend in Fig. 2). Asterisks indicate statistically significant correlations (p < 0.01).
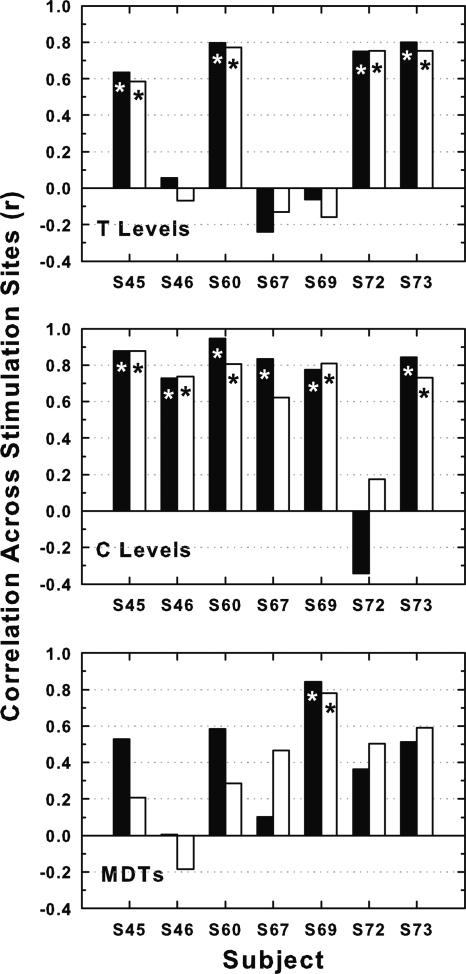
For T levels, C levels, and MDTs, the across-site patterns for BP + 0 stimulation were similar to those for MP stimulation in some cases, but they were never identical (Fig. 1). To compare the patterns quantitatively we computed across-site correlations for the two configurations (Fig. 6). Because the BP + 0 configuration utilized two intrascalar electrodes and the MP configuration used only one, we computed these correlations twice: once comparing values for the BP + 0 sites with those for the MP sites corresponding in locations to the basal members of the BP + 0 pairs (filled bars in Fig. 6) and once using the MP sites corresponding in location to the apical members of the BP + 0 pairs (open bars in Fig. 6). The across-site correlations of these measures for the bipolar and monopolar configurations were never perfect. They were statistically significant in some but not all cases. For the MDTs, the correlations were statistically significant in only one subject.
Figure 6.
Correlations across stimulation sites of psychophysical measures (T levels in the top panel, C levels in the middle panel and MDTs in the bottom panel) for BP + 0 stimulation with those for MP stimulation for each of the seven subjects (abscissa). Since the BP + 0 stimulation sites used two electrodes in the scala tympani, two correlations were determined: One with the MP electrodes corresponding in locations to the more basal of the two BP + 0 electrodes (filled bars) and one with the MP electrodes at the locations of the more apical of the two BP + 0 electrodes (open bars). Asterisks indicate statistically significant correlations (p < 0.01).
DISCUSSION
A popular hypothesis underlying the choice of narrow bipolar and other focused electrode configurations for assessment of individual cochlear implant stimulation sites is that focused configurations sample a more localized set of neurons and thus are more sensitive to local conditions than is the monopolar configuration. The results of the experiments reported here as well as considerations based on a number of previously published studies challenge the broad application of this model.
One concern is that focused configurations might not always stimulate a more restricted population of neurons than monopolar configurations. Focused configurations require more current than monopolar configurations to reach a given level of loudness and there is greater current spread at high current levels, which might counter the restrictive effects of the configurations on current spread. In human subjects the evidence that bipolar stimulation activates a more restricted region of the neural array than monopolar stimulation is mixed (Boex et al., 2003; Cohen et al., 2003; Chatterjee et al., 2006; Kwon and van den Honert, 2006; Nelson et al., 2008).
The lack of any consistent effect of electrode configuration on the ASMs or ASVs of MDTs (Figs. 24) would be hard to explain if one assumed that the MDTs were based on the size of the activated population and that the population size was markedly different for the two tested electrode configurations. An alternative interpretation is that the neural populations sampled by the two configurations are similar in size and that the ASMs and ASVs of the MDTs resulted from local differences in the temporal properties of the activated neurons, which are likely to be affected by local pathology such as demyelination.
Even if electrode configuration does affect the spatial extent of neural activation, this might not be sufficient to appreciably influence variance in psychophysical measures across stimulation sites. In the current experiment, as in a previous study (Pfingst and Xu, 2004), we estimated the effects of activation extent on ASV by comparing ASV in loudness at two levels: T levels and C levels. Because increases in electrical-stimulus level are known to result in large increases in the extent of neural activation (Bierer and Middlebrooks, 2002; Snyder et al., 2008), we hypothesized that C levels would show smaller ASVs than T levels. For BP + 0 stimulation we found lower ASV for C levels than for T levels in many cases, particularly where ASV was relatively high, but this result was not consistent across all subjects and the differences between T levels and C levels in mean ASV were not statistically significant (top panel of Fig. 3). For MP stimulation in both studies, the mean ASV was statistically significantly lower for C levels than for T levels (bottom panel of Fig. 3). However, in all cases, the ratio of the T-level ASV to the C-level ASV was relatively small compared to the ratio of BP + 0 T- or C-level ASV to MP T- or C-level ASV (Table TABLE II.). This suggests that the effect of extent of activation on ASV is weak relative to other possible effects of electrode configuration.
One possible condition contributing to the effects of electrode configuration on ASM and ASV of the T levels is variation in the distance from the electrodes to the neurons, as suggested by Pfingst and Xu (2004). The theory is that the effect of this distance on threshold and loudness levels is greater for BP + 0 stimulation than for MP stimulation because the current versus distance gradients are steeper for BP + 0 stimulation. Variables that can contribute to those distances include (1) the distances from the electrodes to the modiolar wall, which depends on medial-lateral position of the electrode array in the scala tympani; (2) the distance from the modiolar wall to the nearest excitable neurons, which varies as a function of nerve loss and∕or conditions that affect the sensitivity of the neurons; and (3) the current path from the electrodes to the neurons, which can be lengthened by obstructions such as the presence of newly generated bone. Some of the anatomical and physiological variables mentioned above (those in categories 2 and 3) are difficult to quantify. However, distances from the electrodes to the modiolar wall have been quantified in animals (Shepherd et al., 1993) and in humans (Cohen et al., 2001; Long et al., 2010), and have been shown to be related to threshold levels.
The relative decrease in current level as a function of distance from the electrodes to the sites of neural activation should be independent of absolute stimulation level, so this mechanism could apply equally to T levels and C levels. Importantly however, since this is a mechanism that affects levels needed for neural activation and perception, it is not likely to affect MDTs because the MDTs are not a measure of level. The levels for the MDT measurements were set to 30% of the dynamic range before the measurements were made, so the gradient of current as a function of electrode configuration should not have had a significant effect on the MDT values.
The discussion above leads to the conclusion that the means and variances of MDTs probably involve mechanisms partially or entirely different from those affecting means and variances of T levels and C levels. Consistent with this conclusion, across-site patterns of MDTs do not usually match those for T and C levels (Figs. 15).
Finally, the across-site patterns of performance for various psychophysical measures are not the same for BP + 0 and MP stimulation (Figs. 16). This suggests that the populations of neurons that are activated by these two configurations at a similar location in the electrode array are sufficiently different that they result in different levels of perceptual detection and discrimination. Thus, although both BP + 0 and MP stimulation are effective in finding sites that are good and those that are poor for MDTs, the particular across-site pattern of those sites is specific to the electrode configuration used. This suggests that to obtain results applicable to a patient’s auditory prosthesis, it would make sense to use the electrode configuration that is used in the patient’s everyday processor.
ACKNOWLEDGMENTS
The author expresses appreciation to the research subjects for their cheerful participation in these studies, to Catherine S. Thompson for recruitment and testing of subjects, to Gina L. Su for assistance with data processing and graphing, and to Thyag Sadasiwan for programming. The author also appreciates Soha Garadat and Ning Zhou’s insightful comments on earlier drafts of this manuscript. This work was supported by NIH NIDCD Grants R01 DC004312, R01 DC010786, and P30 DC005188.
References
- Bierer, J. A. (2007). “Threshold and channel interaction in cochlear implant users: evaluation of the tripolar electrode configuration,” J. Acoust. Soc. Am. 121, 1642–1653. 10.1121/1.2436712 [DOI] [PubMed] [Google Scholar]
- Bierer, J. A. and Faulkner, K. F. (2010). “Identifying Cochlear Implant Channels with Poor Electrode-Neuron Interface: Partial Tripolar, Single-Channel Thresholds and Psychophysical Tuning Curves,” Ear Hear. 31, 247–258. 10.1097/AUD.0b013e3181c7daf4 [DOI] [PMC free article] [PubMed] [Google Scholar]
- Bierer, J. A. and Middlebrooks, J. C. (2002). “Auditory cortical images of cochlear-implant stimuli: Dependence on electrode configuration,” J. Neurophysiol. 87, 478–492. [DOI] [PubMed] [Google Scholar]
- Boex, C., Kos, M. I., and Pelizzone, M. (2003). “Forward masking in different cochlear implant systems,” J. Acoust. Soc. Am. 114, 2058–2065. 10.1121/1.1610452 [DOI] [PubMed] [Google Scholar]
- Chatterjee, M., Galvin, J. J.3rd, Fu, Q. J., and Shannon, R. V. (2006). “Effects of stimulation mode, level and location on forward-masked excitation patterns in cochlear implant patients,” J. Assoc. Res. Otolaryngol. 7, 15–25. 10.1007/s10162-005-0019-2 [DOI] [PMC free article] [PubMed] [Google Scholar]
- Chatterjee, M. and Yu, J. (2010). “A relation between electrode discrimination and amplitude modulation detection by cochlear implant listeners,” J. Acoust. Soc. Am. 127, 415–426. 10.1121/1.3257591 [DOI] [PMC free article] [PubMed] [Google Scholar]
- Cohen, L. T., Richardson, L. M., Saunders, E., and Cowan, R. S. (2003). “Spatial spread of neural excitation in cochlear implant recipients: Comparison of improved ECAP method and psychophysical forward masking,” Hear. Res. 179, 72–87. 10.1016/S0378-5955(03)00096-0 [DOI] [PubMed] [Google Scholar]
- Cohen, L. T., Saunders, E., and Clark, G. M. (2001). “Psychophysics of a prototype peri-modiolar cochlear implant electrode array,” Hear. Res. 155, 63–81. 10.1016/S0378-5955(01)00248-9 [DOI] [PubMed] [Google Scholar]
- Colletti, V. and Shannon, R. V. (2005). “Open set speech perception with auditory brainstem implant?” Laryngoscope 115, 1974–1978. 10.1097/01.mlg.0000178327.42926.ec [DOI] [PubMed] [Google Scholar]
- Donaldson, G. S., Viemeister, N. F., and Nelson, D. A. (1997). “Psychometric functions and temporal integration in electric hearing,” J. Acoust. Soc. Am. 101, 3706–3721. 10.1121/1.418330 [DOI] [PubMed] [Google Scholar]
- Donaldson, G. S. and Nelson, D. A. (2000). “Place-pitch sensitivity and its relation to consonant recognition by cochlear implant listeners using the MPEAK and SPEAK speech processing strategies,” J. Acoust. Soc. Am. 107, 1645–1658. 10.1121/1.428449 [DOI] [PubMed] [Google Scholar]
- Fu, Q.-J. (2002). “Temporal processing and speech recognition in cochlear implant users,” NeuroReport 13, 1635–1639. 10.1097/00001756-200209160-00013 [DOI] [PubMed] [Google Scholar]
- Gfeller, K., Oleson, J., Knutson, J. F., Breheny, P., Driscoll, V., and Olszewski, C. (2008). “Multivariate predictors of music perception and appraisal by adult cochlear implant users,” J. Am. Acad. Audiol. 19, 120–134. 10.3766/jaaa.19.2.3 [DOI] [PMC free article] [PubMed] [Google Scholar]
- Kwon, B. J. and van den Honert, C. (2006). “Effect of electrode configuration on psychophysical forward masking in cochlear implant listeners,” J. Acoust. Soc. Am. 119, 2994–3002. 10.1121/1.2184128 [DOI] [PubMed] [Google Scholar]
- Levitt, H. (1971). “Transformed up-down methods in psychoacoustics,” J. Acoust. Soc. Am. 49, 467–477. 10.1121/1.1912375 [DOI] [PubMed] [Google Scholar]
- Long, C., Holden, T., Parkinson, W., Smith, Z., and van den Honert, C. (2010). “Towards a measure of neural survival in recipients of cochlear implants: Focused-stimulation thresholds, speech understanding, and electrode locations,” Assoc. Res. Otolaryngol. Abst. 33, p.310, abstract # 905. [Google Scholar]
- Luo, X., Fu, Q. J., Wei, C. G., and Cao, K. L. (2008). “Speech recognition and temporal amplitude modulation processing by Mandarin-speaking cochlear implant users,” Ear Hear. 29, 957–970. 10.1097/AUD.0b013e3181888f61 [DOI] [PMC free article] [PubMed] [Google Scholar]
- Munson, B. and Nelson, P. B. (2005). “Phonetic identification in quiet and in noise by listeners with cochlear implants,” J. Acoust. Soc. Am. 118, 2607–2617. 10.1121/1.2005887 [DOI] [PubMed] [Google Scholar]
- Nelson, D. A., Donaldson, G. S., and Kreft, H. (2008). “Forward-masked spatial tuning curves in cochlear implant users,” J. Acoust. Soc. Am. 123, 1522–1543. 10.1121/1.2836786 [DOI] [PMC free article] [PubMed] [Google Scholar]
- Pfingst, B. E., Burkholder-Juhasz, R. A., Xu, L., and Thompson, C. S. (2008a). “Across-site patterns of modulation detection in listeners with cochlear implants,” J. Acoust. Soc. Am. 123, 1054–1062. 10.1121/1.2828051 [DOI] [PMC free article] [PubMed] [Google Scholar]
- Pfingst, B. E., Burkholder-Juhasz, R. A., Zwolan, T. A., and Xu, L. (2008b). “Psychophysical assessment of stimulation sites in auditory prosthesis electrode arrays,” Hear. Res. 242, 172–183. 10.1016/j.heares.2007.11.007 [DOI] [PMC free article] [PubMed] [Google Scholar]
- Pfingst, B. E. and Xu, L. (2004). “Across-site variation in detection thresholds and maximum comfortable loudness levels for cochlear implants,” J. Assoc. Res. Otolaryngol. 5, 11–24. 10.1007/s10162-003-3051-0 [DOI] [PMC free article] [PubMed] [Google Scholar]
- Pfingst, B. E. and Xu, L. (2005). “Psychophysical metrics and speech recognition in cochlear implant users,” Audiol. Neurootol. 10, 331–341. 10.1159/000087350 [DOI] [PMC free article] [PubMed] [Google Scholar]
- Shepherd, R. K., Hatsushika, S., and Clark, G. M. (1993). “Electrical stimulation of the auditory nerve: the effect of electrode position on neural excitation,” Hear. Res. 66, 108–120. 10.1016/0378-5955(93)90265-3 [DOI] [PubMed] [Google Scholar]
- Snyder, R. L., Middlebrooks, J. C., and Bonham, B. H. (2008). “Cochlear implant electrode configuration effects on activation threshold and tonotopic selectivity,” Hear. Res. 235, 23–38. 10.1016/j.heares.2007.09.013 [DOI] [PMC free article] [PubMed] [Google Scholar]
- Wilson, B. S. and Dorman, M. F. (2008). “Cochlear implants: a remarkable past and a brilliant future,” Hear. Res. 242, 3–21. 10.1016/j.heares.2008.06.005 [DOI] [PMC free article] [PubMed] [Google Scholar]
- Zwolan, T. A., Collins, L. M., and Wakefield, G. H. (1997). “Electrode discrimination and speech recognition in postlingually deafened adult cochlear implant subjects,” J. Acoust. Soc. Am. 102, 3673–3685. 10.1121/1.420401 [DOI] [PubMed] [Google Scholar]


