

Abstract
Cofactor biosynthetic pathways represent a rich source of potential antibiotic targets. The second step in biotin biosynthesis is performed by BioA, a pyridoxal 5′-phosphate (PLP) dependent enzyme. This enzyme has been confirmed as a candidate target in Mycobacterium tuberculosis; however, the current bioassay used to measure BioA activity is cumbersome and low-throughput. Here we describe the design, development and optimization of a continuous coupled fluorescence displacement assay to measure BioA activity. In this coupled assay, BioD converts the product of the BioA–catalyzed reaction into dethiobiotin, which is subsequently detected by displacement of a fluorescently labeled dethiobiotin probe from streptavidin. The assay was further adapted to a high-throughput screening format and validated against the LOPAC library.
Keywords: fluorescence displacement assay, biotin, dethiobiotin, high-throughput screening, mycobacterium tuberculosis
Introduction
Mycobacterium tuberculosis (Mtb), the etiological agent of tuberculosis (TB), is the leading cause of bacterial infectious disease mortality.[1] The first-line drugs isoniazid, rifampin, ethambutol, and pyrazinamide used for TB chemotherapy were discovered more than forty years ago.[2] The development of multi-drug resistant TB strains coupled with an increased understanding of the genetic and metabolic requirements for survival and virulence of Mtb has led to a resurgence in tuberculosis drug development over the last decade. Cofactor biosynthetic pathways are a rich source of potential drug targets because of their essential nature and lack of the corresponding mammalian pathways.[3] The genome sequence of Mtb H37Rv, the model virulent laboratory stain, revealed it has the full metabolic potential to synthesize all vitamins and cofactors.[4] Biotin (vitamin H) is the cofactor responsible for activation of carbon dioxide in acyl-CoA carboxylases involved in fatty acid metabolism and pyruvate carboxylase in gluconeogenesis.[5] Biotin biosynthesis is required for survival of Mtb in vitro and in vivo; furthermore, biotin starvation of an Mtb biotin auxotroph led to cell death.[6, 7] Thus, biotin biosynthesis represents an extremely attractive pathway for the development of new antitubercular agents.
Biotin is synthesized from pimeloyl-CoA in bacteria and M. tuberculosis contains all four genes necessary to synthesize biotin from this CoA precursor, namely bioF (Rv1569), bioA (Rv1568), bioD (Rv1570), and bioB (Rv1589).[4, 5] The first step in the pathway is catalyzed by BioF (KAPA synthase), which condenses pimeloyl-CoA 1[8] and alanine to afford (8S)-8-amino-7-oxononanoic 2, whose more common trivial name is 7-keto-8-aminopelargonic acid (KAPA) (Figure 1).[9, 10] In the second step, KAPA 2 is transaminated to (7R, 8S)-7,8-diaminononanoic acid 3, also known as 7,8-diaminopelargonic acid (DAPA), by BioA (DAPA synthase), a pyridoxal 5′-phosphate (PLP) dependent enzyme that uses S-adenosyl methionine (SAM) as the amino donor.[11–13] DAPA 3 is then carboxylated in an ATP dependent manner to afford the imidazolidin-2-one ring of dethiobiotin 4 by BioD (dethiobiotin synthetase), one of the few carboxylating enzymes that do not use biotin.[7, 14, 15] The final step is performed by the iron-sulfur protein BioB (biotin synthase), which catalyzes insertion of sulfur into dethiobiotin 4 to afford biotin 5.[16] The second step catalyzed by BioA is particularly attractive from the standpoint of inhibitor design since BioA has been structurally and functionally characterized.[7, 13] Additionally, the natural product amiclenomycin has been reported as a mechanism-based time-dependent inhibitor of BioA and represents an excellent lead compound for further structure–activity analysis.[17–20] The development of a robust biochemical assay to measure BioA activity and inhibition is a prerequisite to identification and evaluation of potential inhibitors.
Figure 1.

Biotin biosynthetic pathway from BioA to BioF.
There are several assays that are currently used to detect the biotin precursors DAPA and dethiobiotin and thus measure BioA and BioD activity. The biodisc agar plate assay as originally described by Stoner and Eisenberg was used to kinetically characterize BioA and BioD from M. tuberculosis.[20, 21] This assay employs E. coli biotin auxotrophs wherein the bioA or bioD genes have been inactivated. These strains fail to grow unless they are chemically complemented with DAPA or dethiobiotin. In practice, individual reaction solutions along with a standard dilution series of DAPA and dethiobiotin are spotted onto disks and zones of bacterial growth around the disks are measured. Although the biodisc assay is highly sensitive, capable of measuring DAPA and dethiobiotin in picomolar quantities, the assay is low throughput and requires the growth of specialized E. coli mutant strains. Recently, a continuous coupled spectroscopic assay has been described for BioD using pyruvate kinase and lactate dehydrogenase along with the substrates phosphoenolpyruvate and NADH that measures consumption of NADH by following the change in absorbance at 340 nm.[7] While this assay could also be used to monitor BioA activity using BioD as the third coupling enzyme, the pyruvate kinase–lactate dehydrogenase coupling system is problematic for monitoring enzymes such as BioA with low catalytic activity (kcat < 1 min−1) due to the spontaneous decomposition of NADH that results in an appreciable background signal relative to the enzyme catalyzed reaction. Additionally, the absorbance-based assay is less sensitive and more susceptible to interference as a result of the low wavelength of detection as well as inhibition of any of the three coupling enzymes. Herein we report the design, development, optimization, and validation of a coupled continuous fluorescence displacement assay for BioA and BioD that features a fluorescently labeled dethiobiotin analog in conjunction with streptavidin to detect formation of dethiobiotin.
Materials and Methods
Materials and General Procedures
Chemically competent E. coli Mach1 and BL21 STAR (DE3), plasmid pENTR/TEV D-TOPO, and Gateway LR Clonase were purchased from Invitrogen (Carlsbad, CA, USA). The E. coli strain BL21-CodonPlus (DE3)-RP was purchased from EMD biosciences (Gibbstown, NJ). Restriction enzymes were purchased from New England Biolabs (Ipswich, MA, USA). PrimeSTAR HS DNA polymerase was purchased from TAKARA Bio Inc (Otsu, Shiga, Japan). Primers for PCR were obtained from Integrated DNA Technologies (Coralville, IA, USA). The expression vector pET28b was purchased from addgene EMD biosciences (San Diego, CA, USA). Ni-NTA Agarose, and DNA purification/isolation kits were obtained from Qiagen Sciences (Germantown, MD, USA). SAM and PLP as well as all biological buffers and components were purchased from Sigma Aldrich (St. Louis, MO, USA). Enzymatic activity, kinetic parameters, and inhibition assays were performed on a molecular devices (Sunnyvale, CA, USA) M5e multi-mode plate reader. Stopped-flow experiments were performed on an Applied Photophysics SX20 stopped flow at 20 °C. All reagents for chemical synthesis were purchased from commercial sources (Sigma-Aldrich, Acros) unless otherwise noted. Dry DMF, THF and CH2Cl2 were obtained from an anhydrous solvent dispensing system (J. C. Meyer). 1H and 13C spectra were recorded on a Varian 600 MHz spectrometer. Proton chemical shifts are reported in ppm from an internal standard of residual methanol (3.34 ppm) or DMSO (2.54 ppm). The high-resolution mass spectrum of the final compound was obtained on an Agilent TOF II TOF/MS instrument equipped with an MMI interface. Optical rotation values were obtained on a Rudoldf Autopol III Polarimeter. Melting points were measured on an electrothermal Mel-Temp manual melting point apparatus and are uncorrected. Preparative HPLC was performed on a Phenomenex Gemini C18 110A column (10.0 × 250 mm, 10 μm particle size) operating at 4.0 mL/min with detection at 494 nm.
Preparation of overexpression constructs
BioA was PCR amplified from H37Rv genomic DNA using PrimeSTAR polymerase (Takara) and the primers CACCCATATGGCTGCGGCGACTGGC and GAAGCTTCATGGCAGTGAGCCTACGAG, containing an NdeI site in the forward primer and a HindIII site in the reverse primer (underlined). The PCR product was cloned into pENTR/TEV D-TOPO (Invitrogen) as a PCR capture vector and then subcloned into pET28b using the restriction sites designed into the PCR primers. The resulting vector was digested with XbaI and HindIII to move bioA along with the RBS and His tag from pET28 into pUC18, creating a vector under the control of the lac promoter to yield pCDD126. E. coli bioD was amplified from genomic DNA using the primers CACCCATATGCTCGTGAGTAAACGTTATTTTG and GAAGCTTCTACAACAAGGCAAGGTTTATG. After cloning into pENTR/TEV D-TOPO bioD was cloned into pET28b to create an N-terminally His-tagged BioD (pCDD127).
Overproduction and purification of BioA and BioD
pCDD126 was transformed into BL21(DE3) RP (Stratagene) for protein expression of BioA. BioA was expressed and purified essentially as described by Mann and co-workers.[13] Luria-Bertani (LB) cultures supplemented with 100 μg/mL ampicillin and 50 μg/mL chloramphenicol were grown at 37 °C for 16 h, then centrifuged and the cell pellet was frozen at −80 °C to aid in cell lysis. Cell pellets were thawed in lysis buffer (50 mM HEPES, 300 mM NaCl, 10 mM imidazole, pH 8.0) and sonicated on a Branson sonifier 250 (4 × 2 min, 30% duty cycle, power 7). The lysate was centrifuged for 10 min at 45,000 × g and supplemented with 100 μM pyridoxal phosphate (PLP). To the supernatant, 1 mL of 50 % nickel-nitriloacetic acid (Ni-NTA) Agarose resin in 20% ethanol (Qiagen) was added and the mixture was incubated end-over-end for 1 h at 4 °C. The solution was loaded onto a gravity flow column and the flow through was collected. The resin was washed with 15 mL wash buffer (50 mM HEPES, 300 mM NaCl, 20 mM imidazole, pH 8.0) then eluted with 2.5 mL elution buffer (50 mM HEPES, 300 mM NaCl, 250 mM imidazole, pH 8.0). The buffer was exchanged using a PD-10 column (GE Healthcare) into storage buffer (50 mM Tris pH 8.0, 10 mM 2-mercaptoethanol, 100 μM PLP) and frozen at −80 °C. The protocol yielded approximately 1.5 mg of protein per liter of culture.
pCDD127 encoding an N-terminally His-tagged BioD was transformed into BL21 STAR (DE3). Expression was carried out in 100 mL ZYM-5052[22] containing 50 μg/mL kanamycin inoculated with 100 μL of overnight culture. Cultures were grown for 8 h at 37 °C followed by 12 h at 30 °C. Overnight expression cultures were centrifuged and frozen followed by rapid thawing in lysis buffer. Cells were sonicated, cleared, and purified as described above. Protein was extracted using 2 mL Ni-NTA and PLP was left out of the lysis buffer. The protein was eluted using 3 mL of elution buffer, discarding the first 0.5 mL and the buffer was exchanged into BioD storage buffer (20 mM HEPES, pH 7.0, 10% glycerol). The procedure yielded 420 mg of protein per liter of culture.
Computational modeling
All modeling was carried out using the Schrodinger modeling package.[23] The structure of homo tetrameric streptavidin in complex with biotin (PDB:3MG5) was obtained from the Protein Data Bank.[24] Modeling of compound 6 was carried out by first modeling of dethiobiotin and fluorescein into each of the bound biotin in the X-ray structure, followed by the incorporation of the polyethylene glycol linker region and finally restraint energy minimization of all the amino residues within 10 Å of compound 6 using OPLSAA 2005 forcefield.[25]
Synthesis of Fluorescein Labeled Dethiobiotin 6
N1-[3-(2-{2-[3-(tert-Butoxycarbonyl)aminopropoxy]ethoxy}ethoxy)propyl]dethiobiotinamide (9)
To a solution of 7[26] (79.5 mg, 0.256 mmol, 1.0 equiv) and 8 (Quanta Biodesign, Powell, OH, USA, 122.8 mg, 0.383 mmol, 1.5 equiv) in dry DMF (5.0 mL) was added triethylamine (71.4 μL, 0.512 mmol, 2.0 equiv). The reaction was stirred 16 h at 23 °C, then concentrated. Purification by flash chromatography (0–30% MeOH/EtOAc) on silica gel afforded the title compound (70 mg, 53%) as a colorless oil: Rf 0.4 (30% MeOH/EtOAc); 1H NMR (600 MHz, DMSO-d6) δ 0.99 (d, J = 6.6 Hz, 3H), 1.24–1.29 (m, 2H), 1.33–1.35 (m, 4H), 1.40 (s, 9H), 1.51 (p, J = 7.8 Hz, 2H), 1.64 (p, J = 6.6 Hz, 4H), 2.07 (t, J = 7.8 Hz 2H), 2.99 (t, J = 6.6 Hz, 2H), 3.10 (t, J = 6.6 Hz, 2H), 3.39–3.47 (m, 4H), 3.47–3.52 (m, 4H), 3.52–3.54 (ovlp, m, 1H), 3.54–3.60 (ovlp, m, 4H), 3.64 (p, J = 6.6 Hz, 1H), 6.15 (s, 1H), 6.34 (s, 1H), 6.77 (s, 1H), 7.75 (s, 1H); 13C NMR (600 MHz, DMSO- d6) δ 15.8, 27.0, 27.3, 29.0, 30.4, 30.5, 30.9, 31.0, 37.1, 37.9, 388, 52.8, 57.5, 70.0, 70.0, 71.4, 71.4, 71.7, 71.7, 79.9, 158.5, 166.2, 176.1; MS (ESI+) calcd for C25H49N4O7 [M + H]+ 517.36, found 517.36.
N1-(3-{2-[2-(3-Aminopropoxy)ethoxy]ethoxy}propyl)dethiobiotinamide (10)
A solution of 4 M HCl/dioxane (5.0 mL) was added to 3 (70 mg, 136 μmol) and the reaction was stirred 2 h at 23 °C. The solvent was removed in vacuo to provide pure 10 (52 mg, 92%) as a colorless oil: 1H NMR (600 MHz, CD3OD) δ 1.21 (d, J = 6.6 Hz, 3H), 1.37–1.53 (m, 4H), 1.57–1.64 (m, 2H), 1.68 (p, J = 7.8 Hz, 2H), 1.82 (p, J = 6.6 Hz, 2H), 1.95 (p, J = 6.0 Hz, 2H), 2.34 (t, J = 7.2 Hz, 2H), 3.10 (t, J = 6.0 Hz, 2H), 3.35 (t, J = 7.2 Hz, 2H), 3.54 (t, J = 6.6 Hz, 2H), 3.60–3.61 (m, 2H), 3.63–3.68 (m, 8H), 3.99 (td, J = 7.8, 6.0 Hz, 1H), 4.15 (dq, J = 6.0, 5.4 Hz, 1H); 13C NMR (600 MHz, CD3OD) δ 15.3, 27.0, 27.0, 28.2, 30.1, 30.2, 30.2, 36.2, 38.8, 40.2, 54.6, 58.9, 69.6, 70.4, 71.2, 71.2, 71.3, 71.5, 164.9, 177.4; MS (ESI+) calcd for C20H41N4O5 [M + H]+ 417.31, found 417.30.
N1-[3-[2-(2-{3-[(Fluorescein-5-yl)carbonyl]aminopropoxy}ethoxy)ethoxy]propyl}dethiobiotinamide (6)
To a solution of 10 (10 mg, 0.024 mmol, 1.0 equiv) and 11 (Invitrogen, Carlesbad, CA, USA, 14.4 mg, 0.03 mmol, 1.25 equiv) in DMF (5.0 mL) was added triethylamine (15 μL, 0.108 mmol, 4.5 equiv). The reaction was stirred for 2 h at 23 °C then concentrated in vacuo. Purification by flash chromatography (10–15% MeOH/CH2Cl2) on silica gel followed by reversed phase HPLC using a gradient of 10–70% CH3CN in H2O over 26 min. The retention time of the product was 24 min and the respective fractions were pooled and lyophilized to afford the title compound (6.0 mg, 46%) as an orange solid: Rf 0.1 (10% MeOH/CH2Cl2); 1H NMR (600 MHz, CD3OD) δ 1.09 (d, J = 6.0 Hz, 3H), 1.32–1.35 (m, 2H), 1.38–1.45 (m, 2H), 1.46–1.48 (m, 2H), 1.59–1.62 (m, 2H), 1.72 (p, J = 6.6 Hz, 2H), 1.93 (p, J = 6.6 Hz, 2H), 2.17 (t, J = 7.2 Hz, 2H), 3.23 (t, J = 7.2 Hz, 2H), 3.48 (t, J = 6.0 Hz, 2H), 3.54–3.56 (m, 4H), 3.62–3.64 (m, 6H), 3.66–3.67 (m, 2H), 3.67–3.68 (m, 1H), 3.78–3.82 (m, 1H), 6.57 (dd, J = 8.7, 2.4 Hz, 2H), 6.69 (d, J = 2.4 Hz, 2H), 6.71 (d, J = 9.0 Hz, 2H), 7.31 (d, J = 7.8 Hz, 1H), 8.16 (dd, J = 7.8, 1.8 Hz, 1H), 8.44 (s, 1H); 13C NMR (600 MHz, CD3OD) δ 15.4, 26.8, 30.3 × 4, 30.6, 36.9, 37.5, 38.6, 52.5, 57.1, 69.9, 70.2, 71.2 × 4, 102.1, 103.8 × 2, 114.2, 127.1, 127.5, 128.9, 131.2 × 2, 131.7, 137.2, 157.5 × 2, 168.8, 171.2, 173.7, 175.6 (one quaternary carbon in fluorescein moiety missing); HRMS (ESI–) calcd for C41H49N4O11 [M – H]− 773.3403, found 773.3428 (error 3.2 ppm).
Synthesis of KAPA
L-Nα-(tert-Butoxycarbonyl)-N1-(methoxy)-N1-(methyl)alaninamide (13)
Carbonyldiimidazole (CDI) (2.84 g, 17.5 mmol, 1.1 equiv) was added to a solution of N-Boc-L-Ala-OH (1) (3.0 g, 15.9 mmol, 1.0 equiv) in CH2Cl2 (50 mL) and the reaction was stirred for 1 h at 23 °C. Next, N,O-dimethylhydroxylamine hydrochloride (1.72 g, 17.6 mmol, 1.1 equiv) was added and the reaction mixture was stirred for 16 h at 23 °C. The mixture was diluted with EtOAc (200 mL) and washed successively with 1 N aqueous HCl (50 mL), saturated aqueous NaHCO3 (50 mL) and saturated aqueous NaCl (50 mL). The organic layer was dried with Na2SO4 then concentrated to afford the title compound (3.66 g, 99%) as a white solid: mp 144–145.5 °C, literature value: 144–145 °C[27]; [α]D25–26.0 (c 1.0, MeOH), literature value: [α]D25 −26.0 (c 1.0, MeOH)[27]; 1H NMR (600 MHz, CDCl3) δ 1.32 (d, 3H, J = 7.12 Hz), 1.43 (s, 9H), 3.05 (s, 3H), 3.62 (s, 3H), 4.73 (q, 1H, J = 7.12 Hz), 5.32 (br s, 1H); 13C NMR (125 MHz, CDCl3) δ 18.6, 28.4, 33.2, 46.1, 61.7, 79.3, 155.3, 172.1.[27]
Benzyl 5-oxopentanoate (15)
To a solution of NaOH in H2O (1 M, 50 mL, 50 mmol, 1.0 equiv) at 70 °C, was added δ-valerolactone (5.00 g, 50 mmol, 1.0 equiv) in one injection. The mixture was stirred 16 h at 70 °C. The solvent was evaporated in vacuo and the residue was re-dissolved in acetone (50 mL). To this solution, were added tetrabutylammonium bromide (805 mg, 2.5 mmol, 0.05 equiv) and benzyl bromide (7.13 mL, 60 mmol, 1.2 equiv). The reaction was stirred at 23 °C for 16 h until MS analysis (ESI–) indicated complete conversion of the starting material. The solvent was evaporated and the solid was partitioned between CH2Cl2 (50 mL) and saturated aqueous NH4Cl solution (50 mL). The aqueous layer was extracted with CH2Cl2 (3 × 25 mL), and the combined organic layer was washed with saturated aqueous NaCl, dried (MgSO4), filtered, and concentrated. Purification by flash chromatography (0–20% EtOAc/Hexanes) on silica gel afforded benzyl 5-hydroxypentanoate[28] (8.63 g, 83%) as a colorless oil: Rf 0.35 (80:20 Hexanes/EtOAc); 1H NMR (600 MHz, CDCl3) δ 1.54–1.64 (m, 3H), 1.75–1.80 (m, 2H), 2.41 (t, J = 7.2 Hz, 2H), 3.64 (t, J = 6.3 Hz, 2H), 5.12 (s, 2H), 7.25–7.31 (m, 5H); 13C NMR (125 MHz, CDCl3) δ 21.3, 30.7, 34.1, 62.3, 66.6, 128.3, 128.4, 128.6, 135.9, 173.8; LRMS (APCI+): 208.1.
To a suspension of pyridinium chlorochromate (2.59 g, 12 mmol, 1.2 equiv) in CH2Cl2 (50 mL) at 23 °C was added benzyl 5-hydroxypentanoate (2.08 g, 10 mmol) prepared above over 15 min. The mixture was stirred for 6 h, then the suspension was filtered over a pad of silica gel and the silica gel was washed further with CH2Cl2 (50 mL). The combined filtrate was concentrated under reduced pressure. Purification by flash chromatography (0–10% EtOAc/Hexanes) on silica gel afforded the title compound (1.81 g, 88%) as colorless oil: Rf 0.65 (80:20 Hexanes/EtOAc); 1H NMR (600 MHz, CDCl3) δ 1.95–2.10 (m, 2H), 2.35 (t, J = 6.4 Hz, 2H), 2.41 (t, J = 7.2 Hz, 2H), 7.21–7.27 (m, 2 H), 7.29–7.31 (m, 3H), 9.75 (s, 1H); 13C NMR (125 MHz, CDCl3) δ 17.3, 33.3, 42.8, 66.2, 128.5, 128.6, 128.7, 135.9, 172.9, 201.5; MS (APCI+) calcd for C12H14O3 [M]+ 206.1, found 206.1.
(S,E)-Benzyl 8-(tert-butoxycarbonylamino)-7-oxonon-5-enoate (16)
To a suspension of the Weinreb amide 13 (464 mg, 2.0 mmol, 1.0 equiv) in THF (10 mL) at −30 °C, was added i-PrMgCl (2.0 mL, 1.0 M in THF, 2.0 mmol, 2.0 equiv) over 5 min to afford a clear solution. The solution was gradually warmed to 0 °C over 1 h. In a separate flask, n-BuLi (2.0 mL, 1.6 M in hexanes, 3.2 mmol, 1.6 equiv) was added dropwise over 15 min to a solution of dimethyl methylphosphonate (372 mg, 3.0 mmol, 1.5 equiv) in THF (12 mL) at −78 °C and the resulting mixture was stirred for 1 h at −78 °C. The Weinreb amide solution prepared above was added dropwise to the lithium phosphonate solution at −78 °C and the mixture was stirred for 2 h at −78 °C then quenched with saturated aqueous NH4Cl (10 mL). The aqueous layer separated was extracted with EtOAc (8 × 3 mL). The combined organic layers were washed with saturated aqueous NaCl (20 mL), dried with MgSO4 and concentrated to afford crude 14 (505 mg, 86% yield based on 1H NMR with 13 as the principal impurity) as a waxy solid, which was used without further purification.[29]
To a suspension of NaH (75.7 mg, 60% wt in mineral oil, 1.90 mmol, 1.27 equiv) in THF (5 mL) at −30 °C was added a solution of crude 14 prepared above (505 mg, 1.72 mmol, 1.14 equiv) in THF (5 mL) dropwise over 10 min. The reaction stirred for 30 min then warmed to −20 °C. Next, a solution of 15 (309 mg, 1.5 mmol, 1.0 equiv) in THF (5 mL) was added dropwise over 10 min and the reaction was stirred for 3 h at −20 °C. The reaction mixture was quenched with saturated aqueous NH4Cl (10 mL) and extracted with EtOAc (8 × 3 mL). The combined organic extracts were washed with saturated aqueous NaCl (20 mL), dried with MgSO4 and concentrated. Purification by flash chromatography on silica gel (80:20 Hexane/EtOAc) afforded the title compound (495 mg, 88%) as a colorless oil: Rf 0.3 (80:20 Hexane/EtOAc); [α]D25 +13.9 (c 1.2, MeOH), lit. value for R-enantiomer: [α]D25 −14.2 (c 2.4, MeOH)[30]; 1H NMR (600 MHz, CDCl3) δ 1.31 (d, 3H, J = 7.2 Hz), 1.43 (s, 9H), 1.84 (tt, J = 7.2 Hz, 7.2 Hz, 2H), 2.28 (dt, J = 7.2 Hz, 7.2 Hz, 2H), 2.39 (t, J = 7.2 Hz, 2H), 4.53 (t, J = 7.2 Hz, 1H), 5.36 (br, 1H), 6.16 (d, J = 16.2 Hz, 1H), 6.95 (dt, J = 7.0, 16.2 Hz, 1H), 7.32–7.38 (m, 5H)[30]; 13C NMR (125 MHz, CDCl3) δ 18.2, 22.9, 28.3, 32.0, 33.1, 53.1, 66.5, 80.3, 127.5, 128.7, 128.9, 136.2, 147.5, 155.4, 173.3, 198.2.[30]
(S)-8-[(tert-Butoxycarbonyl)amino]-7-oxononanoic acid (17)
To a solution of 16 (37.5 mg, 0.1 mmol) in EtOAc (5 mL) was added 10 wt% Pd–C (10.6 mg, 0.01 mmol of Pd, 0.1 equiv) at 23 °C under an argon atmosphere. The reaction vessel evacuated (~0.3 psi) then backfilled with H2 (50 psi) and the mixture was stirred at 23 °C for 48 h. The mixture was filtered over Celite and the filtrate was concentrated. Purification by flash chromatography (gradient from 5–10% MeOH/CH2Cl2) on silica gel afforded the title compound (28.6 mg, 100%) as a light yellow oil: Rf 0.25 (90:10 CH2Cl2/MeOH); [α]D25 −23.9 (c, 1.4, MeOH), lit. value: [α]D25 −24.9 (c, 2.9, MeOH)[30]; 1H NMR (600 MHz, CDCl3) δ 1.22–1.34 (m, 5H), 1.41 (s, 9H), 1.57–1.64 (m, 4H), 2.32 (t, J = 7.2 Hz, 2H), 2.43–2.51 (m, 2H), 4.28 (m, 1H), 5.29 (br s, 1H)[30]; 13C NMR (125 MHz, CDCl3) δ 16.8 (major), 17.7 (minor), 23.1, 24.8, 28.3, 28.7, 33.5, 37.8 (major), 38.8 (minor), 55.0 (minor), 56.6 (major), 79.4 (minor), 81.3 (major), 155.5 (minor), 156.3 (major), 179.0, 209.6.[30]
(S)-8-Amino-7-oxononanoic acid hydrochloride salt (KAPA–HCl, 2)
A solution of anhydrous 6 M HCl in dioxane (3.0 mL) was added to 17 (14.3 mg, 0.05 mmol) and the reaction stirred for 30 min at 0 °C. The reaction was concentrated in vacuo to afford the crude product, which was recrystallized from 10:1 Et2O/EtOH (3 mL) to afford the title compound (9.4 mg, 85%) as a colorless solid: mp 107.5–109 °C, (lit. values 108.3–108.4 °C)[30]; [α]D25 +46.0 (c 1.0, MeOH), lit. values[30]: +48.1 (c 1.0, MeOH); er 98:2; 1H NMR (600 MHz, CD3OD) δ 1.32–1.38 (m, 2H), 1.51 (d, J = 7.2 Hz, 3H), 1.52–1.66 (m, 4H), 2.33 (t, J = 7.2 Hz, 2 H), 2.55–2.61 (m, 1H), 2.65–2.70 (m, 1H), 4.14 (q, J = 7.2 Hz, 1H)[30]; 13C NMR (125 MHz, CD3OD) δ 15.9, 24.1, 25.9, 29.7, 34.9, 39.1, 56.0, 177.7, 207.5.[30]
The enantiomeric ratio (er) of KAPA was determined by HPLC analysis after derivatization with a chiral adduct of o-phthaldialdehyde.37 The ortho-phthaladehyde-N-acetyl-L-cysteine (OPA-NAC) reagent was prepared according to the procedure described by Aswad.39 Derivatization of KAPA was achieved by mixing 20 μL of KAPA aqueous solution (1 mM), 20 μL of an OPA-NAC solution (60 mM) and 200 μL H2O. The solution was incubated at 23 °C for 8 min, then 60 μL of the reaction mixture was injected onto a Shimadzu HPLC system with a reverse phase column (Phenomenex®, Synergi 4 μm Hydro-RP 80 Å, 250 × 4.6 mm). The resolution of the diastereomers was achieved using an isocratic method employing CH3CN/50 mM NaOAc buffer, pH = 5.8 (20/80, v/v), 1.25 mL/min. The detector was set at 337 nm. Derivatized (S)- and (R)-KAPA were detected at 4.7 min and 5.2 min, respectively.
Direct Binding and Displacement Assay
Initial experiments were performed to optimize the detection of dethiobiotin. Quenching of the fluorophore upon binding to streptavidin was demonstrated by titration of 20 nM 6 with streptavidin (0.034–3 μM). Reactions were performed in binding buffer (100 mM Bicine, 50 mM NaHCO3, 1 mM MgCl2, 0.0025% Igepal CA630, pH 8.6) with a final volume of 100 μL on a 96 well black plate (Corning #3991). Plates were incubated for 10 min at 23 °C and then read on a spectromax M5e multi-mode plate reader in fluorescence mode with an excitation of 485 nm, emission of 530 nm and a cutoff of 530 nm. The resulting data was fit in Prism 4 (GraphPad) to equation (1), which is the anti-log form of the four parameter sigmoidal dose-response equation, where F is the fluorescence intensity at streptavidin concentration [S], Fmax and Fmin are the maximum and minimum fluorescence signals respectively, h is the hill slope, and IC50 is the concentration of streptavidin that produces 50% Fmax.
| (1) |
The ability to quantitate dethiobiotin was confirmed by displacing probe 6 with increasing amounts of dethiobiotin (0.007–1.7 μM). The reactions were carried out as above with streptavidin held constant at 185 nM. Fluorescence intensities were corrected for background and fit to the linear transformation (equation 3) of the one site competition equation (equation 2) in Prism, where F is the fluorescence intensity at dethiobiotin concentration [S], Fmax and Fmin are the maximum and minimum fluorescence signals respectively and IC50 is the concentration of dethiobiotin that produces 50% Fmax.
| (2) |
| (3) |
Dethiobiotin concentrations produced in the assay can be back calculated from fluorescence intensity using equation 4. Concentrations as low as 7 nM could be determined using this method.
| (4) |
Transient-State Kinetics
Transient binding and dissociation of the 6·streptavidin complex was measured with an Applied Photophysics stopped flow spectrophotometer (Applied Photophysics, Surrey, UK) operated in fluorescence mode. The samples were excited at 490 nm (monochromator band pass set at 2.0 nm) and fluorescence emission detected after passing through a 530 nm (+/− 10 nm) band pass interference filter (Newport, Irving CA, USA). Binding and dissociation reactions were carried out at 20 °C (controlled by a circulating water bath) in (100 mM Bicine, 50 mM NaHCO3, 1 mM MgCl2, 0.0025% Igepal CA630). All biochemical species concentrations are reported as post mixing concentrations. Transient data was analyzed using OriginPro 8.5 (Northampton, MA, USA). The resulting association and dissociation fluorescence transients were analyzed globally using equation 5, a single exponential binding model where Ft = the observed fluorescence, Fo = the initial fluorescence of 6 in the absence of mixed ligand, A = the amplitude change in fluorescence, and kobs = the observed rate constant for the transient.
| (5) |
Coupled Continuous Assay
The optimized parameters from the initial binding and displacement assays were used to develop a continuous assay employing BioA and BioD to produce dethiobiotin. A standard curve was generated to relate the observed fluorescence to dethiobiotin concentration. Each standard curve contained all of the components of the reaction it was paired with, omitting only BioD. Dethiobiotin was varied from 0.007–1.7 μM and analyzed as described in the previous section.
To ensure that BioA is the rate limiting enzyme, initial studies were performed with variable amounts of BioA to confirm the initial velocity was linear with respect to [BioA]. Each reaction contained BioA (0–200 nM), 320 nM BioD, 12.5 μM KAPA, 5 mM SAM, 20 nM 6, 185 nM streptavidin in reaction buffer (100 mM Bicine, 5 mM ATP, 50 mM NaHCO3, 1 mM MgCl2, 0.1 mM PLP, 0.0025% Igepal CA630, 1 mM TCEP, pH 8.6). Reactions were performed in 96-well black plates with a final volume of 100 μL. Plates were read at 25 °C on a spectromax M5e multi-mode plate reader in kinetic fluorescence mode with an excitation of 485 nm, emission of 530 nm and a cutoff of 530 nm. The initial velocity (v0) was determined by the time to produce 92 nM dethiobiotin, which was plotted versus enzyme concentration and fit using linear regression.
Steady-state kinetic parameters for the substrates KAPA and SAM were determined and compared to literature values to further validate the assay. The initial velocities were measured as a function of substrate concentration to provide saturation curves that were fit by non-linear regression analysis to the Michaelis-Menten equation (Figure 8). Reactions with variable KAPA (0–12.5 μM) contained 320 nM BioD, 50 nM BioA, 5 mM SAM, 20 nM 6, and 185 nM streptavidin in reaction buffer. Reactions with variable SAM (0.12–15 mM) contained 320 nM BioD, 50 nM BioA, 12.5 μM KAPA, 20 nM 6, and 185 nM streptavidin in reaction buffer modified for the high acidity of SAM at large concentrations (250 mM Bicine pH 8.6, 5 mM ATP, 50 mM NaHCO3, 1 mM MgCl2, 0.1 mM PLP, 0.0025% Igepal CA630).
Figure 8.

Steady-state kinetics of BioA versus KAPA and SAM. (A) Initial velocity versus [KAPA]. Each reaction contained 50 nM BioA, 320 nM BioD, 0–12.5 μM KAPA, 20 nM 6, 185 nM streptavidin, 100 mM Bicine, 5 mM ATP, 50 mM NaHCO3, 1 mM MgCl2, 0.1 mM PLP, 5 mM SAM, 0.0025% Igepal CA630 1 mM TCEP, pH 8.6. (B) Initial velocity versus [SAM]. Each reaction contained 50 nM BioA, 320 nM BioD, 12.5 μM KAPA, 20 nM 6, 185 nM streptavidin, 100 mM Bicine, 5 mM ATP, 50 mM NaHCO3, 1 mM MgCl2, 0.1 mM PLP, 0–15 mM SAM, 0.0025% Igepal CA630 1 mM TCEP, pH 8.6.
End-Point Assay for High-Throughput Screening
Reaction volumes were reduced to 50 μL in order to enable screening in black 384 well plates (Corning #3575). Assays consisted of 320 nM BioD, 50 nM BioA, 3 μM KAPA, 1 mM SAM, 20 nM 6, 185 nM streptavidin and 1% DMSO in reaction buffer. Assays were initiated by the addition of either KAPA or BioA and read for 30 min. Reactions were quenched with the addition of 10 μL of 500 mM EDTA. Since DMSO is the carrier for most compound libraries the assay, as described above, was performed with varying amounts of DMSO (1–20%). The percentage of activity based on the amount of dethiobiotin produced in 30 min was ploted versus DMSO concentration (Figure 9A). It is also important that reaction master mixes are stable for extended periods of time while setting up reaction plates. To test this the standard reaction, vida supra, contained either 12.5 μM KAPA and was initiated by the addition of 50 nM BioA or contained BioA and was initiated by adding KAPA. Reactions were initiated between 0 and 8 h and the amount of dethiobiotin produced in 30 min at each preincubation time point was plotted as a percent of that generated with no preincubation time (Figure 9B). For determination of Z′ scores, the standard end-point assay was performed at 22, 25 and 28 °C in duplicate on 2 separate days with a minimum of 32 positive control replicates (1% DMSO) and 32 negative control replicates (83 mM EDTA) (Figure 9C).[31] The Z′ values were determined using equation 6, where μ(+) and μ(−) are the upper and lower mean values of the positive and negative controls, and σ(+) and σ(−) are the respective standard deviations.
Figure 9.
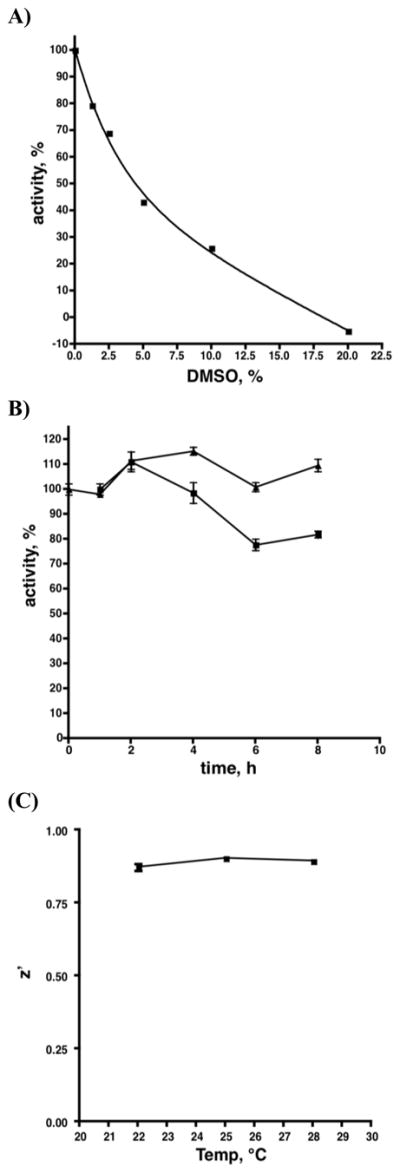
Impact of parameters on Z′.
Impact of DMSO concentration, pre-inucbation time, and temperature on activity and Z. (A) Activity as a function of DMSO concentration. Each assay contained 50 nM BioA 320 nM BioD, 20 nM 6, 185 nM streptavidin, 100 mM Bicine, 5 mM ATP, 50 mM NaHCO3, 1 mM MgCl2, 0.1 mM PLP, 1 mM SAM, 0.0025% Igepal CA630, pH 8.6 with or without KAPA (12.5 μM) for background subtraction and a variable amount of DMSO (0 to 20 %) (B) activity as a function of pre-incubation time. Reactions were run as in (A) and either contained 12.5 μM KAPA and were initiated by the addition of 6.6 nM BioA (■) or contained BioA and were initiated with KAPA (△) over an 8 hour period. (C) Z as a function of temperature. Reactions were run as in (A) with 1% DMSO.
| (6) |
To validate the assay for high-throughput screening the assay was performed against the LOPAC1280 library of bioactive compounds (Sigma). The library was reformatted into four 384-well plates and diluted to 1.25 mM in DMSO using a Biomek 3000 automated workstation. These plates were used to prepare screening plates in duplicate that contained 320 LOPAC compounds and 32 DMSO control wells (1 μL each). The reactions were initiated by the addition of 49 μL of reaction mixture (see above) to each well. As a negative control 10 μL of 500 mM EDTA was added to 16 wells prior to the addition of the master mix. Reactions were incubated for 30 min at 25 °C, quenched with EDTA and read as previously described. A secondary assay to test for non-specific activity consisted of 32 nM BioD, 3 μM DAPA, 20 nM 6, 185 nM streptavidin and 1% DMSO in reaction buffer was performed for all compounds that demonstrated greater than 30% inhibition in the primary assay on both replicates. An IC50 value was determined for compounds that were confirmed to have BioA specific activity (see below).
Inhibitor assays
Inhibitor assays were carried out in much the same way as BioA activity assays. Inhibitors in dissolved in DMSO and dispensed into black 96-well plates. A positive and negative control were also included in each plate. A master mix of 320 nM BioD, 50 nM BioA, 800 nM KAPA, 185 nM streptavidin, 20 nM 6, and 1 mM SAM in reaction buffer was prepared and 100 μL was dispensed into the inhibitor and control wells. The plate was read as described above for 20 min. The data was analyzed in Prism 4 using equation 3 to provide IC50 values for each inhibitor. The IC50 values were compared using the slopes from the linear portion of the reaction, the fluorescence intensity when the DMSO control reached 80 nM dethiobiotin (10% substrate conversion) and the calculated concentration of dethiobiotin with the DMSO control at 80 nM. All three methods provided nearly identical IC50 values; however, the slope gave curves with the highest R2 values. The slope method was particularly robust when high concentrations of inhibitor altered fluorescence intensity at the initial time (T0).
Results and Discussion
Rationale
The overall coupled assay to measure BioA activity is illustrated in Figure 2. BioA catalyzes the reversible transamination between KAPA and DAPA. In the second step, which is irreversible, BioD catalyzes the ATP-dependent carbonylation of DAPA to provide dethiobiotin and this step drives the BioA reaction forward. Dethiobiotin is detected by displacement of the fluorescent dethiobiotin probe 6 from streptavidin resulting in an increase in the fluorescent signal. The essence of the assay lies in the fluorescence quenching of probe 6 by streptavidin and restoration of fluorescence upon release from streptavidin. Another critical feature of the assay that enables it to be performed in a continuous format is the rapid reversible binding of dethiobiotin and probe 6 as a result of the substantially weaker binding affinities of these molecules for streptavidin, which contrasts with the functionally irreversible binding of biotin. The stepwise development and optimization of the assay are described below.
Figure 2.

Overview of the coupled fluorescent displacement assay to measure BioA activity.
Probe Design and Synthesis
The design of the fluorescent dethiobiotin probe 6 was based on previous structure–activity relationships, which demonstrated modification of the carboxylic acid moiety of biotin could be performed without severely disrupting binding affinity.[32] We selected a fifteen atom linker between the fluorophore and dethiobitin based on molecular modeling studies (see Methods), which showed this linker would permit binding of the fluorophore and dethiobiotin moieties in adjacent biotin-binding sites of the streptavidin homotetramer (i.e. anticooperative binding), and consequently would promote tryptophan quenching of the fluorophore (Figure 3).[33] The trioxopentadecane linker was chosen as it promotes aqueous solubility and possesses enhanced conformation entropy relative to simple alkyl linkers. Probe 6 was synthesized in three steps as shown in Scheme 1. Dethiobiotin N-hydroxysuccinimide ester 7 was coupled to Boc-protected diaminotrioxopentadecane 8 to provide 9. Deprotection with 4 N HCl in dioxane yielded 10, which was coupled to 5-carboxyfluorescein N-hydroxysuccinimidyl ester 11 employing triethylamine in DMF to afford probe 6 that was purified using reverse-phase HPLC.
Figure 3.

X-ray structure of tetrameric streptavidin (PDB: 3MG5) with compound 6 modeled into two of the four biotin binding sites. The designed polyethylene glycol linker was found to provide an optimal length of 15 Å for the proper placement of the dethiobiotin and fluorescein moieties into each of the biotin binding sites. Minimal structural changes during energy minimization were observed to accommodate the modeled compound 6. The presence of tryptophan rich environment (W79, W92, W108, and W120) supports a fast quenching mechanism of fluorescein when bound.
Scheme 1.

Synthesis of fluorescent dethiobiotin probe 6.
Synthesis of KAPA
KAPA was synthesized in five steps from Boc-L-alanine 12 using several modifications to the described synthetic route by Lucet and co-workers including improved conditions for the preparation of 13–16 (Scheme 2).[30] Since these authors did not include experimental procedures for any compound, we have provided full experimental details in the Material and Methods section. Boc-L-Alanine 12 was converted to the Weinreb amide 13 in quantitative yield using carbonyl diimidazole as the activating agent. Weinreb amide 13 was treated sequentially with isopropylmagnesium chloride and lithium methyl dimethylphosphonate to provide crude β-ketophosphonate 14, which was unstable on silica gel and carried on directly to the next step. In this reaction the Grignard reagent served as a sacrificial base to deprotonate the Boc protecting group.[29] Wittig olefination of crude β-ketophosphonate 14 with benzyl 4-oxobutanoate 15 provided enone 16 exclusively at the E-isomer in 88% yield over two steps. Conversion of enone 16 to (S)-N-Boc-KAPA 17 was achieved in quantitative yield by hydrogenation at 50 psi in ethyl acetate through simultaneous hydrogenation of the olefin and hydrogenolysis of the benzyl ether. Deprotection of (S)-N-Boc-KAPA 17 with HCl/dioxane and recrystallization of the crude product provided (S)-KAPA 2 as the hydrochloride salt in 85% yield and an enantiomeric ratio of 98:2 as determined by chiral derivatization and HPLC analysis with an [α]D = +46.0 that closely matched the literature value of +48.1.[30]
Scheme 2.

Synthesis of KAPA.
Cloning, Expression, and Purification of BioA and BioD
The bioA gene was PCR amplified from M. tuberculosis H37Rv genomic DNA and cloned into a pET28b vector to introduce a N-terminal His tag then subcloned into pUC18 to create a vector under control of the lac promoter following the strategy described by Mann and Ploux.[13] The bioD gene was PCR amplified from E. coli BL21 (DE3) genomic DNA and cloned into pET28b to introduce an N-terminal His tag. DNA sequencing of the cloned fragments confirmed the expected sequence and the absence of any mutations. Overexpression of BioA and BioD was performed in E. coli BL21-CodonPlus (DE3)-RP and BL21 (DE3) cells respectively harboring each overexpression construct, and purification of the soluble proteins was performed via Ni-NTA affinity chromatography using standard binding, washing, and elution to afford 1.5 mg of BioA and 420 mg of BioD per liter of culture. The molecular mass of BioA determined by SDS–PAGE was ~45 kDa, consistent with the molecular mass of 48482.41 Da calculated from the amino acid sequence of BioA from M. tuberculosis H37Rv and the histidine tag. The molecular mass of BioD determined by SDS–PAGE was ~25 kDa, consistent with the molecular mass of 26486.97 Da calculated from the amino acid sequence from E. coli BL21 (DE3) and the histidine tag.
Binding and Displacement of Probe from Streptavidin
First, we showed that addition of streptavidin to probe 6 led to complete fluorescence quenching and provided the binding curve as shown in Figure 4A. Due to the multiple binding sites of the streptavidin tetramer and lack of knowledge of the ligand:streptavidin stoichiometry, it is not possible to determine the dissociation constant from this binding curve. However, it should be noted that the direct binding curve experimentally relates the observed fluorescence with the concentration of dethiobiotin. Next, we demonstrated probe 6 could be competitively displaced by unlabeled dethiobiotin. Titration of dethiobiotin into a solution of probe 6 and streptavidin resulted in an increase in fluorescence and the binding was found to be rapid and fully reversible (Figure 4B). The concentrations of streptavidin and probe 6 can be varied to adjust the response to dethiobiotin. To balance between sensitivity and interference caused by inner-filter effects, probe 6 was used at 20 nM. Variation of streptavidin concentration enables one to tune the sensitivity of the assay to measure dethiobiotin from 0.007–5 μM. Under the initial velocity conditions of the present assay, we only required measurement between 25–200 nM dethiobiotin, consequently streptavidin was reduced to 185 nM, which provided a reasonable pseudo-linear response in this concentration range. The lower concentration of streptavidin is also beneficial since it conserves reagent, which is an important consideration for high-throughput screening. For subsequent analysis using this assay, we always repeated the displacement experiment in order to generate a standard curve by adding varying amounts of dethiobiotin to reactions containing all components except BioA in order to calculate the concentration of dethiobiotin from fluorescence intensity. The displacement curve fit (r2 > 0.99) reasonably well to a simple one-site competition model (see equation 3).
Figure 4.

Direct binding and displacement of probe 6 from streptavidin. (A) Direct binding of 6 to streptavidin as measured by fluorescence. Each reaction contained streptavidin (0, 34.7, 52.0, 78.0, 117.1, 175.6, 263.3, 395.0, 592.6, 888.9, 1333.3, 2000, 3000 nM), 20 nM 6, 100 mM Bicine, 50 mM NaHCO3, 1 mM MgCl2, 0.0025% Igepal CA630, pH 8.6. (B) Competitive displacement of 6 from streptavidin by dethiobiotin. Each reaction contained dethiobiotin (0, 6.8, 20.6, 61.7, 185.2, 555.6, 1666.7 nM), 320 nM BioD, 12.5 μM KAPA, 20 nM Fl-DTB, 185 nM streptavidin, 100 mM Bicine, 5 mM ATP, 50 mM NaHCO3, 1 mM MgCl2, 0.1 mM PLP, 5 mM SAM, 0.0025% Igepal CA630 1 mM TCEP, pH 8.6.
Transient Kinetics of Streptavidin–6 Binding and Dissociation
To determine the kinetics of 6·streptavidin binding and dissociation, we measured the fluorescence of 6 in a stopped flow fluorescence spectrophotometer, following rapid mixing of either streptavidin with 6, or the equilibrated streptavidin·6 complex with competing free biotin. In the binding experiments, 25 nM 6 was mixed with increasing concentrations of streptavidin (250 nM to 5 μM) (Figure 5A). We measured the dissociation of 6 by mixing a pre-equilibrated complex of streptavidin·6 (250 nM/25 nM) with excess biotin (5 mM) (Figure 5C). In both experiments, the concentration of 6 was kept at least 10 times lower than the concentration of streptavidin to minimize negative cooperativity between multiple occupied biotin binding sites.[34, 35] The rate constants and apparent dissociation constant from this analysis (k1 = 6.30 × 10⁶ ± 2 × 10⁴ M−1s−1, k−1 = 0.06 ± 2.0 ×10⁻⁴ s−1, KD(App) = 9.5 nM) were in agreement with our measured KD for 6 binding to streptavidin.
Figure 5.

Transient kinetics of the Streptavidin·6 complex. (A) Representative binding transients initiated by mixing 6 (25 nM) with stochiometric excess streptavidin (250 nM, 550 nM, 850 nM shown). Grey lines, normalized recorded 6 fluorescence, black line, respective single exponential fits. (B) Dependence of the observed single exponential rate constant of streptavidin·6 binding on the total concentration of streptavidin. Black line, linear fit used to calculate the second order association rate constant k1 = 6.3 106 M−1s−1. (C) Representative dissociation transient initiated by mixing preformed streptavidin·6 (250 nM/25 nM) with excess free biotin (5 M). Dissociation rate constant k−1 = 0.06 s−1. Extrapolated KD = 9.5 nM.
Coupled BioA–BioD–Streptavidin–6 System
Having established a reporter system that enables measurement of dethiobiotin, we now sought to evaluate this in a kinetic mode under initial velocity conditions in a 100 μL 96-well format using BioA from M. tuberculosis and BioD from E. coli along with their required cofactors and substrates, which were all held at saturating concentrations. BioD from E. coli was selected for the coupled assay since the recombinant protein is readily overproduced (~420 mg/L) and possesses approximately 4-fold better activity than the mycobacterial homolog. The Vmax for the BioD reaction was 77-fold higher than BioA–catalyzed step based on the enzyme concentrations, reported kcat value for BioD,[36] and our experimentally measured value for BioA (vide infra), ensuring the BioD–catalyzed step is fast relative to that of BioA. The in situ generated dethiobiotin from the BioA–BioD reaction displaces probe 6 and results in a time–dependent increase in fluorescence (Figure 6). Notably, the dissociation rate of probe 6 from streptavidin is greater than 15-fold faster than the BioA–BioD catalyzed production of dethiobiotin based on the measured rate constants and substrate concentrations for the experimental conditions shown in Figure 6. The raw fluorescence data is transformed into dethiobiotin concentration using equation 4. The initial velocity was easily measured following a short lag phase. We confirmed that the reaction velocity was linearly dependent on the concentration of BioA (Figure 7). We next evaluated the kinetic parameters for SAM and KAPA (Figure 8). The kcat and KM values closely agreed with the values reported by Mann and co-workers using the established biodisc assay and these results help validate our fluorescence displacement assay (Table 1).[20, 37] We observed significant substrate inhibition at high KAPA concentrations (> 13 μM) that is likely due to trace amounts of (R)-KAPA, which is a potent inhibitor of BioA.[37]
Figure 6.

Progress curve of dethiobiotin formation. Time course of dethiobiotin produced in a standard assay. Dashed line is the raw data in RFU and the solid line is the same data converted into concentration of dethiobiotin formed using equation 4. The assay contained 320 nM BioD, 50 nM BioA, 800 nM KAPA, 20 nM 6, 185 nM streptavidin, 100 mM Bicine, 5 mM ATP, 50 mM NaHCO3, 1 mM MgCl2, 0.1 mM PLP, 1 mM SAM, 0.0025% Igepal CA630, pH 8.6.
Figure 7.

Linear relationship of BioA concentration and initial velocity.
Relationship between BioA concentration and initial velocity. Each reaction contained BioA (0 200 nM), 320 nM BioD, 12.5 μM KAPA, 20 nM 6, 185 nM streptavidin, 100 mM Bicine, 5 mM ATP, 50 mM NaHCO3, 1 mM MgCl2, 0.1 mM PLP, 5 mM SAM, 0.0025% Igepal CA630 1 mM TCEP, pH 8.6.
Table 1.
BioA kinetic parameters
Assay Miniaturization and Optimization for High-Throughput Screening
In order to adapt the fluorescence displacement assay for high-throughput screening (HTS), we modified the assay from a 100 μL 96-well continuous format to a 50 μL 384-well endpoint format. First, we reduced the concentration of the BioA substrates KAPA and SAM to 3 μM and 1 mM, respectively, which is near their KM values to conserve reagents and provide balanced assay conditions. Next, we added 1% DMSO to promote solubility of library compounds and 0.0025% Igepal CA-630, a nonionic detergent to the assay since Shoichet and co-workers have shown that nonionic detergents can prevent the formation of aggregates caused by library compounds, which is a major source of false positive hits.[38] Finally, we investigated the sensitivity of the assay to dithiothreitol (DTT), a common reducing agent and observed addition of 2 mM DTT resulted in a modest 18% decrease of the initial velocity. However, this small decrease in activity is more than compensated by the prevention of false positives arising from non-specific thiol reactive molecules, which are prevalent in most commercially available compound libraries. A positive control that mimicked full inhibition of the enzyme activity was obtained by excluding MgCl2 from the assay mixture. We showed the assay could be completely quenched by addition of 20 μL of 500 mM EDTA solution, which served to sequester the essential Mg2+ divalent cofactor required for BioD activity. Using our EDTA quenching method and the modified assay buffer, we evaluated the Z′ factor (equation 6), which is a statistical parameter often used to determine the robustness of an assay.[31] The Z′ of 0.89 ± 0.02 was calculated from 32 positive and 32 negative wells tested at 25 °C in duplicate. Z′ scores between 0.5–1.0 are considered excellent, thus the assay was deemed suitable for HTS.
Impact of Assay Parameters
The quality of the assay was assessed by varying several factors including, DMSO concentration, preincubation time, post-quench read time, and temperature. The compatibility with DMSO from 0–20% DMSO was investigated and concentrations up to 1% were well tolerated providing little reduction in steady state velocity; however, the enzyme activity rapidly declined with an increasing concentration of DMSO as shown in Figure 9A. In order to determine the stability of the reaction components over time, reaction mixtures were incubated on ice up to 8 hours before initiation with either KAPA or BioA. We observed no decrease in activity when initiating with KAPA and a modest 15% decrease upon initiation with BioA (Figure 9B). The slight attenuation in activity is likely due to the slow racemization of (S)-KAPA leading to the formation of the R-antipode, which has shown to be a competitive inhibitor of BioA.[37] The signal stability over time after quenching with EDTA was measured and only a small decrease of approximately 2 RFU in fluorescence intensity and no change to Z′ was observed after 15 hours. We also demonstrated that the Z′ was invariant to temperature over the range of 20–28 °C (Figure 9C).
Screening of the LOPAC Library
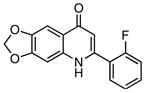
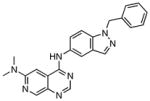
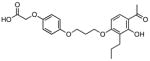
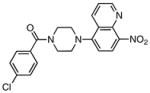
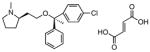
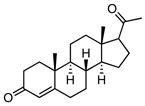
In order to further validate the suitability of the coupled assay for use in a high-throughput format, the LOPAC1280TM library was screened in duplicate at 25 μM against BioA in a 50 μL 384-well plate format with a final DMSO concentration of 2%. The assay performed extremely well with a calculated Z′ factor of 0.78 and seven compounds exhibited greater than 30% inhibition in both assay replicates. These compounds were subsequently screened directly against BioD with DAPA as substrate to preclude activity against the coupling enzyme or general non-specific inhibition employing the streptavidin·6 fluorescent assay as described in the Materials and Methods. One compound showed equal inhibition in this counterscreen while the other six compounds were inactive. We determined IC50 values for these six compounds as shown in table 2, which ranged from 0.44–6.86 μM.
Table 2.
LOPAC results
| Entry | Compound | IC50, μM |
|---|---|---|
| 1 |
|
0.44 ± 0.02 |
| 2 |
|
0.91 ± 0.07 |
| 3 |
|
3.16 ± 0.18 |
| 4 |
|
3.88 ± 0.38 |
| 5 |
|
4.75 ± 0.38 |
| 6 |
|
6.86 ± 0.54 |
Conclusion
The transaminase BioA catalyzes the conversion of KAPA to DAPA, which are both highly polar molecules with identical molecular weights. As a result we were unable to resolve these compounds by LC-MS. To overcome this limitation, we turned to a coupled assay employing BioD to convert DAPA into dethiobiotin, which is easily separable. To improve the screening throughput of the assay, we developed a fluorescent probe of dethiobiotin (6), which is quenched when bound to streptavidin, but whose fluorescence drastically increases upon displacement into solution. We found that this streptavidin-probe system provided a near linear response in the detection of dethiobiotin under initial velocity conditions. For high-throughput screening a simple end-point assay is suitable; however, for evaluation of time-dependent inhibitors, we sought a continuous assay. A major concern was whether the binding and dissociation kinetics of fluorescent probe 6 and streptavidin would be fast relative to the production of dethiobiotin. To address this, we employed transient kinetics to measure the association and dissociation rate constants of 6 and streptavidin, which showed the dissociation rate was approximately one order of magnitude greater than the initial rate of dethiobiotin production. We then miniaturized the assay to a 30 μL 384-well plate format for high-throughput screening and developed a simple EDTA quenching protocol. The impact of assay parameters including DMSO concentration, preincubation time, post-quench read time, and temperature on the Z′ score was assessed. We evaluated the assay against the LOPAC1280TM library to provide a final level of validation and identified six compounds that provided acceptable dose-response curves and did not inhibit BioD or disrupt the fluorescent profile of probe 6 bound to streptavidin.
Acknowledgments
This work was supported in part by the Bill and Melinda Gates Foundation and Wellcome Trust for the Grand Challenges in Global Health project “Drugs for Treatment of Latent Tuberculosis” and NIH Grants AI-091790 (C.C.A.), GM-27906 (D.D.T.) and AR-056191 (J. M. M.).
Footnotes
Publisher's Disclaimer: This is a PDF file of an unedited manuscript that has been accepted for publication. As a service to our customers we are providing this early version of the manuscript. The manuscript will undergo copyediting, typesetting, and review of the resulting proof before it is published in its final citable form. Please note that during the production process errors may be discovered which could affect the content, and all legal disclaimers that apply to the journal pertain.
References
- 1.Russell DG, Barry CE, 3rd, Flynn JL. Tuberculosis: what we don’t know can, and does, hurt us. Science. 2010;328:852–856. doi: 10.1126/science.1184784. [DOI] [PMC free article] [PubMed] [Google Scholar]
- 2.Aldrich CC, Boshoff HI, Remmel RP. Antitubercular Agents. 7. Vol. 7 Wiley; Hoboken, N. J: 2010. [Google Scholar]
- 3.Gerdes SY, Scholle MD, D’Souza M, Bernal A, Baev MV, Farrell M, Kurnasov OV, Daugherty MD, Mseeh F, Polanuyer BM, Campbell JW, Anantha S, Shatalin KY, Chowdhury SA, Fonstein MY, Osterman AL. From genetic footprinting to antimicrobial drug targets: examples in cofactor biosynthetic pathways. J Bacteriol. 2002;184:4555–4572. doi: 10.1128/JB.184.16.4555-4572.2002. [DOI] [PMC free article] [PubMed] [Google Scholar]
- 4.Cole ST, Brosch R, Parkhill J, Garnier T, Churcher C, Harris D, Gordon SV, Eiglmeier K, Gas S, Barry CE, 3rd, Tekaia F, Badcock K, Basham D, Brown D, Chillingworth T, Connor R, Davies R, Devlin K, Feltwell T, Gentles S, Hamlin N, Holroyd S, Hornsby T, Jagels K, Krogh A, McLean J, Moule S, Murphy L, Oliver K, Osborne J, Quail MA, Rajandream MA, Rogers J, Rutter S, Seeger K, Skelton J, Squares R, Squares S, Sulston JE, Taylor K, Whitehead S, Barrell BG. Deciphering the biology of Mycobacterium tuberculosis from the complete genome sequence. Nature. 1998;393:537–544. doi: 10.1038/31159. [DOI] [PubMed] [Google Scholar]
- 5.Marquet A, Bui BT, Florentin D. Biosynthesis of biotin and lipoic acid. Vitam Horm. 2001;61:51–101. doi: 10.1016/s0083-6729(01)61002-1. [DOI] [PubMed] [Google Scholar]
- 6.Sassetti CM, Rubin EJ. Genetic requirements for mycobacterial survival during infection. Proc Natl Acad Sci USA. 2003;100:12989–12994. doi: 10.1073/pnas.2134250100. [DOI] [PMC free article] [PubMed] [Google Scholar]
- 7.Dey S, Lane JM, Lee RE, Rubin EJ, Sacchettini JC. Structural characterization of the Mycobacterium tuberculosis biotin biosynthesis enzymes 7,8-diaminopelargonic acid synthase and dethiobiotin synthetase. Biochemistry. 2010;49:6746–6760. doi: 10.1021/bi902097j. [DOI] [PMC free article] [PubMed] [Google Scholar]
- 8.Lin S, Hanson RE, Cronan JE. Biotin synthesis begins by hijacking the fatty acid synthetic pathway. Nat Chem Biol. 2010;6:682–688. doi: 10.1038/nchembio.420. [DOI] [PMC free article] [PubMed] [Google Scholar]
- 9.Ploux O, Marquet A. Mechanistic studies on the 8-amino-7-oxopelargonate synthase, a pyridoxal-5′-phosphate-dependent enzyme involved in biotin biosynthesis. Eur J Biochem. 1996;236:301–308. doi: 10.1111/j.1432-1033.1996.00301.x. [DOI] [PubMed] [Google Scholar]
- 10.Bhor VM, Dev S, Vasanthakumar GR, Kumar P, Sinha S, Surolia A. Broad substrate stereospecificity of the Mycobacterium tuberculosis 7-keto-8-aminopelargonic acid synthase: Spectroscopic and kinetic studies. J Biol Chem. 2006;281:25076–25088. doi: 10.1074/jbc.M604477200. [DOI] [PubMed] [Google Scholar]
- 11.Stoner GL, Eisenberg MA. Purification and properties of 7, 8-diaminopelargonic acid aminotransferase. J Biol Chem. 1975;250:4029–4036. [PubMed] [Google Scholar]
- 12.Stoner GL, Eisenberg MA. Biosynthesis of 7, 8-diaminopelargonic acid from 7-keto-8-aminopelargonic acid and S-adenosyl-L-methionine. J Biol Chem. 1975;250:4037–4043. [PubMed] [Google Scholar]
- 13.Mann S, Ploux O. 7,8-Diaminoperlargonic acid aminotransferase from Mycobacterium tuberculosis, a potential therapeutic target. Characterization and inhibition studies. FEBS J. 2006;273:4778–4789. doi: 10.1111/j.1742-4658.2006.05479.x. [DOI] [PubMed] [Google Scholar]
- 14.Krell K, Eisenberg MA. The purification and properties of dethiobiotin synthetase. J Biol Chem. 1970;245:6558–6566. [PubMed] [Google Scholar]
- 15.Gibson KJ, Lorimer GH, Rendina AR, Taylor WS, Cohen G, Gatenby AA, Payne WG, Roe DC, Lockett BA, Nudelman A, et al. Dethiobiotin synthetase: the carbonylation of 7,8-diaminonanoic acid proceeds regiospecifically via the N7-carbamate. Biochemistry. 1995;34:10976–10984. doi: 10.1021/bi00035a003. [DOI] [PubMed] [Google Scholar]
- 16.Escalettes F, Florentin D, Tse Sum Bui B, Lesage D, Marquet A. Biotin synthase mechanism: Evidence for hydrogen transfer from the substrate into deoxyadenosine. J Am Chem Soc. 1999;121:3571–3578. [Google Scholar]
- 17.Kitahara T, Hotta K, Yoshida M, Okami Y. Biological studies of amiclenomycin. J Antibiot (Tokyo) 1975;28:215–221. doi: 10.7164/antibiotics.28.215. [DOI] [PubMed] [Google Scholar]
- 18.Hotta K, Kitahara T, Okami Y. Studies of the mode of action of amiclenomycin. J Antibiot (Tokyo) 1975;28:222–228. doi: 10.7164/antibiotics.28.222. [DOI] [PubMed] [Google Scholar]
- 19.Sandmark J, Mann S, Marquet A, Schneider G. Structural basis for the inhibition of the biosynthesis of biotin by the antibiotic amiclenomycin. J Biol Chem. 2002;277:43352–43358. doi: 10.1074/jbc.M207239200. [DOI] [PubMed] [Google Scholar]
- 20.Mann S, Florentin D, Lesage D, Drujon T, Ploux O, Marquet A. Inhibition of diamino pelargonic acid aminotransferase, an enzyme of the biotin biosynthetic pathway, by amiclenomycin: A mechanistic study. Helv Chim Acta. 2003;86:3836–3850. [Google Scholar]
- 21.Eisenberg MA, Stoner GL. Biosynthesis of 7,8-diaminopelargonic acid, a biotin intermediate, from 7-keto-8-aminopelargonic acid and S-adenosyl-L-methionine. J Bacteriol. 1971;108:1135–1140. doi: 10.1128/jb.108.3.1135-1140.1971. [DOI] [PMC free article] [PubMed] [Google Scholar]
- 22.Studier FW. Protein production by auto-induction in high density shaking cultures. Protein Expr Purif. 2005;41:207–234. doi: 10.1016/j.pep.2005.01.016. [DOI] [PubMed] [Google Scholar]
- 23.Maestro v 9.1. Macromodel v 9.8. Schrodinger, LLC; New York, NY: [Google Scholar]
- 24.Baugh L, Le Trong I, Cerutti DS, Gulich S, Stayton PS, Stenkamp RE, Lybrand TP. A distal point mutation in the streptavidin-biotin complex preserves structure but diminishes binding affinity: experimental evidence of electronic polarization effects? Biochemistry. 2010;49:4568–4570. doi: 10.1021/bi1005392. [DOI] [PMC free article] [PubMed] [Google Scholar]
- 25.Jorgensen WL, Maxwell DS, Tirado-Rives J. Development and testing of the OPLS all-atom force field on conformational energetics and properties of organic liquids. J Am Chem Soc. 1996;118:11225–11236. [Google Scholar]
- 26.Hofmann K, Titus G, Montibeller JA, Finn FM. Avidin binding of carboxyl-substituted biotin and analogues. Biochemistry. 1982;21:978–984. doi: 10.1021/bi00534a024. [DOI] [PubMed] [Google Scholar]
- 27.Morwick T, Hrapchak M, DeTuri M, Campbell S. A practical approach to the synthesis of 2,4-disubstituted oxazoles from amino acids. Org Lett. 2002;4:2665–2668. doi: 10.1021/ol020092s. [DOI] [PubMed] [Google Scholar]
- 28.Greenlee WJ, Patchett AA, Weber AE, Tata JR. Cyclic renin inhibitors, EP0518675-A2. 1992. [Google Scholar]
- 29.Liu J, Ikemoto N, Petrillo D, Armstrong J., 3rd Improved syntheses of α-BOC-aminoketones from α-BOC-Weinreb amides using a pre-deprotonation protocol. Tetrahedron Lett. 2002;43:8223–8226. [Google Scholar]
- 30.Lucet D, Le Gall T, Mioskowski C, Ploux O, Marquet A. First synthesis of both enantiomers of the biotin vitamer 8-amino-7-oxopelargonic acid. Tetrahedon: Asymmetry. 1996;7:985–988. [Google Scholar]
- 31.Zhang JH, Chung TD, Oldenburg KR. A Simple Statistical Parameter for Use in Evaluation and Validation of High Throughput Screening Assays. J Biomol Screen. 1999;4:67–73. doi: 10.1177/108705719900400206. [DOI] [PubMed] [Google Scholar]
- 32.Kada G, Kaiser K, Falk H, Gruber HJ. Rapid estimation of avidin and streptavidin by fluorescence quenching or fluorescence polarization. Biochim Biophys Acta. 1999;1427:44–48. doi: 10.1016/s0304-4165(98)00177-9. [DOI] [PubMed] [Google Scholar]
- 33.Kada G, Falk H, Gruber HJ. Accurate measurement of avidin and streptavidin in crude biofluids with a new, optimized biotin-fluorescein conjugate. Biochim Biophys Acta. 1999;1427:33–43. doi: 10.1016/s0304-4165(98)00178-0. [DOI] [PubMed] [Google Scholar]
- 34.Chilkoti A, Stayton PS. Molecular origins of the slow streptavidin–biotin dissociation kinetics. J Am Chem Soc. 1995;117:10622–10628. [Google Scholar]
- 35.Marek M, Kaiser K, Gruber HJ. Biotin–pyrene conjugates with poly(ethylene glycol) spacers are convenient fluorescent probes for avidin and streptavidin. Bioconjugate Chem. 1997;8:560–566. doi: 10.1021/bc970088e. [DOI] [PubMed] [Google Scholar]
- 36.Yang G, Sandalova T, Lohman K, Lindqvist Y, Rendina AR. Active site mutants of Escherichia coli dethiobiotin synthetase: effects of mutations on enzyme catalytic and structural properties. Biochemistry. 1997;36:4751–4760. doi: 10.1021/bi9631677. [DOI] [PubMed] [Google Scholar]
- 37.Mann S, Colliandre L, Labesse G, Ploux O. Inhibition of 7,8-diaminopelargonic acid aminotransferase from Mycobacterium tuberculosis by chiral and achiral anologs of its substrate: biological implications. Biochimie. 2009;91:826–834. doi: 10.1016/j.biochi.2009.03.019. [DOI] [PubMed] [Google Scholar]
- 38.McGovern SL, Helfand BT, Feng B, Shoichet BK. A specific mechanism of nonspecific inhibition. J Med Chem. 2003;46:4265–4272. doi: 10.1021/jm030266r. [DOI] [PubMed] [Google Scholar]
- 39.Aswad DW. Determination of D- and L-aspartate in amino acid mixtures by high-performance liquid chromatography after derivatization with a chiral adduct of o-phthaldialdehyde. Anal Biochem. 1984;137:405–409. doi: 10.1016/0003-2697(84)90106-4. [DOI] [PubMed] [Google Scholar]