Abstract
Glutamate dehydrogenases (GDH) interconvert α-ketoglutarate and glutamate. In yeast, NADP-dependent enzymes, encoded by GDH1 and GDH3, are reported to synthesize glutamate from α-ketoglutarate, while an NAD-dependent enzyme, encoded by GDH2, catalyzes the reverse. Cells were grown in acetate/raffinose (YNAceRaf) to examine the role(s) of these enzymes during aerobic metabolism. In YNAceRaf the doubling time of wild type, gdh2Δ, and gdh3Δ cells was comparable at ~ 4 hours. NADP-dependent GDH activity (Gdh1p + Gdh3p) in wild type, gdh2Δ, and gdh3Δ was decreased ~80% and NAD-dependent activity (Gdh2p) in wild type and gdh3Δ was increased ~20-fold in YNAceRaf as compared to glucose. Cells carrying the gdh1Δ allele did not divide in YNAceRaf, yet both the NADP-dependent (Gdh3p) and NAD-dependent (Gdh2p) GDH activity was ~3-fold higher than in glucose. Metabolism of [1, 2-13C]-acetate and analysis of carbon NMR spectra was used to examine glutamate metabolism. Incorporation of 13C into glutamate was nearly undetectable in gdh1Δ cells, reflecting a GDH activity at < 15% of wild type. Analysis of 13C- enrichment of glutamate carbons indicate a decreased rate of glutamate biosynthesis from acetate in gdh2Δ and gdh3Δ strains as compared to wild type. Further, the relative complexity of 13C-isotopomers at early time points was noticeably greater in gdh3Δ as compared to wild type and gdh2Δ cells. These in vivo data show that Gdh1p is the primary GDH enzyme and Gdh2p and Gdh3p play evident roles during aerobic glutamate metabolism.
Introduction
The yeast Saccharomyces cerevisiae thrives with ammonia as its only source of nitrogen, as it is capable of assimilating ammonia into glutamate, which accounts for about 80% of cellular nitrogen (Magasanik, 2003). Glutamate may be produced in two ways. An ATP-dependent glutamine synthetase (encoded by GLN1) may catalyze the transfer of ammonia onto glutamate, producing glutamine. This is followed by the action of a NAD-dependent glutamate synthase (encoded by GLT1), which reduces and transfers the amide group onto α-ketoglutarate (2-oxoglutarate) to produce two molecules of glutamate. Alternatively, in the favored route at lower metabolic cost, two NADP-dependent glutamate dehydrogenases (NADP-GDH; encoded by GDH1 and GDH3) produce glutamate by catalyzing amination and reduction of α-ketoglutarate (Magasanik, 2003; DeLuna et al, 2001). Degradation of glutamate to α-ketoglutarate and free ammonia is mediated by a related NAD-dependent glutamate dehydrogenase (NAD-GDH; encoded by GDH2) (Miller and Magasanik, 1990).
Studies by DeLuna et al. (2001) on the expression and activity levels of the three glutamate dehydrogenase enzymes indicate that Gdh1p is the sole NADP-GDH showing activity when cells grow on glucose. Gdh3p is induced during the diauxic shift or by growth in ethanol, indicating a role during respiration, whereas Gdh1p activity is the same or decreased under these conditions. The Gdh2p enzyme is also subject to regulation (Coschigano et al, 1991), being repressed by glucose and elevated during fermentation (low glucose, ethanol), respiration (acetate) or growth with amino acids as nitrogen source. Such control is consistent with an anapleurotic role for Gdh2p during respiration (Coschigano et al, 1991).
The regulation of the GDH enzymes indicates different physiological roles in the cell. In these studies we aimed to examine the biosynthesis of glutamate in vivo using 13C-metabolic enrichment followed by nuclear magnetic resonance (NMR) spectral analysis. Glutamate formation was examined during aerobic metabolism in normal, wild type cells as compared to single disruption mutants for each of the GDH enzymes (gdh1Δ, gdh2Δ and gdh3Δ). These data allow us to make some conclusions about the relative importance of each of the three enzymes in regulating the level of glutamate formation during aerobic metabolism.
Materials and Methods
Yeast strains, media and growth
The yeast strains used in these studies and their genotypes are listed in Table I. Genotypes were confirmed by growth phenotype for nutritional markers or PCR analysis of GDH alleles (data not shown). Synthetic medium (YN) contained 0.6% yeast nitrogen base, 0.5% yeast extract, and the necessary amino acid supplements, see Table 1 (Sherman, 1991). The carbon sources were either 2% glucose (YNDex) or 1% each of acetate and raffinose (YNAceRaf). Minimal medium for 13C-metabolic enrichment contained 0.67% yeast nitrogen base without amino acids. All media reagents were from Difco or Sigma Chemical.
Table 1.
Strains and doubling times on experimental media
| Straina | Genotype | Doubling Time (minutes)b |
|
|---|---|---|---|
| YNDex | YNAceRaf | ||
| Wild Type (BY4742) | MATα his3 leu2 lys2 ura3 | 127+13 | 254+43 |
| gdh1Δ (YOR375c) | MATα his3 leu2 lys2 ura3 gdh1Δ::G418 | 132+11 | NDc |
| gdh2Δ (YDL215c) | MATα his3 leu2 lys2 ura3 gdh2Δ::G418 | 132+6 | 232+43 |
| gdh3Δ (YAL062w) | MATα his3 leu2 lys2 ura3 gdh3Δ::G418 | 133+6 | 272+33 |
Wild type is followed in parentheses by the strain name; for mutants the strain name used in these studies is followed in parentheses by the designation for the disrupted open reading frame.
Doubling times during logarithmic growth in glucose (YNDex) or acetate plus raffinose media (YNAceRaf); Average of 3–5 separate determinations +/− standard deviation. ND = not detectable
Although the gdh1Δ strain does not divide, no loss of viability is observed after 17–19 hours in this medium.
Doubling times were determined for cells during logarithmic growth. YNDex-grown cells were diluted to an optical density of 0.05–0.2 at 600 nm (OD600) and OD600 readings were taken for 8 (YNDex) to 24 (YNAceRaf) hours at 30 C with shaking at 200rpm. Growth after the transfer of cells from YNDex to YNAceRaf proceeded only after a significant lag (~10 hours; data not shown). To examine the viability of gdh1Δ cells after culture in YNAceRaf medium, cells pre-grown overnight in YNDex were pelleted by centrifugation, resuspended in YNAceRaf, and cultured for an additional 17–19 hours. The number of live cells in the culture was determined before and after incubation in YNAceRaf by spreading a dilution of cells onto duplicate rich YPD plates (Sherman, 1991) and counting the number of resulting colonies.
Growth conditions used for enzyme determination and metabolic enrichment were essentially the same as those above. For glucose grown cells, cell lysates were prepared from late log phase cells grown overnight in YNDex. For cells grown in YNAceRaf, cells were first grown up overnight in YNDex. Cells were then pelleted by centrifugation, resuspended in fresh YNAceRaf medium, and allowed to grow to late log phase (16–18 hours) with shaking at 30°C.
Glutamate dehydrogenase assays
Cell lysates were prepared by glass bead disruption in 0.1M potassium phosphate, pH 7.8 as described previously (Trotter et al, 2005). Aliquots were stored at −20°C and thawed on the day of the assay. Glutamate dehydrogenase activity was measured by monitoring the oxidation of NADPH or NADH spectrophotometrically by the method of Doherty (1970). Protein concentrations were determined by BCA (bicinchoninic acid) assay (Sigma Chemical).
NMR studies
Cells were washed with sterile diH2O and pellets were resuspended (0.5–0.75 g) in minimal medium containing 0.5 mg/mL of [1,2-13C]-acetate (Cambridge Isotope Labs). Cells were incubated with shaking at 30°C for the time indicated. Following incubation, cell extracts were prepared as described previously (Trotter et al, 2005) with one modification. The extracts were dried overnight with a Jouan RC1010 vacuum centrifuge and the dried extract was dissolved in deuterated water (D2O; Cambridge Isotope Labs). NMR spectroscopy was performed on a JEOL ECA-400 MHz instrument. Proton-decoupled 13C NMR spectra were obtained at 100.6 MHz using WALTZ-16 proton decoupling, a 45° pulse width, 5s delay, 20,000-Hz sweep width, and 32,000 data points. The number of scans per sample was set at 4096.
Delta software (JEOL) was used for spectral processing. Glutamate peaks were identified based upon published shift values, shift values observed using standards, and our previous studies (Trotter et al, 2005). Carbon-13 enrichment with the acetate precursor resulted in glutamate signals appearing as multiplets, rather than the singlets seen in molecules with natural abundance of 13C. Relative total, singlet, doublet, and/or multiplet 13C signal intensities for the carbons of glutamate were determined by integration as previously described (Trotter et al, 2005).
Results
Characteristics of strains under experimental conditions
Culture conditions were chosen such that all three GDH enzymes might be measurably active - i.e. in the absence of glucose - and the mutant strains might have the best growth performance. The trisaccharide raffinose was chosen as one carbon source because it allows for de-repression of glucose repressed genes, while still supporting growth of some yeast strains carrying mitochondrial deficiencies (Reilly and Sherman, 1965; Zitomer and Nichols, 1978). Acetate was also included to allow cells to adapt to this carbon source (De Virgilio et al, 1992; van den Berg et al, 1996; Tenreiro et al, 2000) prior to metabolic enrichment with the isotope-labeled form. Thus, experiments were conducted with cells grown either in 2% glucose (YNDex) or a mixture of 1% acetate and 1% raffinose (YNAceRaf) and containing ammonia as the primary nitrogen source. The doubling times of the strains in both media are shown in Table I. With the exception of gdh1Δ in YNAceRaf, the strains have comparable doubling times in either medium. Although the gdh1Δ cells do not double in YNAceRaf, cell viability is unaffected after 17–19 hours culture in this medium (see Materials and Methods, data not shown).
NAD(P)-dependent GDH activity was measured in extracts from cells grown in either medium. Total NADP-dependent GDH activity (primarily Gdh1p) in the wild type, gdh2Δ, and gdh3Δ strains is decreased in YNAceRaf as compared to YNDex (Table 2, left). Yet, the small amount of NADP-dependent activity in gdh1Δ cells (presumably due to Gdh3p) increases; this suggests that, although NADP-dependent GDH overall is decreased, the proportion of NADP-dependent activity due to Gdh3p is higher in YNAceRaf medium. NAD-dependent Gdh2p activity is significantly elevated in cells grown on YNAceRaf as compared to YNDex (Table 2, right). This is true even in the non-dividing, gdh1Δ cells. Collectively, these data indicate that all of the NADP- and NAD-dependent GDH enzyme activities are present at measureable levels in cells grown in YNAceRaf medium.
Table 2.
Glutamate dehydrogenase activities in strains grown on experimental media
| Strain | NADP-GDH Activity (μmol/min/mg)a | NAD-GDH Activity (μmol/min/mg)b | ||
|---|---|---|---|---|
| YNDex | YNAceRaf | YNDex | YNAceRaf | |
| Wild Type | 154+26 | 24+6c | 6.2+4.3 | 108+13c |
| gdh1Δ | 1.0+0.4 | 3.2+1.1d | 5.8+6.3 | 14+2d, e |
| gdh2Δ | 154+10 | 24+6c | 1.8+0.2 | 1.2+0.3 |
| gdh3Δ | 125+15 | 21+6c | 2.9+0.3 | 85+9c |
NADP-dependent measures Gdh1p and Gdh3p activity. Data are the average +/− standard error for 4 or 5 separate determinations.
NAD-dependent measures Gdh2p activity. Data are the average +/− standard error for 2 or 3 (YNDex) or 5 (YNAceRaf) separate determinations.
p < 0.001 by t-test as compared to activity of the same strain in glucose.
p < 0.08 by t-test as compared to activity of the same strain in glucose.
p< 0.001 by t-test as compared to activity of wild type or gdh3Δ in YNAceRaf.
Metabolic enrichment studies
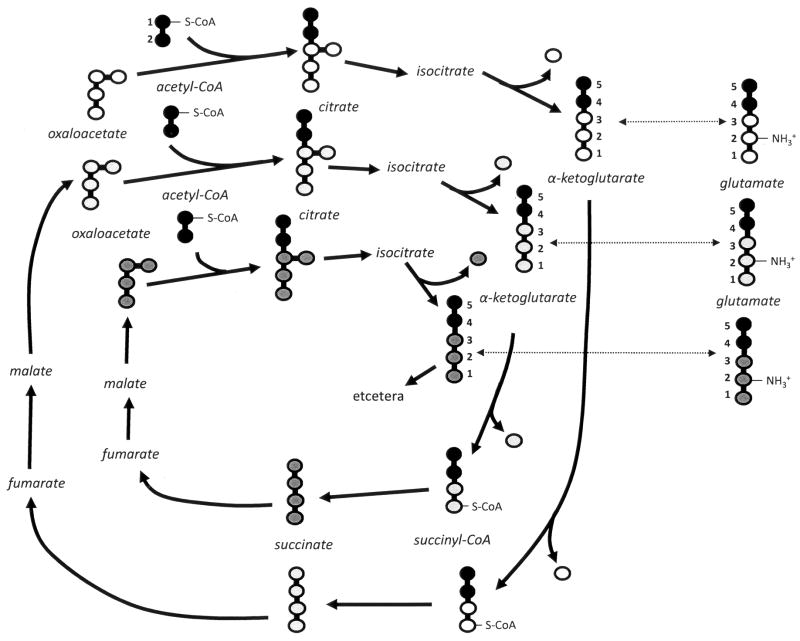
Metabolic enrichment with 13C precursor was used to examine glutamate metabolism, as the observed characteristics of NMR spectra can provide information about the movement of carbons through the pathway(s). The abundance of 13C in nature is such that, without enrichment, each of the carbons in glutamate appears as a single resonance in a proton-decoupled 13C spectrum. With metabolic enrichment, the introduced 13C-label stands out above the natural signal (not shown). During metabolic incorporation of [1, 2-13C]-acetate, the ratio of 13C signal in carbon 2 (C2) compared to carbon 4 (C4) of glutamate reflects the relative rate of incorporation of [1,2-13C]-acetate. The schematic in Figure 1 depicts [1,2-13C]-acetate incorporation, which forms 13C-isotopomers of glutamate with consecutive rotations of the citric acid cycle. Increasing enrichment of 13C relative to 12C at each position is represented by darker shading. Note that 13C enrichment of glutamate C4 precedes that of C2. Increasing 13C enrichment of neighboring carbons is responsible for characteristic splitting of carbon resonances observed in NMR spectra (Jeffrey et al, 1991; Burgess et al, 2001; Trotter et al, 2005).
Figure 1.
Schematic depicting [1,2-13C]-acetate incorporation, forming 13C-isotopomers of glutamate with consecutive rotations of the citric acid cycle. Increasing enrichment of 13C relative to 12C is represented by darker shading.
Cells were pre-grown in YNAceRaf medium, incubated with [1, 2-13C]-acetate in minimal medium for a desired time, and extracts prepared for NMR analysis. Proton-decoupled 13C NMR spectra were obtained and glutamate peaks were identified based upon known shift values. The upper spectrum in Figure 2 is typical following incubation of wild type yeast in [1,2-13C]-acetate for 120 min. As we have previously observed (Trotter et al, 2005), the primary signals are from the five carbons of glutamate (labeled on the spectrum) and the carbons of sugars (at 60–95 ppm). As carbons of glutamate become 13C-enriched, the singlet resonance(s) are split, due to the presence of the 13C label at neighboring carbon(s), into characteristic multiplets (d, t and dd; expanded above the top spectrum for the five carbons of glutamate). The lower spectrum in Figure 2 was obtained from gdh1 yeast in [1,2-13C]-acetate for 120 min. Note that the vertical scale for gdh1 spectrum has been magnified 7-fold. Thus, glutamate carbons labeled by [1,2-13C]-acetate are easily observed in wild type cells; however, incorporation in gdh1 is minimal, making detection and analysis of labeled glutamate carbons unfeasible in this strain.
Figure 2.
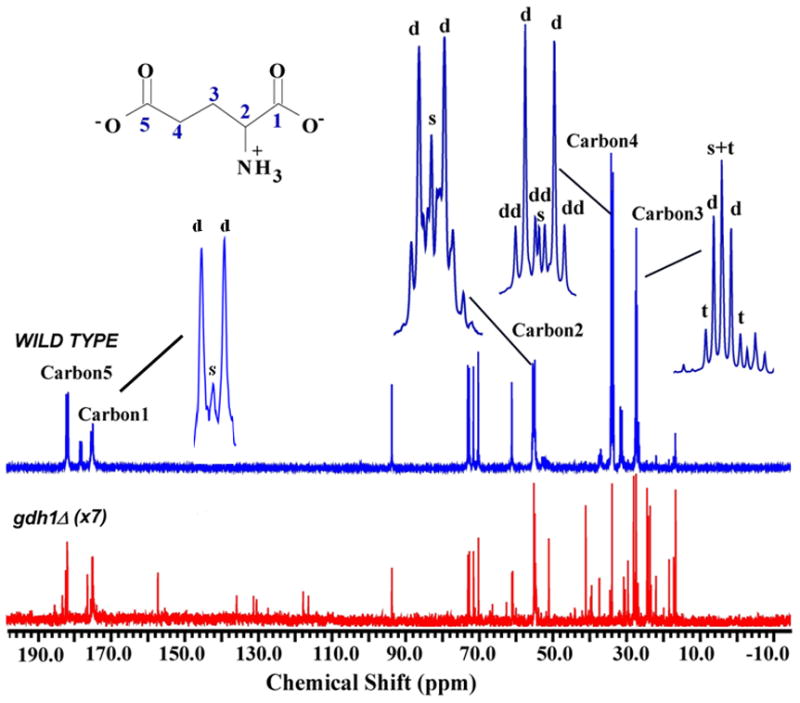
Typical proton-decoupled 13C-spectra for wild type (upper panel) and gdh1Δ (lower panel) strains after 2 hours in [1, 2-13C]-acetate. Characteristic splitting of the singlet resonance(s) for glutamate carbons, due to the presence of the 13C label at neighboring carbon(s), are expanded at the top (s, singlet; d, doublet, dd, doublet of doublet; t, triplet). Note that the gdh1 spectrum has been magnified 7-fold.
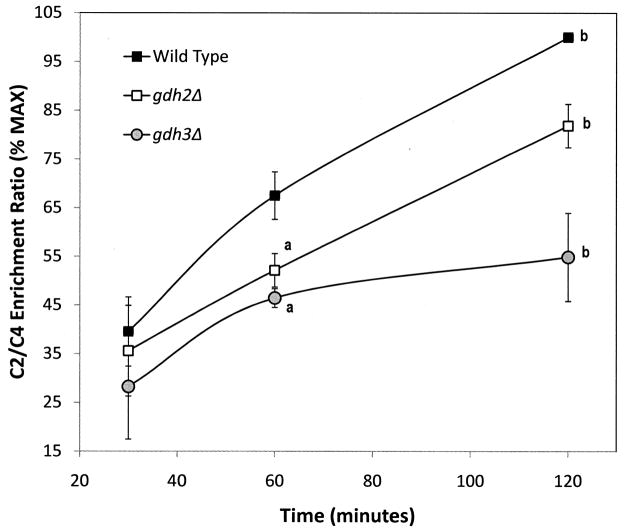
Spectra similar to that in Figure 2 were generated from YNAceRaf-grown cells incubated in minimal medium with [1,2-13C]-acetate for 0, 1 or 2 hours. NADP-GDH and the NAD-GDH activities measured under these conditions showed strain to strain comparisons as reported in Table 2 and no significant change in the activities during labeling period (data not shown). 13C-Enrichment of C2 and C4 of glutamate was determined by integrating the total area under the curve for each signal and the ratio of enrichment at C2 and C4 was calculated. The data in Figure 3 demonstrate that over the time course, either the gdh2Δ or the gdh3Δ allele decreases the rate of C2 to C4 enrichment as compared to wild type. Additionally, the rate in the gdh3Δ strain is noticeably impaired as compared to the gdh2Δ strain.
Figure 3.
The ratio of 13C signal in carbon 2 relative to carbon 4 of glutamate during incorporation of [1,2-13C]-acetate. The signal intensity, determined by integration, for carbon 2 was divided by that for carbon 4 (C2/C4 ratio). Data presented are the % of the maximal ratio (obtained for wild type at 120 minutes) +/− SEM from three separate experiments. a, p < 0.05 as compared to wild type at the same time point. b, p < 0.05 as compared to other strains at the same time point.
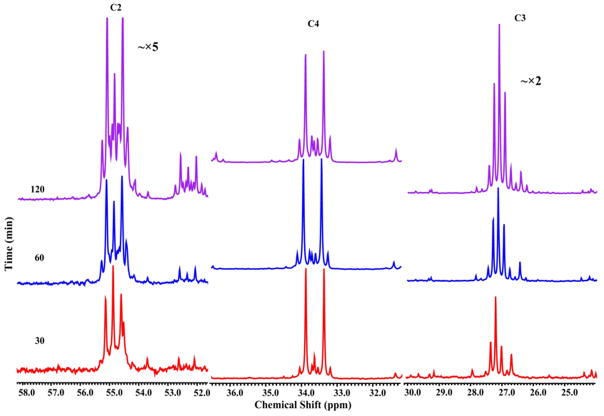
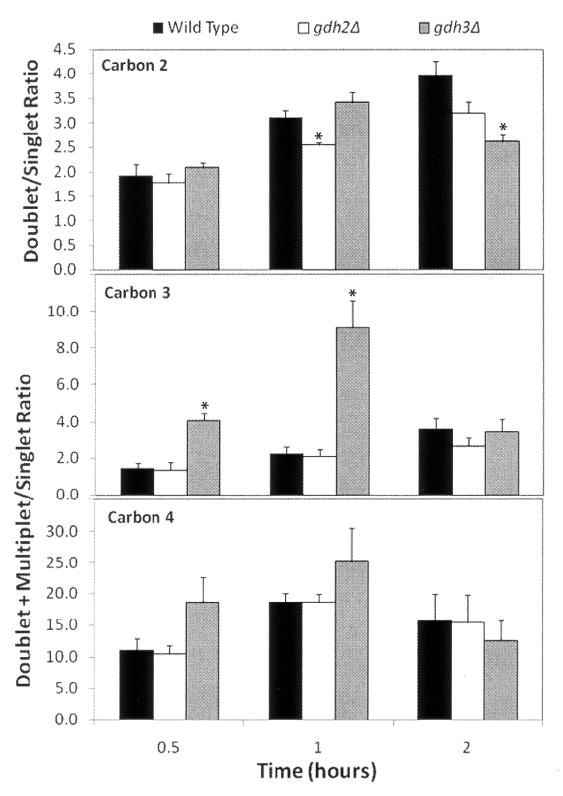
As carbons in glutamate become increasingly 13C-enriched, the peak patterns for each carbon become more complex. Generally, the complexity of the resonance pattern, that is the areas of multiplet resonances as compared to the area of the singlet peak, increases with time and/or with the number of times the carbon backbone is cycled before the α-ketoglutarate leaves the citric acid cycle for synthesis to glutamate (Jeffrey et al, 1991; Trotter et al, 2005; Turcotte et al, 2010). Alternatively, this parameter could be altered by entry of unlabeled, anaplerotic α-ketoglutarate derived from other cellular pools. An example of peak patterns at different times of enrichment in the gdh2Δ strain is shown in Figure 4A; the increase in complexity over time is most evident for C2 and C3. The intensities of multiplet (d, t, dd) and singlet peaks for C2, C3 and C4 for the wild type, gdh2Δ and gdh3Δ strains were integrated and calculated as a ratio of multiplet to singlet and are shown in Figure 4B. Data for carbons 1 and 5 are not included, since the intensity was weak and primarily multiplet (data not shown). The data show comparable ratios for wild type and gdh2Δ for nearly all the data points. The decreased complexity observed for gdh2Δ and gdh3Δ at C2 may reflect the decreased rate of enrichment (Figure 2). So, despite the slower enrichment observed in gdh2Δ cells (Figure 3), the isotopomers formed in wild type and gdh2Δ cells are qualitatively similar. In contrast, the relative proportion of multiplet for C3 in the gdh3Δ strain, particularly at early time points, is noticeably elevated as compared to wild type and gdh2Δ. This trend is also seen at C4, but was not statistically significant (p values between 0.07 and 0.15). Since the enrichment of C2 compared to C4 is slower in these cells, these data suggest that the elevated isotopomer complexity reflects greater cycling of the backbone before conversion to glutamate.
Figure 4.
Analysis of glutamate carbon 13C signal complexity as a function of time in [1,2-13C]-acetate. (A) Example of expanded spectra for carbons 2, 4, and 3 (C2, C4, and C3) from the gdh2Δ strain at 30, 60 and 120 minutes. (B) Intensity of multiplet resonances (d, t, dd) as compared to the singlet peak as a function of time. The intensities of multiplet and singlet peaks from three separate experiments were integrated and calculated as a ratio of multiplet to singlet +/− SEM. Data for carbons 1 and 5 are not included, since the intensity was weak and primarily multiplet (data not shown). *, p < 0.05 as compared to the other two strains for this carbon at the same time point.
Discussion
Saccharomyces cerevisiae expresses three glutamate dehydrogenases, each considered to have a particular function in glutamate metabolism under specific conditions. The Gdh1p and Gdh3p are primarily involved in glutamate biosynthesis, while Gdh2p is involved in glutamate degradation to ammonia and α-ketoglutarate (Magasanik, 2003). Gdh1p is active in cells grown on glucose as well as non-fermentable carbon sources, while Gdh3p is most active under non-fermentative or respiratory conditions (DeLuna et al, 2001; Riego et al, 2002; Avendano et al, 2005). Gdh2p is also elevated when cells are grown in low glucose or non-fermentable carbon (Coschigano et al, 1991). In the present study, we set out to examine these role(s) in vivo using stable isotope metabolic enrichment with [1,2-13C]-acetate in single disruption mutants under conditions in which all three enzymes are active. To that end, we chose a mixture of acetate and the de-repressing sugar raffinose.
Gdh1Δ cells are reported to have impaired growth on minimal glucose and ethanol media, indicating Gdh1p’s importance to fermentative as well as respiratory growth (DeLuna et al, 2001; Magasanik, 2003). We did not observe any difference in doubling time for gdh1Δ cells as compared to wild type in our glucose medium (YNDex), which also contains 0.5% yeast extract. However, our gdh1Δ strain showed an impairment on minimal glucose medium similar to that reported (DeLuna et al, 2001; data not shown) and was unable to divide in the acetate/raffinose medium (Table 1). So, even though the relative proportion of Gdh3p activity increases in acetate/raffinose (Table 2), it is apparently insufficient to permit normal growth and glutamate synthesis without Gdh1p. 13C-Enrichment experiments in gdh1Δ incubated in acetate/raffinose confirmed (Figure 2) that the Gdh1p enzyme is an important contributor to glutamate synthesis under these conditions.
Gdh3p is also required for normal growth on minimal ethanol medium, since gdh3Δ cells exhibit a doubling time of 67% as compared to wild type on this carbon source (DeLuna et al, 2001). Ethanol is converted to acetate for utilization as an energy and carbon source (Turcotte et al, 2010). Interestingly, we did not observe any defect for gdh3Δ cells on acetate/raffinose medium (Table 1), presumably because raffinose and 0.5% yeast extract were also in the medium. Yet, despite the wild type growth on acetate/raffinose medium, our 13C-enrichment experiments demonstrate an important role for Gdh3p in glutamate metabolism from citric acid cycle intermediates under these conditions. First, the marked decrease in the rate of enrichment at C2 relative to C4 of glutamate observed in gdh3Δ (Figure 3) suggests a decrease in the flux of acetate carbons into the citric acid cycle. It has been reported that the pool of α-ketoglutarate in gdh3Δ cells grown on ethanol is 50% of that in wild type cells (DeLuna et al, 2001). So, the decreased rate of enrichment we observe may reflect a lower availability of α-ketoglutarate in gdh3Δ cells grown on acetate/raffinose.
The relative proportion of 13C-label intensity observed in multiplet resonances as compared to singlet, particularly at C3 and C4, was greater in gdh3Δ cells as compared to wild type (Figure 4B). One interpretation of these data is that, before conversion to glutamate, the carbon backbones take a greater number of turns around the citric acid cycle, thereby increasing the chances that neighboring carbons are 13C labeled (Figure 1). If the gdh3Δ disruption does decrease the availability of α-ketoglutarate, it may be that the intermediate is conserved longer for use in turns of the citric acid cycle. Alternatively, these data may reflect a fundamental difference in the pool of glutamate synthesized by Gdh3p as compared to Gdh1p. Indeed, there is recent evidence that these enzymes have differential localization in the cell. Gdh3p was identified as a member of the mitochondrial proteome, while Gdh1p was not (Sickmann et al, 2003). So, the Gdh3p enzyme may have a unique relationship to α-ketoglutarate formed in the citric acid cycle. Taken together, the 13C-enrichment data support an important role for Gdh3p in glutamate biosynthesis under de-repressing conditions.
Gdh2p, which serves primarily to convert glutamate back to α-ketoglutarate and ammonia (Magasanik, 2003), is greatly elevated in cells grown in acetate/raffinose (Table 2). Thus, although no growth defect was observed (Table 1), we anticipated that the gdh2Δ disruption might significantly alter glutamate homeostasis. The rate of 13C-enrichment at C2 as compared to C4 was noticeably slower than wild type, but not as slow as was observed in the gdh3Δ cells (Figure 3). This indicates that the movement of the acetate label from the citric acid cycle to the glutamate pool is decreased in these cells. At first glance this result seems counterintuitive, since the Gdh2p is generally thought to be anaplerotic to the citric acid cycle, replenishing α-ketoglutarate levels as needed. Thus, loss of the enzyme might be expected to shift the pathway toward more glutamate biosynthesis, not less. However, this result may also reflect a slower flux through the cycle because the enzyme is not present to provide α-ketoglutarate. Unexpectedly, the 13C-multiplet versus singlet pattern in the gdh2Δ cells was very similar to wild type. So, loss of Gdh2p does not seem to significantly alter the glutamate pool formed via this pathway.
It is interesting that despite the clear regulation of Gdh2p activity by carbon source, others have also had difficulty establishing a role for this enzyme in carbon metabolism (Coschigano et al, 1991). In fact, gdh2Δ cells do not display any growth impairment in media containing glucose or a non-fermentable carbon source and ammonia as the nitrogen source (Miller and Magasanik, 1990; Coschigano et al, 1991). It is important to note that acetate/raffinose medium used in our studies resulted in a ~20-fold increase in NAD-dependent activity as compared to glucose (Table 2), which is in line with the reported carbon source regulation of the GDH2 gene (Coschigano et al, 1991). Levels of the Gdh2p enzyme are also separately regulated by the nitrogen source, generally being lower when ammonia or glutamine is the nitrogen source and higher when nitrogen is provided as glutamate or some other amino acids (Miller and Magasanik, 1990; Coschigano et al, 1991; Miller and Magasanik, 1991). Further, gdh2Δ cell growth is impaired as compared to wild type when nitrogen is provided exclusively as glutamate (Miller and Magasanik, 1990). Ammonia, rather than glutamate, was used as the nitrogen source for the present studies, so as to maximize 13C-enrichment of the intracellular glutamate pool. It remains a possibility that the role of Gdh2p in glutamate metabolism might be more evident when a different nitrogen source is utilized and this is an area for future investigation.
Previous studies examining regulation of expression, as well as growth and levels of metabolic intermediates in mutants have indicated specific roles for these glutamate dehydrogenase isozymes (Magasanik, 2003; DeLuna et al, 2001; Coschigano et al, 1991; Miller and Magasanik, 1991). The present 13C-enrichment study furthers the previous investigations by providing the first in vivo analysis of glutamate biosynthesis during aerobic metabolism in strains carrying disruptions in genes encoding these enzymes. The data confirm a primary role for Gdh1p in glutamate biosynthesis from citric acid cycle substrates. Additionally, loss of Gdh3p results in a significant impairment of glutamate synthesis, indicating an important role for this enzyme as well. Finally, loss of Gdh2p was less deleterious to glutamate homeostasis than expected; however, further investigation under conditions in which Gdh2p activity is maximal may provide additional insight.
Acknowledgments
The authors thank Dr. Dennis Voelker (National Jewish Center, Denver) for sharing yeast strains and Mr. Evan Stoner for technical assistance. This work was supported by NIH grant R15-GM069372 (to P.J.T.) and by NSF Grant MRI/RUI CHE-0320267 (to P.J.T., Dr. Dick Narske and Dr. Dell Jensen).
Footnotes
Publisher's Disclaimer: This is a PDF file of an unedited manuscript that has been accepted for publication. As a service to our customers we are providing this early version of the manuscript. The manuscript will undergo copyediting, typesetting, and review of the resulting proof before it is published in its final citable form. Please note that during the production process errors may be discovered which could affect the content, and all legal disclaimers that apply to the journal pertain.
References
- Avendano A, Riego L, DeLuna A, Aranda C, Romero G, Ishida C, Vazquez-Acevedo M, Rodarte B, Recillas-Targa F, Valenzuela L, Zonszein S, Gonzalez A. Swi/SNF-GCN5-dependent chromatin remodelling determines induced expression of GDH3, one of the paralogous genes responsible for ammonium assimilation and glutamate biosynthesis in Saccharomyces cerevisiae. Mol Microbiol. 2005;57(1):291–305. doi: 10.1111/j.1365-2958.2005.04689.x. [DOI] [PubMed] [Google Scholar]
- Burgess SC, Babcock EE, Jeffrey FMH, Sherry AD, Malloy CR. NMR indirect detection of glutamate to measure citric acid cycle flux in the isolated perfused rat heart. FEBS Lett. 2001:505163–167. doi: 10.1016/s0014-5793(01)02799-5. [DOI] [PubMed] [Google Scholar]
- Coschigano PW, Miller SM, Magasanik B. Physiological and genetic analysis of the carbon regulation of the NAD-dependent glutamate dehydrogenase of Saccharomyces cerevisiae. Mol Cell Biol. 1991;11(9):4455–4465. doi: 10.1128/mcb.11.9.4455. [DOI] [PMC free article] [PubMed] [Google Scholar]
- De Virgilio C, Burckert N, Barth G, Neuhaus JM, Boller T, Wiemken A. Cloning and disruption of a gene required for growth on acetate but not on ethanol: the acetyl-coenzyme A synthetase gene of Saccharomyces cerevisiae. Yeast. 1992;8(12):1043–1051. doi: 10.1002/yea.320081207. [DOI] [PubMed] [Google Scholar]
- DeLuna A, Avendano A, Riego L, Gonzalez A. NADP-Glutamate dehydrogenase isozymes of Saccharomyces cerevisiae. J Biol Chem. 2001;276(47):43775–43783. doi: 10.1074/jbc.M107986200. [DOI] [PubMed] [Google Scholar]
- Doherty D. L-Glutamate dehydrogenase in yeast. Meth Enzymol. 1970:17850–856. [Google Scholar]
- Jeffrey FMH, Rajagopal A, Malloy CR, Sherry AD. 13C-NMR: a simple yet comprehensive method for analysis of intermediary metabolism. Trends Biochem Sci. 1991:165–10. doi: 10.1016/0968-0004(91)90004-f. [DOI] [PubMed] [Google Scholar]
- Magasanik B. Ammonia assimilation by Saccharomyces cerevisiae. Eukaryot Cell. 2003;2(5):827–829. doi: 10.1128/EC.2.5.827-829.2003. [DOI] [PMC free article] [PubMed] [Google Scholar]
- Miller SM, Magasanik B. Role of the complex upstream region of the GDH2 gene in nitrogen regulation of the NAD-linked glutamate dehydrogenase in Saccharomyces cerevisiae. Mol Cell Biol. 1991;11(12):6229–6247. doi: 10.1128/mcb.11.12.6229. [DOI] [PMC free article] [PubMed] [Google Scholar]
- Miller SM, Magasanik B. Role of NAD-linked glutamate dehydrogenase in nitrogen metabolism in Saccharomyces cerevisiae. J Bacteriol. 1990;172(9):4927–4935. doi: 10.1128/jb.172.9.4927-4935.1990. [DOI] [PMC free article] [PubMed] [Google Scholar]
- Reilly C, Sherman R. Glucose repression of cytochrome A-synthesis in cytochrome-deficient mutants of yeast. Biochim Biophys Acta. 1965:95640–651. doi: 10.1016/0005-2787(65)90518-6. [DOI] [PubMed] [Google Scholar]
- Riego L, Avendano A, DeLuna A, Rodriguez E, Gonzalez A. GDH1 expression is regulated by GLN3, GCN4, and HAP4 under respiratory growth. Biochem Biophys Res Commun. 2002;293(1):79–85. doi: 10.1016/S0006-291X(02)00174-2. [DOI] [PubMed] [Google Scholar]
- Sherman F. Getting started with yeast. Meth Enzymol. 1991:1943–21. doi: 10.1016/0076-6879(91)94004-v. [DOI] [PubMed] [Google Scholar]
- Sickmann A, Reinders J, Wagner Y, Joppich C, Zahedi R, Meyer HE, Schonfisch B, Perschil I, Chacinska A, Guiard B, Rehling P, Pfanner N, Meisinger C. The proteome of Saccharomyces cerevisiae mitochondria. Proc. Natl. Acad Sci USA. 2003;100(23):13207–13212. doi: 10.1073/pnas.2135385100. [DOI] [PMC free article] [PubMed] [Google Scholar]
- Tenreiro S, Rosa PC, Viegas CA, Sa-Correia I. Expression of the AZR1 gene (ORF YGR224w), encoding a plasma membrane transporter of the major facilitator superfamily, is required for adaptation to acetic acid and resistance to azoles in Saccharomyces cerevisiae. Yeast. 2000;16(16):1469–1481. doi: 10.1002/1097-0061(200012)16:16<1469::AID-YEA640>3.0.CO;2-A. [DOI] [PubMed] [Google Scholar]
- Trotter PJ, Adamson AL, Ghrist AC, Rowe L, Scott LR, Sherman MP, Stites NC, Sun Y, Tawiah-Boateng MA, Tibbetts AS, Wadington MC, West AC. Mitochondrial transporters involved in oleic acid utilization and glutamate metabolism in yeast. Arch Biochem Biophys. 2005;442(1):21–32. doi: 10.1016/j.abb.2005.07.016. [DOI] [PubMed] [Google Scholar]
- Turcotte B, Liang XB, Robert F, Soontorngun N. Transcriptional regulation of nonfermentable carbon utilization in budding yeast. FEMS Yeast Res. 2010;10(1):2–13. doi: 10.1111/j.1567-1364.2009.00555.x. [DOI] [PMC free article] [PubMed] [Google Scholar]
- van den Berg MA, de Jong-Gubbels P, Kortland CJ, van Dijken JP, Pronk JT, Steensma HY. The two acetyl-coenzyme A synthetases of Saccharomyces cerevisiae differ with respect to kinetic properties and transcriptional regulation. J Biol Chem. 1996;271(46):28953–28959. doi: 10.1074/jbc.271.46.28953. [DOI] [PubMed] [Google Scholar]
- Zitomer RS, Nichols DL. Kinetics of glucose repression of yeast cytochrome c. J Bacteriol. 1978;135(1):39–44. doi: 10.1128/jb.135.1.39-44.1978. [DOI] [PMC free article] [PubMed] [Google Scholar]


