Abstract
We use UV resonance Raman spectroscopy to probe the lowest energy allowed electronic transitions of aqueous solutions containing Cl- salts. We show that the waters hydrating the Cl- are involved in charge transfer transitions that transfer electron density from Cl- to the water molecules. These charge transfer transitions cause significant change in the H-O-H bond angle in the excited states, which results in a strong enhancement of the preresonance Raman intensity of the water bending modes. Our work gives the first insight into the lowest allowed electronic transition of hydrated Cl-.
Introduction
Water, the ubiquitous solvent, is the major constituent of living organisms. Some of water's unique properties result from its small size, its highly dipolar character and its ability to form multiple hydrogen bonds. Although water has been the subject of extensive investigations there is still little understanding of liquid water's structure,1,2 its electronic excited states,3 as well as how water hydrates even simple molecules and ions.4,5 This lack of understanding of the electronic structure of liquid water is not surprising since in the condensed phase its excited states are probably extended over numerous molecules and these extended electronic excited states are highly dependent upon the local and nonlocal water structure; 6,7 even the ground state water structure is poorly understood. 8
An understanding of water electronic excited states is important because these states enable chemical transformations. The lower energy water excited states, for example, could enable processes such as photochemical electron transfer processes to split water into H2 and O2, for example.9,10
In the work here we probe the lowest energy allowed electronic transitions of aqueous solutions of Cl- salts and show that the waters hydrating the Cl- are involved in charge transfer transitions that transfer electron density from Cl- to the water molecules. These charge transfer transitions cause significant change in the H-O-H bond angles, which results in a strong enhancement of the preresonance Raman intensity of the water bending modes. Our work gives the first insight into the lowest allowed electronic transition of hydrated Cl-.
Experimental Section
Chemicals
NaCl was purchased from Mallinckrodt Chemicals; KCl was from J. T. Baker; LiCl was from Fisher Scientific; KF was from Aldrich Chemical Company; Acetonitrile was from Sigma-Aldrich.
Raman Apparatus
The 204 nm light was obtained by mixing the 3rd harmonic with the fundamental (816 nm wavelength) of a tunable Ti:Sapphire laser system (Photonics Industries). The 229 nm light was produced by an intracavity frequency doubling an Ar+ laser (Coherent, FReD 400). The 355 nm light was the 3rd harmonic of a Nd:YAG laser (Coherent, Infinity). The 488 nm light was from an Ar+ laser (Coherent, Innova 90c). All incident excitation light was s-polarized (i.e. polarized perpendicular to the scattering plane) at the sample. The sample was circulated in a free surface, temperature-controlled stream. 3% (v/v) acetonitrile was used in all Raman measurements as an internal intensity standard. A 170 ° sampling backscattering geometry was used. Raman scattering light from 204 and 229 nm excitation was collected and dispersed by a double monochromator onto a back thinned CCD camera with lumogen E coating (Princeton Instruments-Spec 10 System). (See Sergei et al for details. 11) Raman scattering light from 355 or 488 nm excitation was collected and dispersed by a single monochromator onto the same camera. A 488 nm notch filter (Kaiser Optical Systems Inc.) was used to reject Rayleigh scattering light from 488 nm excitation. A 355 nm long-pass filter (Semrock Inc.) was used to reject Rayleigh scattering light from 355 nm excitation. A crystalline quartz polarization scrambler was used to remove any polarization bias of the monochromators. The double-monochromator and detector efficiencies were previously measured by using a deuterium standard intensity lamp (Optronic laboratories).11 The single-monochromator and detector efficiencies were measured by using a tungsten-halogen standard intensity lamp (Optronic laboratories). The light from the standard lamp was scattered off a BaSO4 Lambert surface and imaged onto the entrance slit of the monochromator.
Results
We probe the electronic excited states of hydrated Cl- by measuring the preresonance Raman excitation profiles of aqueous salt solutions. Early studies showed a surprising intensity increase for the water bending band of aqueous solutions containing Cl-, Br-, I-. 12-14 In contrast, little intensity increase was observed for the water O-H stretching bands. Two of these previous studies vaguely suggested that the Raman intensity increase was due to a charge transfer-like transition of Cl- to water.15,16
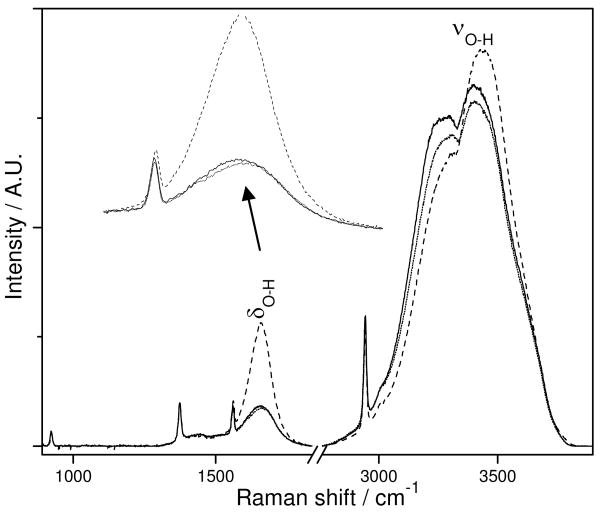
Fig. 1 shows the 204 nm excited UV Raman spectra (UVRS) of pure water at 20 ° C. The H-O-H bending band, δ H-O-H occurs at ∼ 1660 cm-1 while the O-H stretching doublet, ν O-H at ∼ 3280 cm-1 and ∼ 3400 cm-1 dominates the spectrum. Adding 2 M KCl significantly increases the δ H-O-H band intensity and slightly narrows its band width. The higher frequency ν O-H stretching band component intensity increases somewhat, while the lower frequency ν O-H band component intensity decreases. The overall intensity remains essentially constant. Addition of 2 M LiCl or NaCl gives essentially identical effects as 2 M KCl (spectra not shown). In contrast, 2 M KF shows little impact on the δ H-O-H and ν O-H bands. Thus, cations are not impacting the water Raman spectra, in agreement with previous Raman studies showing enhancement of water bending bands by halide ions.14-17
Figure 1.
204 nm excited UVRS of pure water (solid line) and in the presence of 2 M KCl (dashed line) or 2 M KF (dotted line) at 20 ° C; δ H-O-H and ν O-H indicate the O-H bending band and O-H stretching band. The 918, 1373.5 and 2942.5 cm-1 bands result from the added 3% by volume CH3CN which is used as an internal intensity standard. The 1550 cm-1 band is from atmospheric O2.
Total differential Raman Cross Sections
The Raman cross sections of the δ H-O-H and ν O-H bands were determined by using the 918 cm-1 C-C and the 2249 cm-1 C≡N stretching bands of acetonitrile as internal intensity standards.18 The total differential Raman water cross sections are:
| eqn 1 |
where Iw and ICH3CN, are the intensities of the water band and a CH3CN band.
k(λw) and k(λCH3CN) are the spectrometer efficiencies at the specific wavelengths of the water and CH3CN Raman bands. CCH3CN and Cw are the concentrations of CH3CN and water. σCH3CN (νex) is the total differential CH3CN Raman cross section at the excitation frequency, νex. εex is the Cl- molar absorptivity at νex. εw is the Cl- molar absorptivity at the water Raman band position, εr is molar absorptivity due to the Cl- at the CH3CN band wavelength. The expression in the brackets corrects the Raman intensities for self-absorption, which only occurs for the 204 nm excitation measurement. Negligible self absorption occurs for longer wavelength excitations.
δ H-O-H Raman cross section dependence on Cl- concentration
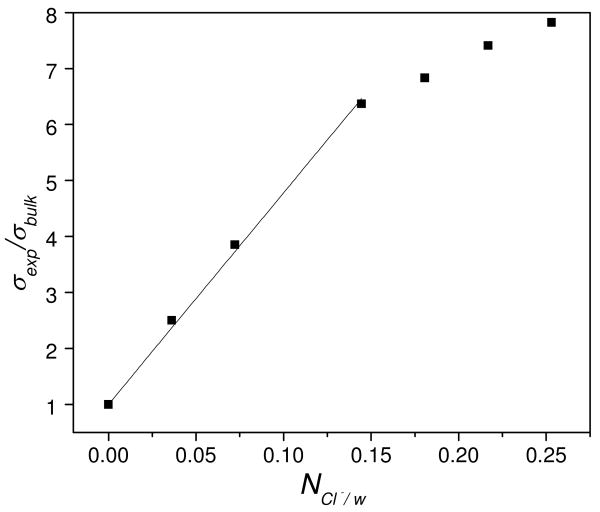
Fig. 2 shows that the δH-O-H water band Raman cross section, σexp initially increases linearly with ratio of Cl- ion to water molecules, NCl-/w until ∼0.15 where it begins to saturate, presumably because of the depletion of bulk water to hydrate the Cl-. We can model these data to calculate an effective water Raman cross section for the Cl- hydrating water and for n, the number of water molecules hydrating Cl-. This modeling assumes that the water bending mode is independently Raman scattered by bulk water molecules with a Raman cross section of σbulk, and by water molecules hydrating the Cl- with Raman cross sections of σhyd, that are larger than that of bulk water:12
Figure 2.
Dependence of the δ H-O-H Raman cross sections (λex=204 nm), σexp (relative to that of pure water, σbulk) on the ratio of Cl- to water, NCl-/w. The line is a linear fit of the first four data points.
| eqn 2 |
fbulk is the fraction of bulk water molecules and fhyd is the fraction associated with the first hydration shell of water molecules about the Cl-. σexp will increase linearly with NCl-/w until the bulk water is depleted. Fig. 2 shows water depletion when NCl-/w is >0.15 giving n∼6 for the Cl- hydration number, which is consistent with the hydration number found using other methods.19,20
δ H-O-H Raman Excitation Profiles
Table 1 shows the measured total differential Raman cross sections of the δH-O-HRaman band, σA as a function of excitation wavelength. σA increases by more than 100-fold as the excitation wavelength decreases from 488 to 204 nm. The measured σA of pure water is similar to values previously reported.21 Addition of 2 M KCl increases σA at 204 nm 2.5 fold. Smaller increases occur at longer excitation wavelengths, further from resonance. 2 M NaCl or LiCl increases σA identically to 2M LiCl. 2 M KF does not affect σA.
Table 1.
Total differential Raman cross sections of δ H-O-H Raman band, σA; δ H-O-H of first hydration shell water about the Cl-, σA hdy (numbers underlined) and the νe, K1, and K2 parameters.
| σA, σA hdy/10-30 cm2/molecule-1 sr-1 | A-term fit (K2=0) | Modified A-term fit | |||||||
|---|---|---|---|---|---|---|---|---|---|
| 204 nm | 229 nm | 355 nm | 488 nm | K1×10-31 | νe | K1×10-33 | νe | K2×10-8 | |
| water | 19.8 | 2.82 | 0.54 | 0.11 | 2.84 | 60800 | 6 | 54400 | 0.772 |
| 2 M LiCl | 46.0 | 5.09 | 0.76 | 0.14 | |||||
| 141 | 13.3 | 1.58 | 0.26 | 6.21 | 57700 | 16.7 | 53100 | 1 | |
| 2 M NaCl | 47.1 | 5.13 | 0.72 | 0.14 | |||||
| 146 | 13.5 | 1.39 | 0.24 | 6.06 | 57600 | 16.8 | 53000 | 1 | |
| 2 M KCl | 49.9 | 5.22 | 0.68 | 0.14 | |||||
| 159 | 13.9 | 1.19 | 0.22 | 5.71 | 57300 | 17 | 52900 | 1 | |
| 2 M KF | 19.2 | 2.86 | 0.54 | 0.11 | 3.07 | 61000 | 6 | 54400 | 0.786 |
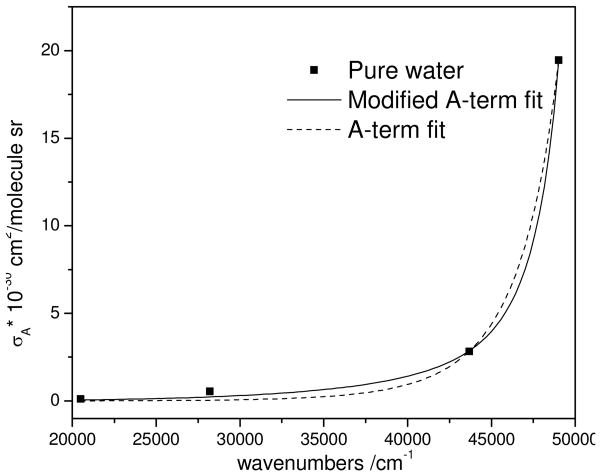
Fig. 3 shows the total differential Raman cross section excitation profile of the δH-O-H Raman band in pure water. The solid line is nonlinear-least-square fit of the data to a modified Albrecht A-term expression 22:
Figure 3.
Total differential Raman cross section excitation profile of the 1660 cm-1 H2O δH-O-H band. The solid line is the best fit to Eq. 3, while the dashed line is the best fit to a simple A-term (Eq. 3, K2 =0).
| eqn. 3 |
where νex is the excitation frequency, νw is the Raman frequency of the water band, and νe is the electronic transition frequency to the pre-resonant excited electronic state. K1 is a scaling parameter and K2 is a constant that phenomenologically models contributions from an additional preresonant state in the far UV. The dashed line is the best fit to a simple A-term (Eq. 2, where K2 = 0), which assumes that the pre-resonance enhancement is dominated by single electronic transition. The νex, K1, and K2 values shown in Table 1 are obtained from nonlinear least-squares fits of eqn 3.
The preresonance excitation profiles of the δ H-O-H Raman band of pure water is well modeled by both the A-term and modified A-term expressions to yield 60,800 and 54,400 cm-1 for the preresonant excited state frequencies, respectively. The increase in the number of parameter enables the modified A-term modeling fit to be slightly better than the simple A-term modeling.
In contrast, for the first hydration shell waters about Cl- for the δ H-O-H Raman band we find a modeled preresonant excited state frequency of 57,600 for the A-term and 53,000 for the modified A term. Thus, the preresonance enhancing transition in the Cl- solution occurs ∼ 3,200 (A-term) or ∼ 1,400 cm-1 (modified A-term) lower in energy than in pure water.
ν O-H Raman Excitation Profiles
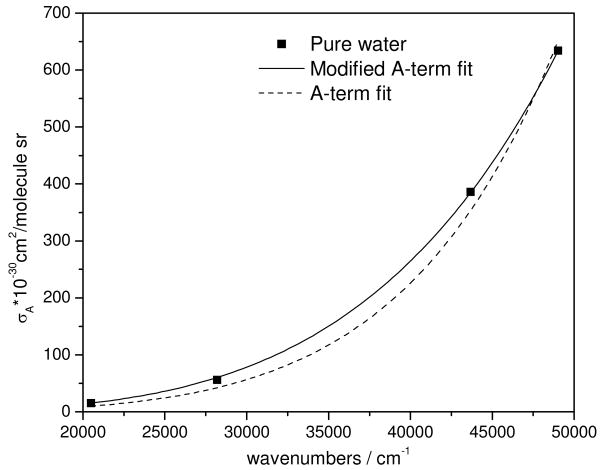
Table 2 shows the calculated total differential Raman cross sections of the νO-H vibration, σB. The σB values increase only slightly faster than ν04, indicating that the preresonant excited state for νO-H is in the far UV for pure water. Adding Cl- does not change the Raman cross sections.
Table 2.
Total differential Raman cross sections of ν O-H Raman band, σB and the νe, K1, and K2 parameters.
| σB×10-30 cm2/molecule sr | A-term fit (K2=0) | Modified A-term fit | |||||||
|---|---|---|---|---|---|---|---|---|---|
| 204 nm | 229 nm | 355 nm | 488 nm | K1×10-27 | νe | K1×10-30 | νe | K2×10-9 | |
| water | 633.69 | 368.10 | 56.27 | 15.47 | 32.95 | 150000 | 5 | 91000 | 4.62 |
| 2 M LiCl | 769.90 | 484.19 | 72.42 | 15.60 | 40.36 | 150000 | 4.91 | 91000 | 5.2 |
| 2 M NaCl | 725.34 | 485.14 | 67.28 | 15.27 | 46.93 | 150000 | 5 | 91000 | 5 |
| 2 M KCl | 628.19 | 453.66 | 63.76 | 16.11 | 34.29 | 150000 | 5 | 91000 | 5 |
| 2 M KF | 598.26 | 416.95 | 61.11 | 14.44 | 40.68 | 150000 | 4.27 | 91000 | 5 |
The total differential Raman cross section excitation profile of the ν O-H vibration of pure water gives νe=150,000 cm-1 for an A-term fit or νe=91,000 cm-1 for a modified A-term fit. As expected, addition of Cl- does not change νe.
Discussion
Isolated gas phase water molecules show their 2b1 → 3sa1 lowest energy allowed electronic transition at 166 nm. 23 The origins of the liquid water absorption bands, as well as those of water solutions are exceptionally poorly understood. In liquid water the lowest energy allowed electronic transition has a steeply rising edge at ∼175 nm with a maximum at 147 nm. 24,25 In contrast, a strong absorption band at ∼180 nm occurs in aqueous solutions of Cl-.26
The fact that the bending mode in aqueous Cl-solutions is selectively enhanced over the stretch by the 58,000 cm-1 absorption indicates that the hydrating water excited state shows a much larger change in their H-O-H bond angles, than in their O-H bond lengths. A LCAO consideration would suggest that the electronic transition involves transfer of electron density from the Cl- to the LCAO σ*-like water orbitals. The LCAO picture does not clearly capture the orbital hybridization that gives rise to the normally sp3-like OH bonding and the typical 105° bond angle. The increase in electron density from the Cl-→water charge transfer transition removes the sp3 hybridization. A molecular orbital picture suggests that the transition will place electron density in a σ* orbital which naively would cancel bonding of one of the O-H bonds, leaving the other O-H water bond. The net result is a very different (linear) H-O-H bond angle and a O-H bond length which is comparable to that of the ground state water. More likely we would end up with a linear excited state with similar O-H bond lengths and frequencies.
This rough picture predicts that preresonance Raman excitation in this charge transfer band would show a very large enhancement of the water bending vibration but little enhancement of the O-H stretching of the Cl- hydrating waters.
Conclusion
We probe the electronic excited states of hydrated Cl- by measuring the preresonance Raman excitation profiles of aqueous salt solutions. We show that the waters hydrating the Cl- are involved in charge transfer transitions that transfer electron density from Cl- to the water molecules. These charge transfer transitions cause significant change in the H-O-H bond angle in the excited states, which results in a strong enhancement of the preresonance Raman intensity of the water bending modes. Our work gives the first insight into the lowest allowed electronic transition of hydrated Cl-.
Figure 4.
Total differential Raman cross section excitation profile of the 3400 cm-1 H2O νO-H band. The solid line is the best fit to Eq. 2, while the dashed line is the best fit to a simple A-term (Eq. 3, K2 =0).
Acknowledgments
We thank David Tuschel and Sergei Bykov for helping with instrumentation setup. This work was supported by National Institutes of Health Grants IRO1EB009089.
References
- 1.Sharp KA, Vanderkooi JM. Acc Chem Res. 2010;43:231–239. doi: 10.1021/ar900154j. [DOI] [PMC free article] [PubMed] [Google Scholar]
- 2.Roberts ST, Ramasesha K, Tokmakoff A. Acc Chem Res. 2009;42:1239–1249. doi: 10.1021/ar900088g. [DOI] [PubMed] [Google Scholar]
- 3.Garbuio V, Cascella M, Pulci O. J Phys: Condens Matter. 2009;21 doi: 10.1088/0953-8984/21/3/033101. [DOI] [PubMed] [Google Scholar]
- 4.Ben-Amotz D, Underwood R. Acc Chem Res. 2008;41:957–967. doi: 10.1021/ar7001478. [DOI] [PubMed] [Google Scholar]
- 5.Tielrooij KJ, Garcia-Araez N, Bonn M, Bakker HJ. Science. 2010;328:1006–1009. doi: 10.1126/science.1183512. [DOI] [PubMed] [Google Scholar]
- 6.Chipman DM. J Chem Phys. 2006;124 doi: 10.1063/1.2162542. [DOI] [PubMed] [Google Scholar]
- 7.Couto PCd, Chipman DM. J Chem Phys. 2010;132 doi: 10.1063/1.3453248. [DOI] [PubMed] [Google Scholar]
- 8.Csaszar AG, Czako G, Furtenbacher T, Tennyson J, Szalay V, Shirin SV, Zobov NF, Polyansky OL. J Chem Phys. 2005;122 doi: 10.1063/1.1924506. [DOI] [PubMed] [Google Scholar]
- 9.Engel V, Staemmler V, Wal RLV, Crim FF, Sension RJ, Hudson B. J Phys Chem. 1992;96:3201–3213. [Google Scholar]
- 10.Elles CG, Shkrob IA, Crowell RA, Bradforth SE. J Chem Phys. 2007;126 doi: 10.1063/1.2727468. [DOI] [PubMed] [Google Scholar]
- 11.Bykov S, Lednev I, Ianoul A, Mikhonin A, Munro C, Asher SA. Appl Spectrosc. 2005;59:1541–1552. doi: 10.1366/000370205775142511. [DOI] [PubMed] [Google Scholar]
- 12.Schultz JW, Hornig DF. J Phys Chem. 1961;65:2131–2138. [Google Scholar]
- 13.Wall TT, Hornig DF. J Chem Phys. 1967;47:784–792. [Google Scholar]
- 14.Weston RE., J Spectrochim Acta. 1962;18:1257–1277. [Google Scholar]
- 15.Kanno H, Hlralshi J. J Phys Chem. 1983;87:3664–3670. [Google Scholar]
- 16.Abe N, Ito M. J Raman Spec. 1978;7:161–167. [Google Scholar]
- 17.Georgiev GM, Kalkanjiev TK, Petrov VP, Nickolov Z. Appl Spectrosc. 1984;38:593–595. [Google Scholar]
- 18.Dudik JM, Johnson CR, Asher SA. J Chem Phys. 1985;82:1732–1740. [Google Scholar]
- 19.Robertson WH, Johnson MA. Annu Rev Phys Chem. 2003;54:173–213. doi: 10.1146/annurev.physchem.54.011002.103801. [DOI] [PubMed] [Google Scholar]
- 20.Narten AH, Vaslow F, Levy HA. J Chem Phys. 1973;58:5017–5023. [Google Scholar]
- 21.Asher SA, Murtaugh JL. Appl Spectrosc. 1988;42:83–90. [Google Scholar]
- 22.Asher SA. Annu Rev Phys Chem. 1988;39:537–588. doi: 10.1146/annurev.pc.39.100188.002541. [DOI] [PubMed] [Google Scholar]
- 23.Robin MB. Higher Excited States of Polyatomic Molecules. III Academic Press; New York: 1985. [Google Scholar]
- 24.Verrall RE, Senior WA. J Chem Phys. 1969;50:2746–2750. [Google Scholar]
- 25.Bernas A, Ferradini C, JayGerin JP. Chem Phys. 1997;222:151–160. [Google Scholar]
- 26.Scheibe G. Z Phys Chem Abt B. 1929;5:355–364. [Google Scholar]


