Abstract
Vascular imaging can be essential in the diagnosis, monitoring, and planning and assessment of treatment of patients with peripheral vascular disease. The purpose of this work is to describe a recently developed three-dimensional (3D) time-resolved contrast-enhanced MR angiography (CE-MRA) technique, Cartesian Acquisition with Projection Reconstruction-like sampling (CAPR), and its application to imaging of the vasculature of the lower legs and feet. CAPR implements accelerated imaging techniques and uses specialized multielement imaging coil arrays to achieve high temporal and high spatial resolution imaging. Volunteer and patient studies of the vasculature of the lower legs and feet have been performed. Temporal resolution of 4.9–6.5 sec and spatial resolution less than or equal to 1 mm in all directions allow for the depiction of progressive arterial filling and complex flow patterns as well as sharp visualization of vascular structure as small as the fine muscular branches. High-quality diagnostic imaging is made possible with CAPR’s advanced acquisition and reconstruction techniques and the use of specialized coil arrays.
Keywords: peripheral arterial disease, CE-MRA, time-resolved imaging
INTRODUCTION
With increasing prevalence of cardiovascular disease and diabetes, peripheral vascular disease has also become more common. Peripheral vascular disease may lead to ischemic pain, ulceration, osteomyelitis, and even gangrene, and patients may require vascular or orthopedic surgery and occasionally amputation. (Norgren et al., 2007; Graziani and Piaggesi, 2010). Vascular imaging (angiography) can be essential for diagnosis, monitoring, and planning and assessment of treatment of these patients. Diagnostic imaging of the vasculature of lower extremity often requires coverage from the abdomen/pelvis, to capture inflow, down through the feet, to assess viability of terminal vessels. The spatial resolution must be adequate to depict first order branching vessels, collateral vessels and complex filling patterns. The ability to identify small vessels is particularly important in patients with (i) known inflow disease in whom transit times are difficult to predict in timed MRA/CTA, (ii) tibial or peroneal occlusion in whom the small vessels of the distal calf or foot are the main targets for bypass, and (iii) need of reconstructive surgery and the identification of septocutaneous perforators for free flap surgery (Fukaya et al., 2010). Adequately high temporal resolution is also desired to depict arterial filling and to allow acquisition of pure arterial phase images even in the setting of rapid venous return. Temporal information is particularly important in patients with asymmetric left/right filling patterns, retrograde filling, and arteriovenous shunting.
Computed tomography angiography (CTA) is commonly employed for imaging the vasculature of the lower extremity. CTA is able to obtain very high spatial resolution (0.5–0.75 mm in-plane) but generally lacks the capability for time-resolved imaging and employs ionizing radiation (Ota et al., 2004; Met et al., 2009). Furthermore it is reported that 2–3% of studies are nondiagnostic due either to poor contrast opacification or to venous enhancement and/or calcification confounding visualization of the arterial vasculature (Meyer et al., 2008). Over a decade ago, contrast-enhanced magnetic resonance angiography (CE-MRA) was developed and initially applied to clinical practice (Prince et al., 1993). In this method a gadolinium-based contrast agent is intravenously injected into the antecubital vein, and imaging is performed during the first pass of the contrast bolus through the territory of interest. Major advantages of CE-MRA include the ability to perform time-resolved imaging, the noninvasive nature of the technique, and its lack of ionizing radiation. However, as initially developed, MRI often suffered from long acquisition times, the order of minutes. Temporal and spatial resolution are inherently competing entities: more sampling time is necessary in order to obtain images with improved spatial resolution and higher signal-to-noise ratio (SNR) (Mistretta et al., 1998). With the recent development of advanced sampling and reconstruction techniques, high quality rapid imaging is now feasible. One such technique is Cartesian Acquisition with Projection Reconstruction-like sampling (CAPR) (Haider et al., 2008). In phantom studies this technique has been shown to accurately depict degree of stenosis (Haider et al., 2009b) and to portray contrast bolus passage with high fidelity (Mostardi et al., 2009). The purpose of this work is to describe the high quality, high temporal and high spatial resolution imaging of the lower extremity that has been achieved using the accelerated CAPR acquisition technique in conjunction with high performance multi-element coil arrays. Two specific imaging protocols have been developed, one that targets imaging of the lower legs and one that targets the feet. In this article we describe the recently developed CAPR technique and its application to imaging of the lower extremity in volunteers and patients.
MATERIALS AND METHODS
MR Data Acquisition
In MR the data space is referred to as k-space, which is a three-dimensional (3D) frequency space (kX, kY, kZ). Sampling central regions of k-space, low spatial frequencies, provides contrast information, whereas sampling peripheral k-space, high spatial frequencies, provides fine spatial detail information. Each sample or repetition is comprised of a readout along the kX direction. Such sampling is further performed on a rectilinear grid in the kY-kZ plane, a process referred to as Cartesian sampling. An image is formed by 3D Fourier Transform of the k-space data into image (x,y,z) space. The specific k-space sampling pattern used in this work is Cartesian Acquisition with Projection Reconstruction-like sampling (CAPR), previously described (Haider et al., 2008). The sampling pattern for the phase encoding (kY-kZ) plane is shown in Figure 1A, and the playout of phase encoding “views” and data sorting are shown in Figure 1B. The kY-kZ phase encoding plane is divided into a central orange ellipse and a peripheral annular region that is apportioned into groups of vanes or wedges. For this application there are four sets of vanes each shown in a different color (black, green, blue, red) of Figure 1A. Only those points which fall within the central orange zone or one of the colored vane sets are actually sampled. An elliptical centric (Wilman and Riederer, 1996) sampling order is used, starting at the center of the kY-kZ plane and moving toward the periphery. The temporal playout of sampling is shown in Figure 1B, with acquisition starting at central orange k-space followed by all of the vanes within one of the colored vane sets. The process repeats with central k-space again sampled followed by the next colored vane set and continues cyclically. Images are reconstructed using the data sorting also shown in Figure 1B. Given that central k-space is sampled four times during the time required to sample all four vane sets in peripheral k-space, there are several options available for performing central k-space sampling. The specific sorting shown in Figure 1B is used as it has been shown to prevent blunting the appearance of a bolus leading edge, artifactual signal in advance of a leading edge, or diminished lateral spatial resolution (Mostardi et al., 2009).
Fig. 1.
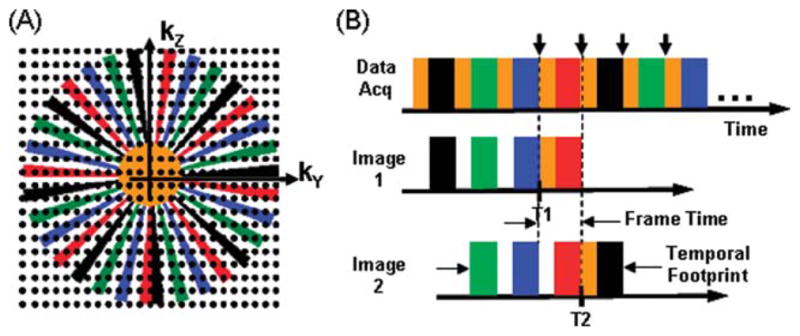
A: The kY-kZ space showing the CAPR sampling pattern. B: The temporal playout of views of (A) during data acquisition and the sorting of views used in reconstruction. Images are reconstructed corresponding to each time indicated by the short vertical arrows. Data selection for the first two of these time frames, T1 and T2, is shown for Image 1 and Image 2.
Performance metrics for imaging the vasculature of the lower legs and feet can be specified from the desired radiological criteria which in turn are based on typical morphology and physiology. These metrics in turn drive the specifications of the data acquisition. For imaging of the lower legs, the spatial resolution was targeted as 1-mm isotropic, a value chosen by the need to detect stenotic regions in the three major calf vessels. The frame time (Fig. 1B) for imaging of the lower legs was targeted to be 5 sec. This time is considered adequately short to capture one or more arterial phases prior to venous enhancement even in patients with fast arterial-to-venous transit. Shorter frame times would in general force the spatial resolution to be degraded. The frame time is the time between samplings of central k-space low spatial frequency data and thus the time interval at which image frames are reconstructed. The temporal footprint is the time over which all data used to reconstruct a single time frame are collected. In this work the temporal footprint is approximately four times larger than the frame time or 20 sec. A coronal format acquisition was assumed with a field of view (FOV) encompassing both lower legs: frequency encoding direction superior/inferior (S/I), phase encoding left/right (L/R), and slice encoding anterior/posterior (A/P) with typical respective values of 40 × 32 × 13.2 cm3. For imaging of the feet, the targeted frame time was extended somewhat to 6.5 sec, appropriately higher than that in the leg acquisition due to the slower distal flow. Thus a higher spatial resolution could be obtained, 0.75 × 0.75 × 0.9 mm3 allowing identification of target distal vessels for vascular grafts. A sagittal format acquisition was used with the FOV encompassing both feet: frequency encoding direction S/I, phase encoding A/P, slice encoding L/R with typical respective values of 30.0 × 24.0 × 19.8 cm3. These specifications can be converted into a CAPR kY-kZ space sampling pattern. Physics-based undersampling techniques of not sampling the corners of k-space (Bernstein et al., 2001), 2D SENSE (Weiger et al., 2002) and 2D homodyne (Noll et al., 1991) were implemented to accelerate the acquisition. The first of these provides for isotropic spatial resolution in the y–z plane. Two-dimensional SENSE acceleration was implemented as fourfold acceleration in the phase-encoding direction and twofold in the slice select direction to achieve a total of eightfold SENSE acceleration. The vane-like sampling pattern of Figure 1A allows for 2D homodyne processing, which in effect estimates the data at points in the gaps between the vanes. This provides an additional 1.8-fold acceleration which when coupled with 8× SENSE gives a total acceleration of 14.4. The isotropic nature of the acquired 3D volume allows for viewing of the full image volumes or Maximum Intensity Projections (MIPs) along arbitrary projection directions. Also, the 3D data allows individual slices to be interactively selected during review, potentially aiding in interpretation (Schoenberg et al., 2005).
Receiver Coil Arrays
The theoretical limit on the level of SENSE acceleration along any direction is the number of coil elements which have distinguishable sensitivities along that direction. There is currently no vendor coil array for imaging of the lower legs that provides good differential sensitivity across the transverse plane. Thus, a custom-built multielement receiver coil array was developed for imaging of the lower legs and feet that allows for highly accelerated imaging with high SNR. There were several design considerations. First, the array was to be flexible to allow for circumferential fit about the patient. The circumferential placement of the coil elements enhances the differences in sensitivity among elements. Second, a basic element size was specified, with the length chosen to allow imaging along the extent of the S/I FOV and the width selected to provide moderate falloff of sensitivity along the transverse FOV. Third, two elements were overlapped to minimize mutual inductance and attached to form a two-element module. Finally, a sufficient number of modules were then attached together into an extended linear array (Fig. 2A) and then the ends attached for circumferential placement around the region under study. Specifics of the development of the receiver coil array for 2D SENSE accelerated imaging of the lower legs (Fig. 2B) are further discussed in (Haider et al., 2009b). Briefly, it is a circumferential array with eight elements, length 27.2 cm, and different lateral widths for the L/R-placed (14.3 cm) vs. the A/P-placed (10.5 cm) elements. This coil has also been used for imaging of the feet (Fig. 2C) and has shown superior performance to other coils for that anatomic region.
Fig. 2.
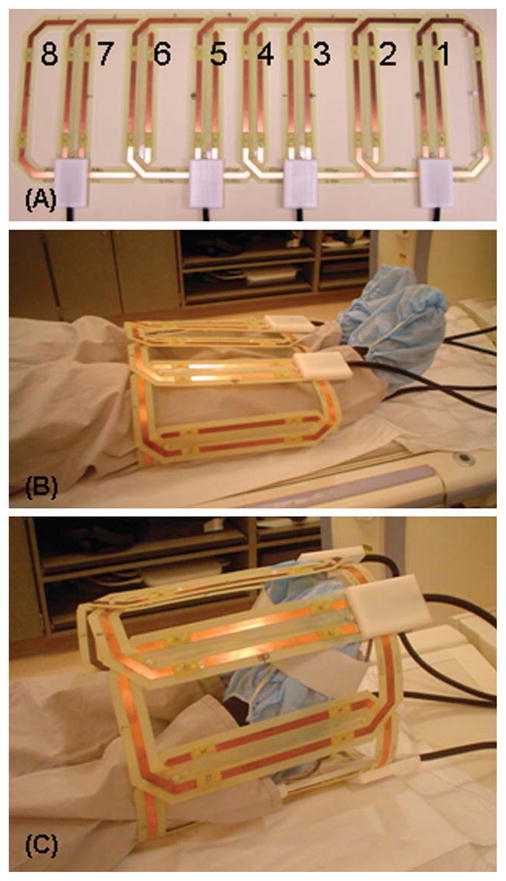
Eight-element leg/foot coil array. A: Linear array showing different sized L/R (2, 3, 6, 7) and A/P elements (1, 4, 5, 8). Circumferential fit of the eight-element coil about the lower legs (B) and feet (C).
Experimental Studies
In vivo studies were performed on a 3T MR scanner (Signa, version 14.0/15.0/20.0; GE Healthcare, Milwaukee, WI). Initial studies were performed on volunteers with no known vascular disease. Further studies were done on over 30 patients (average age 62, approximately half male and half female) with peripheral vascular disease who had prior evaluation with CTA. These patients were referred for investigation of disease progression, patency of existing grafts, and distal vessel perfusion. More recently, CAPR CE-MRA has been performed on clinical patients for various indications including assessment of native arteries in patients with signs and symptoms of lower extremity ischemia, evaluation of patency of arterial grafts, assessment of vessels to be harvested for vascular grafts, and delineation of the blood supply to the tibia and fibula prior to their use as bone graft or flap donor sites. All studies were done using a protocol approved by the Institutional Review Board of our institution, and written consent was obtained from all volunteers. Three-dimensional time-resolved contrast-enhanced MR angiography was performed with the CAPR sequence in conjunction with 2D SENSE and 2D homodyne reconstruction. In all cases a fast spoiled gradient echo pulse sequence was used for data acquisition with the following parameters: repetition time (TR) 5.85 msec; echo time (TE) 2.7 msec; flip angle 30°; bandwidth ± 62.5 kHz; and sampling of a full 400-point echo. For studies of the lower leg, the coil array and imaging FOV were generally centered between the knee and the ankle. For studies of the feet, the inferior edge of the coil was aligned with the toes and coverage extended 30 cm superiorly from the edge.
Prior to the contrast-enhanced scan SENSE calibration was performed by using a fast gradient echo sequence with similar parameters to the above but with a flip angle of 10°, bandwidth of ±31.25 kHz, and twofold reduction of spatial resolution in both the Y and Z directions vs. that used for the actual CE-MRA run. The calibration scan is done without the 8× SENSE acceleration, takes about 90 sec, and generates data used in the subsequent acceleration processing within the reconstruction. For the contrast-enhanced run for each subject 20 mL of Multihance (gadobenate dimeglumine, Bracco Diagnostics, Princeton, NJ) was injected into an arm vein at a rate of 3 mL/sec followed by 20 mL of saline also at 3 mL/sec by power injector (Spectris, Medrad, Indianola, PA). The CAPR sequence was initiated about 20 sec prior to injection in order to acquire at least one contrast-free image of the region under study to be used for subtraction of the contrast-free background. For each subject the CAPR sequence was applied repetitively until 36 image sets were acquired at the chosen frame time of 4.9–6.5 sec, providing three minutes of imaging post contrast injection. Automated reconstructions were performed on a custom system interfaced to the MRI scanner. Typically all reconstructions were completed and images sent back to the scanner console within 2 min after the end of the contrast-enhanced run. The total examination time, time from patient entry to exit of the scan room, is about 15 min.
RESULTS
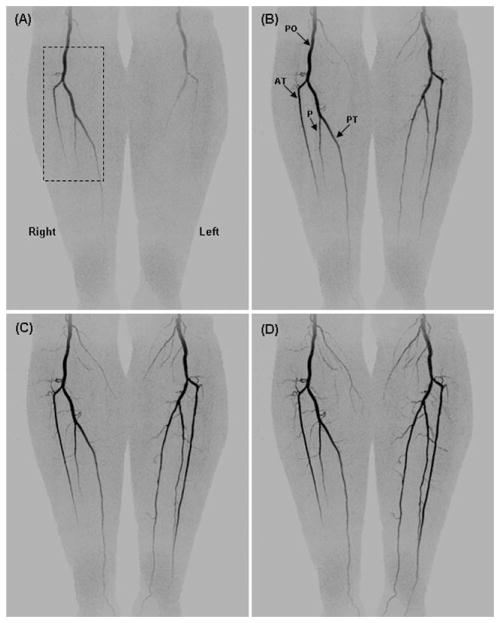
Figure 3 shows coronal maximum intensity projections (MIPs) from four consecutive time frames (45, 50, 55, and 60 sec post contrast material injection) from a volunteer with mild peripheral vascular disease. This study shows progressive filling of the normal vasculature of the lower legs. The major vessels are labeled: popliteal arteries (PO), anterior tibial arteries (AT), posterior tibial arteries (PT), and peroneal arteries (P). The time-resolved nature of the study allows for visualization of filling patterns, and illustration of the delayed filling of the left popliteal artery. Figure 4 shows oblique magnified targeted MIPs from the right leg corresponding to the region identified in the dashed box of Figure 3A. Figure 4A–4D corresponds respectively to the time frames in Figure 3A–3D. These magnified, temporally consecutive, and progressively obliqued images of Figure 4 highlight three-dimensional portrayal of fine muscular branches arising from each of the major arteries. Figure 4E–4G show thin axial MIPs from the frame D at the S/I positions indicated by the black dashed lines. The volunteer study results in Figures 3 and 4 are representative of the S/I coverage, contrast-to-noise-ratio (CNR), fine detail, and temporal resolution that we are able to obtain throughout the CAPR acquisition time series.
Fig. 3.
Temporally consecutive coronal MIPs from a volunteer study at 45, 50, 55, and 60 sec post-injection. Depiction of major vessels (labeled) popliteal artery (PO), anterior tibial (AT), peroneal (P), and posterior tibial (PT) arteries.
Fig. 4.
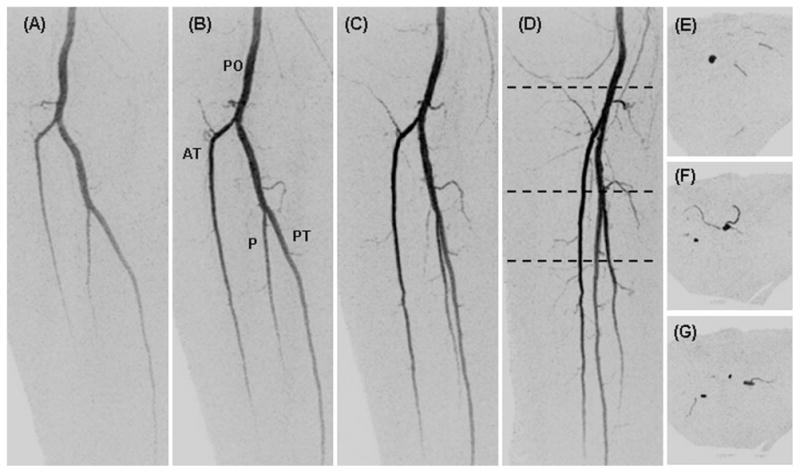
Targeted oblique MIPs of the right leg from the study of Figure 3 (dashed region of Fig. 3A) showing the fine detail captured in the small muscular branches. Consecutive time frames (A–D) at 45, 50, 55, and 60 sec post-injection are projected respectively at 0, 30, 60, and 90° rotated from the anterior-posterior direction. Black dashed lines in D show the S/I positions at which thin axial MIPs were taken (E–G).
Figure 5A–E shows temporally consecutive MIPs from a patient with peripheral vascular disease. Asymmetric left/right filling is depicted. The vasculature of the right leg is relatively normal (with minor stenoses in the anterior tibial artery), whereas the left leg vessels have an abnormal structure and filling pattern, characterized by extensive collateral vessel formation. On the left side, the popliteal artery is occluded and is not visualized at the level of the knee. The posterior tibial artery or tibioperoneal trunk fills through small collateral vessels, and there is also collateral reconstitution of the anterior tibial artery. The peroneal artery is completely occluded. There is some signal drop-off at the edges of the receiver coil in this study that impairs visualization of the vasculature at the most superior and inferior aspects of the FOV. Figure 5F shows a Time-of-Arrival (TOA) map (Riederer et al., 2009) in which the time of contrast material arrival at each voxel is determined and mapped to a color scale shown at the bottom of the image. The TOA map highlights contrast arrival to the right leg (arrow) after almost complete arterial enhancement of the left leg. The red-orange colors mark the earliest filling arteries, seen only on the left leg, while the yellow-green colors mark the later filling vessels, the arteries of the right leg and veins of the left leg.
Fig. 5.
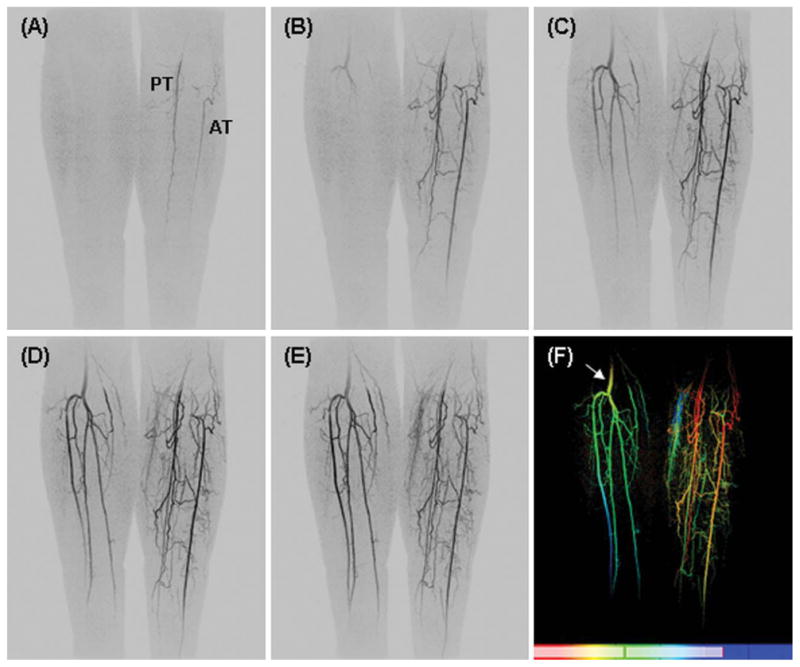
A–E. Coronal MIPs from consecutive 4.9-sec time frames from a patient with vascular disease. Asymmetric left/right filling with occlusion of the left popliteal artery. F: Time-of-arrival (TOA) map showing abnormal vascular filling pattern. Additional details are provided in the text.
Figure 6 shows coronal MIPs from a patient with prior left femoral-popliteal artery bypass graft. The distal anastomosis is well seen (B, arrow). In the right leg, the distal popliteal artery is patent as is the tibioperoneal trunk. However, the anterior and posterior tibial arteries are thrombosed, and there is single vessel runoff to the ankle via the peroneal artery (C, arrow). At the ankle, collateral vessels from the peroneal artery reconstitute the dorsalis pedis (D, arrow) and plantar arteries in the right foot. On the left side, the distal portion of a femoral-popliteal artery bypass graft is patent as is the tibioperoneal trunk. Similar to the right side the anterior tibial artery is largely occluded, and there is a single vessel runoff to the ankle via the peroneal artery, which supplies collateral arteries to reconstitute the dorsalis pedis artery in the foot.
Fig. 6.
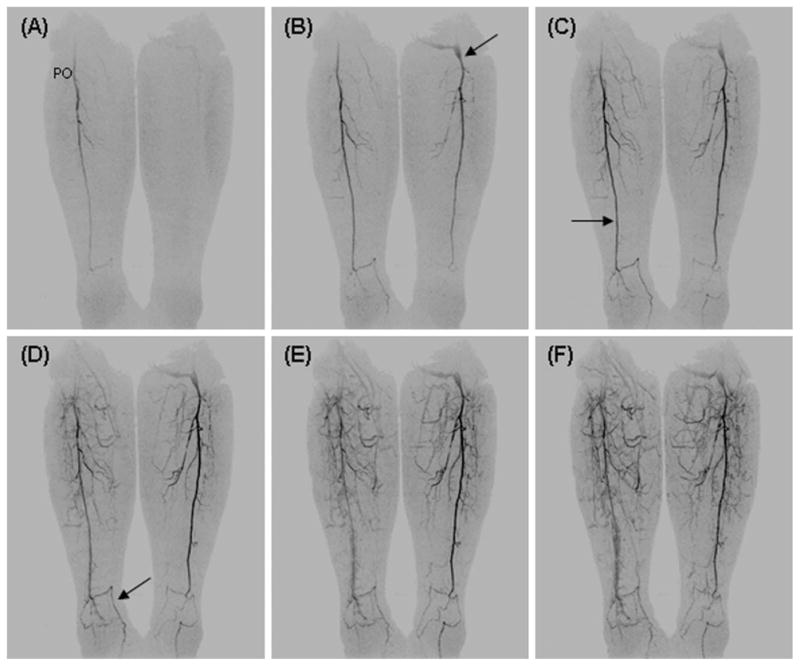
Coronal MIPs from consecutive 4.9-sec time frames from a patient with prior left femoral-popliteal artery bypass graft (B, arrow). On the right the distal popliteal artery (PO) is patent while the anterior and posterior tibial arteries are thrombosed with a single vessel runoff via the peroneal artery to the ankle (C, arrow). At the ankle, collateral arteries from the peroneal artery supply the dorsalis pedis (D, arrow) and plantar arteries of the foot. On the left, the distal portion of a femoral-popliteal artery bypass graft is patent. As on the right side there is single vessel runoff to the ankle with thrombosed anterior and posterior tibial arteries.
Figure 7 shows oblique MIPs from a foot study of a healthy volunteer. Figure 7A and 7B are oblique views of consecutive arterial time frames of both feet illustrative of the FOV imaged. Figures D–G show consecutive sagittal MIPs of the left foot from frames one, two, three and six after arrival of contrast material into the imaging FOV. They depict the course of blood flow from the anterior tibial artery (AT) to dorsalis pedis artery (DP) past the ankle where it divides into the arcuate artery (AC) and dorsal metatarsal arteries (DM). Progressive enhancement of the fine digital arteries and the calcaneal branches is well-depicted. The TOA image of the left foot in Figure 7C shows the arterial (red)-venous (blue) separation obtained with the time-resolved CAPR technique while at the same time visualizing fine vessels and vascular beds of the foot.
Fig. 7.
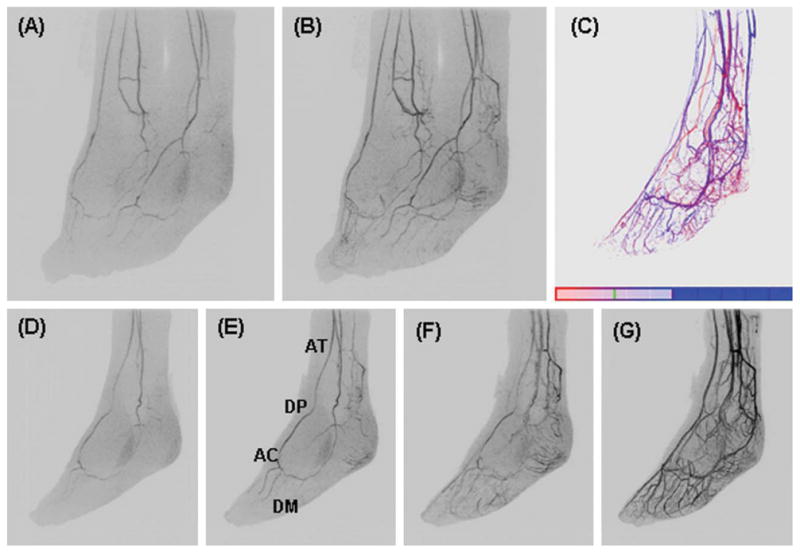
Feet volunteer study. A, B: Oblique MIPs (45° rotated from the sagittal plane) of two consecutive 6.5-sec time frames of both feet. D–G: Oblique MIPs at 0, 10, 20, 30, and 40° rotated from the sagittal plane at time frames one, two, three, and six respectively post-contrast material arrival of the left foot. C: TOA map of the left foot.
Figure 8 shows oblique MIPs from a patient with peripheral vascular disease of the left foot. The anterior tibial arteries show bilaterally poor filling down to the foot. There is filling of the distal arterial branches, the digital and calcaneal arteries, of the right foot. There is only sparse filling of these vessels on the left foot.
Fig. 8.
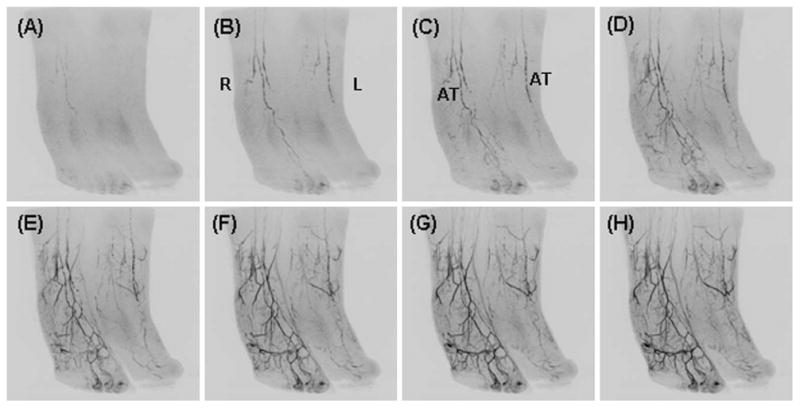
Oblique MIPs from consecutive time frames of a patient with peripheral vascular disease and pronounced reduction in flow to the left foot.
DISCUSSION
For diagnosis, treatment, and monitoring of patients with peripheral vascular disease, high fidelity imaging of the vasculature from the knee through the feet is desirable. DSA and to some extent CTA have been considered gold standards for assessment of peripheral vascular disease; however both techniques have limitations. Both use ionizing radiation. DSA uses intra-arterial contrast injection and has some associated risk of complication (Waugh and Sacharias, 1992). Moreover, it provides only 2D projection images. Vessel wall calcifications are well seen with CTA; however, these dense calcifications can sometimes limit visualization of the vessel lumen, particularly in the small diameter arteries of the lower legs and feet. Moreover, CTA uses large volumes (typically > 80 ml) of intravenously administered contrast material. The contrast bolus is diluted as it passes through the venous system, the heart, lungs, and the aorta, and in some cases by the time it reaches the lower legs and feet the diluted contrast provides relatively poor vascular opacification. Although the intravenously administered contrast bolus undergoes the same vascular pathway in MRA as in CTA, the contrast-filled vessels in MRA have the highest signal in the imaged region because of their high relaxation. In CTA the vascular signal is exceeded by the large signals from bone. Also, the long bolus transit time and uncertainty in synchronizing the CT scan with contrast passage may lead to situations in which the CT images are acquired either too early (before the contrast arrives) or too late (when there is suboptimal arterial opacification and significant venous contamination). Synchronizing CT image acquisition with contrast arrival is especially problematic in patients with transit times which are different between the two legs. Time-resolved CTA (Sommer et al., 2010) would obviate the timing issues but would require a significantly larger radiation dose than standard CTA, and the temporal resolution of the scan would be limited by the pitch of the scanner.
More recently, CE-MRA has emerged as an alternative method as it is able to provide high quality images in a relatively non-invasive study with no ionizing radiation. Initially, CE-MRA of the lower extremity was performed using a stepping table multi-station approach in which a single phase image was captured at each station, thighs, lower legs, and feet (Leiner et al., 2000; Meaney et al., 1999; Meissner et al., 2005). However, as in CTA it is difficult to time the acquisition to capture the peak arterial phase in the more distal stations (lower legs and feet), and time-resolved imaging would eliminate the need for timing and allow for high quality imaging in these regions (Andreisek et al., 2007). Previously reported methods for time-resolved CE-MRA of the lower leg have shown better or comparable performance to other MRA techniques (2D-TOF, bolus chase) (Du et al., 2002; Thornton et al., 2006; Tongdee et al., 2006). The CAPR technique presented here shows similar high performance with comparable or improved spatial resolution and frame time. This has been made possible by the development of advanced data sampling patterns, acceleration techniques such as parallel imaging, and multi-element receiver coil arrays. The CAPR technique employs acceleration techniques of 2D SENSE and 2D homodyne processing along with the use of a custom built receiver coil array to achieve high temporal (5 sec) and high spatial resolution (1 mm3 isotropic) imaging with high SNR. This allows not only the ability to portray the normal vessels with high spatial resolution, but also to visualize other vessels such as collateral arteries which might be spontaneously recruited under conditions of obstructed flow. The high contrast-to-noise ratio and excellent background suppression allow visualization of very small branches which are rarely visible on CTA. The time-resolved nature of the data acquisition may provide additional, clinically relevant information in cases such as asymmetric flow, rapid arterial-venous transit or arterial-venous malformations, and pre-surgical graft/flap assessment where it allows for assessment of the impact of the altered vessel morphology on function/flow dynamics. Finally, the acquisition of a high spatial temporal resolution dataset allows imaging of small arteries without concomitant opacification of adjacent veins which could otherwise interfere with accurate interpretation. Patients who may particularly benefit from CAPR CE-MRA include (i) those with known inflow disease/abnormal filling patterns or calcification and question of a distal target for bypass particularly when other non-invasive methods might not be reliable (Hingorani et al., 2007), (ii) those with ischemic ulcers or osteomyelitis in the ankles or feet resulting in differential L/R contrast arrival times, (iii) those who are relatively young and radiation exposure should be avoided, (iv) those who are expected to require multiple exams, (v) those allergic to iodinated contrast, and (vi) those with prior non-diagnostic CTA. CAPR has performed better than CTA in patients with significant atherosclerosis because artifact from the calcified vessels was avoided and because the time-resolved acquisition almost always provided an optimal arterial frame in each leg that avoided venous contamination. A radiological evaluation comparing the performance of CTA vs. CAPR MRA for imaging of the vessels of the lower legs is currently in progress (Young et al., 2010).
The above examples demonstrate the high quality, high temporal, and high spatial resolution imaging of the vessels of the lower legs and feet that can be obtained using the CAPR technique. The technique performed well in the entire patient population, with overall excellent image quality, SNR, and minimal image artifact. The volunteer and patient studies above show that a CAPR frame time of 5 sec appears to be adequate to depict the temporal dynamics of the vasculature of the lower leg. As shown in the examples, progressive filling of the arterial tree is captured, generally with multiple arterial frames prior to venous enhancement. Asymmetric filling of the left vs. right leg is depicted (Fig. 5) as are abnormal flow patterns and collateral filling (Figs. 5 and 6). These studies also demonstrate that the high spatial resolution and SNR of these exams enables visualization of main vessels down to fine muscular branches (Fig. 4) and communicating vessels (Fig. 6). Vascular pathology is also well-portrayed (Figs. 5 and 6).
The volunteer and patient studies of the feet suggest that a frame time of 6.5 sec and sub-mm spatial resolution provide high quality arterial phase imaging of the vasculature. Progressive arterial filling is captured with good arterial-venous separation (Fig. 7). The fine spatial resolution allows depiction of small branching vessels down to the digital and calcaneal arteries (Fig. 7). In diseased, low-flow cases the SNR may be reduced, but it still appears to be adequate for diagnostic imaging of stenotic vessels and abnormal flow patterns (Fig. 8).
Time-of-arrival mapping is a technique applied to the CAPR acquisition that provides a summary image of the temporal and spatial characteristics of a study. From the image time series, the time of contrast material arrival to each pixel is determined and mapped to a color scale of choice. The images readily portray abnormal filling patterns (Fig. 5F) and arterial-venous separation (Fig. 7C), and they can be helpful in radiological diagnosis and planning of intervention.
One potential limitation to this technique is the susceptibility to motion. If there is not exact anatomical alignment between the calibration and CAPR scans there may be residual aliasing. This has not been a problem as the patient’s lower legs and feet were well-secured during the exam. As in other imaging techniques, motion during the acquisition will cause blurring. A current technical limitation to making this technique more widely available is the necessity for a fully circumferential surface coil array of eight or more elements. As clinical MRI scanners continue to evolve technically to having multiple, e.g. eight or more, receiver channels and the appropriate multicoil arrays, the methods reported will become more widely available. A limitation of the implementation presented here is the coverage that can currently be obtained with our specialized coil arrays. Although we are imaging a 40 cm S/I FOV in the lower legs the coils are only 27 cm long, leading to coil signal drop-off at the upper and lower edges of the FOV. With longer coil arrays we may maintain high signal throughout the S/I FOV at the cost of slightly lower SNR in the central region. However, even with the uniform response over a 40 cm S/I FOV the entire lower legs and feet cannot be imaged in a single exam. Current work includes extending the CAPR time-resolved acquisition to imaging of the upper extremity and hands (Haider et al., 2009a) and imaging multiple stations, e.g., a proximal lower leg station and a distal foot station, in a single exam and contrast bolus injection (Johnson et al., 2010). Future work includes extending to more than two stations of time-resolved imaging so as to include inflow to the legs at the level of the pelvis and thighs through the feet. This extended coverage is currently only possible with multistation bolus chase MRA techniques which capture a single phase image at each station or CTA. As such, if there is a patient with a known or questionable proximal lesion it is important that coverage is adequate to assess inflow, and CTA is generally ordered. If the focus of a case is limited to the distal anatomy or if the inflow proximally can be assessed by ultrasound, then the current CAPR technique provides adequate coverage. Extending the coverage of the CAPR technique will allow for more widespread clinical use.
In summary, the CAPR time-resolved CE-MRA technique with the use of specialized multielement surface coil arrays provides high temporal and high spatial resolution imaging of the vasculature of the lower legs and feet. Accelerated acquisition methods allow for rapid imaging while maintaining high spatial resolution. Multielement surface coil arrays allow for accelerated imaging and maintenance of high SNR. The CAPR technique for imaging of the lower legs and feet has been rigorously tested in volunteer studies and is now clinically available in protocols that are routinely ordered at our institution.
Acknowledgments
Grant sponsor: NIH; Grant numbers: EB00212, HL070620, RR018898.
References
- Andreisek G, Pfammatter T, Goepfert K, Nanz D, Hervo P, Koppensteiner R, Weishaupt D. Peripheral arteries in diabetic patients: Standard bolus-chase and time-resolved MR angiography. Radiology. 2007;242:610–620. doi: 10.1148/radiol.2422051111. [DOI] [PubMed] [Google Scholar]
- Bernstein MA, Fain SB, Riederer SJ. Effect of windowing and zero-filled reconstruction of MRI data on spatial resolution and acquisition strategy. J Magn Reson Imaging. 2001;14:270–280. doi: 10.1002/jmri.1183. [DOI] [PubMed] [Google Scholar]
- Du J, Carroll TJ, Wagner HJ, Vigen K, Fain SB, Block WF, Korosec FR, Grist TM, Mistretta CA. Time-resolved, undersampled projection reconstruction imaging for high-resolution CE-MRA of the distal runoff vessels. Magn Reson Med. 2002;48:516–522. doi: 10.1002/mrm.10243. [DOI] [PubMed] [Google Scholar]
- Fukaya E, Saloner D, Leon P, Wintermark M, Grossman RF, Nozaki M. Magnetic resonance angiography to evaluate septocutaneous perforators in free fibula flap transfer. J Plast Reconstr Aesthet Surg. 2010;63:1099–1104. doi: 10.1016/j.bjps.2009.06.002. [DOI] [PubMed] [Google Scholar]
- Graziani L, Piaggesi A. Indications and clinical outcomes for below knee endovascular therapy: Review article. Catheter Cardiovasc Interv. 2010;75:433–443. doi: 10.1002/ccd.22287. [DOI] [PubMed] [Google Scholar]
- Haider CR, Glockner JF, Stanson AW, Riederer SJ. High temporal and spatial resolution time-resolved 3D CE-MRA of the hands and feet. Proc Joint Ann Mtg ISMRM-ESMRMB; Honolulu. 2009a. [Google Scholar]
- Haider CR, Glockner JF, Stanson AW, Riederer SJ. Peripheral vasculature: High-temporal- and high-spatial-resolution three-dimensional contrast-enhanced MR angiography. Radiology. 2009b;253:831–843. doi: 10.1148/radiol.2533081744. [DOI] [PMC free article] [PubMed] [Google Scholar]
- Haider CR, Hu HH, Campeau NG, Huston J, III, Riederer SJ. 3D high temporal and spatial resolution contrast-enhanced MR angiography of the whole brain. Magn Reson Med. 2008;60:749–760. doi: 10.1002/mrm.21675. [DOI] [PMC free article] [PubMed] [Google Scholar]
- Hingorani A, Ascher E, Marks N, Mutyala M, Shiferson A, Flyer M, Jacob T. Comparison of computed tomography angiography to contrast arteriography for patients undergoing evaluation for lower extremity revascularization. Vasc Endovascular Surg. 2007;41:115–119. doi: 10.1177/1538574406297265. [DOI] [PubMed] [Google Scholar]
- Johnson CP, Haider CR, Borisch EA, Glockner JF, Riederer SJ. Time-resolved bolus-chase MR angiography with real-time triggering of table motion. Magn Reson Med. 2010;64:629–637. doi: 10.1002/mrm.22537. [DOI] [PMC free article] [PubMed] [Google Scholar]
- Leiner T, Ho KY, Nelemans PJ, de Haan MW, van Engelshoven JM. Three-dimensional contrast-enhanced moving-bed infusion-tracking (MoBI-track) peripheral MR angiography with flexible choice of imaging parameters for each field of view. J Magn Reson Imaging. 2000;11:368–377. doi: 10.1002/(sici)1522-2586(200004)11:4<368::aid-jmri4>3.0.co;2-5. [DOI] [PubMed] [Google Scholar]
- Meaney JF, Ridgway JP, Chakraverty S, Robertson I, Kessel D, Radjenovic A, Kouwenhoven M, Kassner A, Smith MA. Stepping-table gadolinium-enhanced digital subtraction MR angiography of the aorta and lower extremity arteries: Preliminary experience. Radiology. 1999;211:59–67. doi: 10.1148/radiology.211.1.r99ap1859. [DOI] [PubMed] [Google Scholar]
- Meissner OA, Rieger J, Weber C, Siebert U, Steckmeier B, Reiser MF, Schoenberg SO. Critical limb ischemia: Hybrid MR angiography compared with DSA. Radiology. 2005;235:308–318. doi: 10.1148/radiol.2343031685. [DOI] [PubMed] [Google Scholar]
- Met R, Bipat S, Legemate DA, Reekers JA, Koelemay MJ. Diagnostic performance of computed tomography angiography in peripheral arterial disease: A systematic review and meta-analysis. JAMA. 2009;301:415–424. doi: 10.1001/jama.301.4.415. [DOI] [PubMed] [Google Scholar]
- Meyer BC, Oldenburg A, Frericks BB, Ribbe C, Hopfenmuller W, Wolf KJ, Albrecht T. Quantitative and qualitative evaluation of the influence of different table feeds on visualization of peripheral arteries in CT angiography of aortoiliac and lower extremity arteries. Eur Radiol. 2008;18:1546–1555. doi: 10.1007/s00330-008-0914-0. [DOI] [PubMed] [Google Scholar]
- Mistretta CA, Grist TM, Korosec FR, Frayne R, Peters DC, Mazaheri Y, Carrol TJ. 3D time-resolved contrast-enhanced MR DSA: Advantages and tradeoffs. Magn Reson Med. 1998;40:571–581. doi: 10.1002/mrm.1910400410. [DOI] [PubMed] [Google Scholar]
- Mostardi PM, Haider CR, Rossman PJ, Borisch EA, Riederer SJ. Controlled experimental study depicting moving objects in view-shared time-resolved 3D MRA. Magn Reson Med. 2009;62:85–95. doi: 10.1002/mrm.21993. [DOI] [PMC free article] [PubMed] [Google Scholar]
- Noll DC, Nishimura DG, Macovski A. Homodyne detection in magnetic resonance imaging. IEEE Trans Med Imaging. 1991;10:154–163. doi: 10.1109/42.79473. [DOI] [PubMed] [Google Scholar]
- Norgren L, Hiatt WR, Dormandy JA, Nehler MR, Harris KA, Fowkes FG. Inter-Society Consensus for the Management of Peripheral Arterial Disease (TASC II) J Vasc Surg. 2007;45(Suppl S):S5–S67. doi: 10.1016/j.jvs.2006.12.037. [DOI] [PubMed] [Google Scholar]
- Ota H, Takase K, Igarashi K, Chiba Y, Haga K, Saito H, Takahashi S. MDCT compared with digital subtraction angiography for assessment of lower extremity arterial occlusive disease: Importance of reviewing cross-sectional images. AJR Am J Roentgenol. 2004;182:201–209. doi: 10.2214/ajr.182.1.1820201. [DOI] [PubMed] [Google Scholar]
- Prince MR, Yucel EK, Kaufman JA, Harrison DC, Geller SC. Dynamic gadolinium-enhanced three-dimensional abdominal MR arteriography. J Magn Reson Imaging. 1993;3:877–881. doi: 10.1002/jmri.1880030614. [DOI] [PubMed] [Google Scholar]
- Riederer SJ, Haider CR, Borisch EA. Time-of-arrival mapping at three-dimensional time-resolved contrast-enhanced MR angiography. Radiology. 2009;253:532–542. doi: 10.1148/radiol.2532082322. [DOI] [PMC free article] [PubMed] [Google Scholar]
- Schoenberg SO, Rieger J, Weber CH, Michaely HJ, Waggershauser T, Ittrich C, Dietrich O, Reiser MF. High-spatial-resolution MR angiography of renal arteries with integrated parallel acquisitions: Comparison with digital subtraction angiography and US. Radiology. 2005;235:687–698. doi: 10.1148/radiol.2352031693. [DOI] [PubMed] [Google Scholar]
- Sommer WH, Helck A, Bamberg F, Albrecht E, Becker CR, Weidenhagen R, Kramer H, Reiser MF, Nikolaou K. Diagnostic value of time-resolved CT angiography for the lower leg. Eur Radiol. 2010;20:2876–2881. doi: 10.1007/s00330-010-1861-0. [DOI] [PubMed] [Google Scholar]
- Thornton FJ, Du J, Suleiman SA, Dieter R, Tefera G, Pillai KR, Korosec FR, Mistretta CA, Grist TM. High-resolution, time-resolved MRA provides superior definition of lower-extremity arterial segments compared to 2D time-of-flight imaging. J Magn Reson Imaging. 2006;24:362–370. doi: 10.1002/jmri.20630. [DOI] [PubMed] [Google Scholar]
- Tongdee R, Narra VR, McNeal G, Hildebolt CF, El-Merhi F, Foster G, Brown JJ. Hybrid peripheral 3D contrast-enhanced MR angiography of calf and foot vasculature. AJR Am J Roentgenol. 2006;186:1746–1753. doi: 10.2214/AJR.05.0388. [DOI] [PubMed] [Google Scholar]
- Waugh JR, Sacharias N. Arteriographic complications in the DSA era. Radiology. 1992;182:243–246. doi: 10.1148/radiology.182.1.1727290. [DOI] [PubMed] [Google Scholar]
- Weiger M, Pruessmann KP, Boesiger P. 2D SENSE for faster 3D MRI. MAGMA. 2002;14:10–19. doi: 10.1007/BF02668182. [DOI] [PubMed] [Google Scholar]
- Wilman AH, Riederer SJ. Improved centric phase encoding orders for three-dimensional magnetization-prepared MR angiography. Magn Reson Med. 1996;36:384–392. doi: 10.1002/mrm.1910360309. [DOI] [PubMed] [Google Scholar]
- Young PM, Glockner JF, Haider CR, Mostardi PM, Vrtiska TJ, Macedo TA, Riederer SJ. Comparison of high spatial resolution time-resolved 3D contrast-enhanced MR angiography. Proc Joint Ann Mtg ISMRM-ESMRMB; Stockholm. 2010. [Google Scholar]


