

Abstract
Bast (phloem) fibers, tension wood fibers, and other cells with gelatinous-type secondary walls are rich in crystalline cellulose. In developing bast fibers of flax (Linum usitatissimum), a galactan-enriched matrix (Gn-layer) is gradually modified into a mature cellulosic gelatinous-layer (G-layer), which ultimately comprises most of the secondary cell wall. Previous studies have correlated this maturation process with expression of a putative β-galactosidase. Here, we demonstrate that β-galactosidase activity is in fact necessary for the dynamic remodeling of polysaccharides that occurs during normal secondary wall development in flax fibers. We found that developing stems of transgenic (LuBGAL-RNAi) flax with reduced β-galactosidase activity had lower concentrations of free Gal and had significant reductions in the thickness of mature cellulosic G-layers compared with controls. Conversely, Gn-layers, labeled intensively by the galactan-specific LM5 antibody, were greatly expanded in LuBGAL-RNAi transgenic plants. Gross morphology and stem anatomy, including the thickness of bast fiber walls, were otherwise unaffected by silencing of β-galactosidase transcripts. These results demonstrate a specific requirement for β-galactosidase in hydrolysis of galactans during formation of cellulosic G-layers. Transgenic lines with reduced β-galactosidase activity also had biochemical and spectroscopic properties consistent with a reduction in cellulose crystallinity. We further demonstrated that the tensile strength of normal flax stems is dependent on β-galactosidase-mediated development of the phloem fiber G-layer. Thus, the mechanical strength that typifies flax stems is dependent on a thick, cellulosic G-layer, which itself depends on β-galactosidase activity within the precursor Gn-layer. These observations demonstrate a novel role for matrix polysaccharides in cellulose deposition; the relevance of these observations to the development of cell walls in other species is also discussed.
The primary phloem fibers of flax (Linum usitatissimum) are among the longest and strongest cells found in plants, with a mean length of 77 mm and tensile strength of 1100 MPa reported in some varieties (Mohanty et al., 2000). Known also as bast fibers, these cells provide structural support to the shoot and are used by humans in the production of textiles and other materials (Deyholos, 2006). The mechanical properties of bast fibers result from the composition of their secondary walls, which are classified as gelatinous-type walls. These walls are comprised almost entirely of a thick structure called the gelatinous-layer (G-layer; Gorshkova et al., 2010). G-layers are found within phloem fibers of diverse taxa, in xylem fibers of reaction wood (e.g. tension wood of dicotyledonous trees), in some vines and tendrils (Bowling and Vaughn, 2009), in roots of geophytes (Schreiber et al., 2010), and even in early diverging lineages represented by Equisetum hyemale (Gierlinger et al., 2008). In flax and other species, the G-layer is rich in cellulose microfibrils that are oriented nearly parallel to the longitudinal axis of the fiber and that interact laterally, producing large regions of crystallinity. The high content of crystalline, axially oriented cellulose and a very low content of xylans and lignin distinguish flax phloem fibers from the fibers typically found in xylem and normal wood (Gorshkova et al., 2010). Throughout the remainder of this report, we will use the term fiber to refer to phloem fibers exclusively.
Development of primary fibers begins with their specification near the apical meristem; in flax stems, all phloem fibers are derived from this primary meristem (Esau, 1943). The fibers elongate, mostly through intrusive growth, until the onset of secondary wall development. The transition from fiber elongation to cell wall thickening is associated with a mechanically defined region of the stem called the snap point (Gorshkova et al., 2003). Fibers below this region have cells walls with a distinctive, bipartite appearance (Gorshkova and Morvan, 2006). The inner part of the developing cell wall is called the galactan-enriched matrix (Gn-layer), and the outer part is the G-layer. Transmission electron microscopy shows the Gn-layer to be a loosely packed and heterogeneous structure, with parallel bands of electron-dense material separated by a more transparent matrix. In contrast, the G-layer is much more homogeneous and lacks the electron-dense bands. As secondary wall development proceeds, the newly deposited Gn-layer is gradually remodeled into the G-layer, which increases in thickness. At fiber maturity, the Gn-layer has been fully transformed into the G-layer (Gorshkova et al., 2004). The transition of the Gn-layer to G-layer is therefore a process of secondary wall remodeling during fiber development.
Accumulated evidence indicates that the transition from Gn-layer to G-layer involves modification of a tissue-specific galactan. This molecule is found in the Golgi as a 700- to 2,000-kD polymer and consists of a rhamnogalacturonan I (RG-I) backbone that is highly substituted with β-(1→4)-galactans, which comprise its bulk (Gorshkova et al., 2004; Salnikov et al., 2008). The tissue-specific galactan is secreted into the developing Gn-layer and is presumably responsible for the intense labeling of the Gn-layer that can be detected by the oligo-β-(1→4)-galactan-specific LM5 antibody (Jones et al., 1997). The galactan side chains also undergo at least partial hydrolysis during fiber development; this is correlated with a high accumulation of free Gal in fiber-bearing tissues below the snap point (Mikshina et al., 2009). In mature cells, mainly galactans of 100 to 400 kD can be detected, and these are tightly bound to cellulose microfibrils (Gurjanov et al., 2008). Thus, partial hydrolysis of a tissue-specific galactan is closely correlated with the formation of the cellulose-rich cell wall of flax fibers.
An active β-galactosidase and the high Mr, tissue-specific galactan can be copurified from flax stem tissues below the snap point (Mikshina et al., 2009). The purified β-galactosidase showed exogalactanase activity against β-(1→4)-galactans, including the tissue-specific galactan of flax fibers. Although recombinant flax β-galactosidases have not been produced, partial sequences of a candidate β-galactosidase gene have been deduced from microarray experiments (Roach and Deyholos, 2007). Transcripts for a putative β-galactosidase are up to 4.0-fold more abundant in fiber-bearing stem peels from the snap point, as compared to regions above the snap point. Furthermore, proteomic comparisons of fibers and their surrounding tissues at the snap point showed that a putative β-galactosidase was up to 9.3-fold more abundant in developing phloem fibers than the surrounding nonfiber cells of the cortex (Hotte and Deyholos, 2008). Finally, histochemical staining of stems and hypocotyls with the chromogenic substrate X-gal shows β-galactosidase activity to be localized to developing fibers (Roach and Deyholos, 2008). Therefore, the expression of a β-galactosidase that acts on a tissue-specific galactan is closely correlated with fibers undergoing secondary wall thickening.
Together, the observations we have summarized above provide correlative evidence for the action of β-galactosidase on a tissue-specific galactan during fiber maturation. In these experiments, we cloned the genomic fragment containing this β-galactosidase. We also tested the hypothesis that β-galactosidase has a specific role in remodeling a tissue-specific galactan and that this activity is necessary for the conversion of the Gn-layer to the crystalline cellulosic G-layer of the mature flax fibers. By inhibiting this transition, we were also able to test whether the presence of a G-layer was required to give flax stems their characteristic strength.
RESULTS
Previous studies have correlated phloem fiber secondary wall thickening with increased expression of transcripts and peptides encoding a putative β-galactosidase, increased β-galactosidase activity, and accumulation of free Gal (Day et al., 2005; Mikshina et al., 2009; Roach and Deyholos, 2007, 2008; Hotte and Deyholos, 2008). To test whether development of the strong, cellulosic secondary cell wall of phloem fibers is dependent on the normal activity of β-galactosidase, we cloned a full-length fiber-expressed gene encoding a putative β-galactosidase (LuBGAL1) and decreased its expression using RNA interference (RNAi)-mediated silencing in flax. Transcripts of the LuBGAL1 gene are known from prior microarray studies to increase in abundance in tissues in which phloem fibers are undergoing secondary wall development (Roach and Deyholos, 2007, 2008; Hotte and Deyholos, 2008).
We determined the full-length sequence of LuBGAL1 by isolating a fosmid clone from a flax genomic library using PCR primers that amplified an EST previously shown to be up-regulated at the developmental transition in phloem fibers (Roach and Deyholos, 2007). The fosmid clone contained a putative β-galactosidase gene that encoded a 731 amino acid protein (predicted pI, 6.3; 81 kD), which we labeled LuBGAL1 (Supplemental Fig. S1; GenBank accession HQ902252). After isolating the fosmid that encoded LuBGAL1, a whole-genome shotgun (WGS) sequence assembly of flax became available (linum.ca; M.K. Deyholos, unpublished data). BLASTP alignment of the LuBGAL1 sequence to the predicted proteins of the WGS identified 39 other putative β-galactosidases (BLASTP e-value < 1−22), which all contained a GH35 glycosylhydrolase domain (pfam e-value < 1−4). These alignments identified a second locus with very high similarity to LuBGAL1 (linum.ca accession g34036), which we referred to as LuBGAL2 (linum.ca accession g34036). LuBGAL2 is slightly shorter than LuBGAL1 (predicted 613 amino acids, 68 kD, and 5.9 pI), but the two proteins are 96% identical in their amino acid sequence, 97% identical at the nucleotide level within their coding sequences, and 94% identical within their predicted 3′ untranslated regions (UTRs). Using gene-specific primers, we confirmed that both sequences LuBGAL1 and LuBGAL2 exist independently within the flax genome (data not shown).
Phylogenetic analysis of LuBGAL1 and LuBGAL2 showed that they could both be classified within subgroup a1 of the β-galactosidases, along with 11 other predicted flax proteins (Fig. 1; Gantulga et al., 2009). Among Arabidopsis (Arabidopsis thaliana) proteins, LuBGAL1 was most similar to AtBGAL12 (AT4G26140, BLASTP e-value = 0.0, bit score 1026, 69% identical, 80% similar, TAIR10 database), although AtBGAL04 and AtBGAL02 also show nearly as much similarity. All of the members of subgroup a1 from Arabidopsis have been shown to be exogalactanases that act on pectic polysaccharides of the cell wall; all six gene products hydrolyze β-(1,4)- and β-(1,3)-linked galactooligosaccharides, and AtBGAL12 also hydrolyzes β-(1,6)-galactooligosaccharides.
Figure 1.

Neighbor-joining tree of putative β-galactosidase amino acid sequences flax and Arabidopsis. Groups are labeled according to Gantulga et al. (2009). For clarity, flax gene identifiers are not shown, except for LuBGAL1 (Lu01) and LuBGAL2 (Lu02) in subgroup a1. Flax sequences are derived from the draft WGS assembly at linum.ca (M.K. Deyholos, unpublished data). [See online article for color version of this figure.]
We used peptide mass fingerprinting to relate LuBGAL1 and LuBGAL2 with the native β-galactosidase activity previously characterized in flax stems (Mikshina et al., 2009). This native β-galactosidase coeluted with the tissue-specific galactans that typify developing phloem fibers; the enzyme also uses the tissue-specific galactans as a substrate. A single protein, β-galactosidase (National Center for Biotechnology Information gi 3641863; Cicer arietinum), was identified as a significant match (P < 0.0005) in a database search (National Center for Biotechnology Information nonredundant database, Mascot score 69) of all of the peptides obtained from the coeluted protein extract (Supplemental Fig. S2). None of the other peptides produced significant matches. Moreover, the peptide (VVQQAGLYVNLR) was found in only two of all of the predicted proteins in the flax genome: LuBGAL1 and LuBGAL2. This peptide was also found in proteins differentially expressed in developing flax fibers compared to surrounding stem tissues (Hotte and Deyholos, 2008). Together, these observations suggest that LuBGAL1 and/or LuBGAL2 encode a protein enriched specifically within developing flax fibers and that this protein likely functions as a β-galactosidase as described by Mikshina et al. (2009).
To examine the impact of reduced expression of this putative β-galactosidase during fiber development, we constructed an RNAi silencing vector based on the pHELLSGATE12 plasmid (Helliwell and Waterhouse, 2003). The silencing construct contained a 340-bp fragment of LuBGAL1 that included the complete 3′ UTR and 50 bp of the coding region nearest the stop codon. This construct contained 93% identity to predicted transcripts of LuBGAL2 and is therefore expected to silence both of these transcripts. The silencing construct did not align to any other part of the WGS assembly (linum.ca). Following transformation of this vector into the flax (linseed) variety Norlin, we characterized three independent transformants that showed decreased abundance of the LuBGAL1 and/or LuBGAL2 transcript in stem peels as measured by quantitative reverse transcription-PCR (Fig. 2A). The decreased transcript abundance in each transgenic line was accompanied by a decrease in the enzymatic activity of β-galactosidase that was measured in stem peels (Fig. 2B).
Figure 2.

Transcript expression and enzyme activity. A, Relative transcript abundance of LuBGAL1 in three independent LuBGAL-RNAi lines (1–3). Transcript expression is shown relative to a nontransgenic sibling (WT), which is shown with an arbitrary value of 1 as a reference. B, β-Galactosidase activity (units/mg fresh weight) as determined with the chromogenic substrate о2-nitrophenyl β-d-galactopyranoside in the wild type and three independent LuBGAL-RNAi lines (1–3). Each measurement represents an average of three independent biological replicates; error bars show sd. [See online article for color version of this figure.]
Because one of the products of β-galactosidase activity is Gal, and Gal is known to accumulate in tissues of flax bearing developing fibers, we measured the content of Gal within stem peels of wild-type and LuBGAL-RNAi lines (Fig. 3A; Mikshina et al., 2009). In wild-type plants, the concentration of free monomeric Gal was 137 μg/g. This concentration was decreased in transgenic plants, which contained between 30 and 51 μg/g free Gal in stem peels. This represented a 2.7- to 4.6-fold reduction in free Gal and demonstrated that the metabolic products of β-galactosidase were reduced in stem peels. Conversely, when we measured the presumed substrates of β-galactosidase, we found an approximately 2-fold increase in the proportion of galactans among the cell wall polysaccharides weakly bound to cellulose (extracted by ammonium oxalate) in LuBGAL-RNAi lines compared with wild-type controls (Fig. 3B). Therefore, the reduced β-galactosidase activity effected by RNAi had an impact on the metabolism of cell wall-associated galactans.
Figure 3.

A, Content of free Gal (μg/g fresh weight) in the wild type and three independent LuBGAL-RNAi lines (1–3). Each measurement represents an average of three independent biological replicates; error bars show sd. B, Proportion of galactan among cell wall polysaccharides weakly bound to cellulose (extracted by ammonium oxalate). [See online article for color version of this figure.]
To characterize the effects of LuBGAL-RNAi on the biochemical structure of cells walls, we purified fibers from stem peals, isolated their cells walls, and characterized their composition (Table I). Gal yield was increased in all three analyzed cell wall fractions of transgenic plants, while ammonium oxalate-extracted fraction showed some increase of GalUA. The tissue-specific galactan associated with developing flax phloem fibers is built from a RG backbone with long galactan side chains. Therefore, the ratio between Gal and Rha (Gal/Rha) can be used as a indication of the average length of these galactan side chains, and this ratio decreases as the tissue-specific galactan is incubated with its natively associated β-galactosidase (Mikshina et al., 2009). We therefore measured Gal/Rha in three extracts of cell walls from wild-type and LuBGAL-RNAi plants (Fig. 4). The Gal/Rha ratio differed in various fractions of the same cell wall, which was presumably mainly due to the presence of Gal-containing polymers, other than tissue-specific galactan, i.e. arabinogalactan proteins. However, in all extracts, the Gal/Rha ratio was higher in transgenic plants than in the wild type, consistent with retention of longer galactan side chains on the RG-I backbone of the tissue-specific galactan, when β-galactosidase activity is reduced. These observations provide further evidence that the RNAi-mediated reduction in β-galactosidase activity had an impact on the metabolism of cell wall-associated galactans.
Table I. Monosaccharide composition (μg/mg CW) of cell wall fractions in isolated fibers of the wild type and three independent LuBGAL-RNAi lines (1–3).
| Fraction | Gal |
Rha |
Ara |
GalA |
||||||||||||
| WT | 1 | 2 | 3 | WT | 1 | 2 | 3 | WT | 1 | 2 | 3 | WT | 1 | 2 | 3 | |
| AO | 5 ± 1 | 8 ± 0 | 9 ± 1 | 9 ± 1 | 2 ± 1 | 2 ± 0 | 2 ± 0 | 2 ± 0 | 7 ± 1 | 6 ± 1 | 6 ± 0 | 6 ± 1 | 15 ± 4 | 21 ± 1 | 22 ± 2 | 21 ± 5 |
| KOH | 16 ± 2 | 25 ± 6 | 27 ± 5 | 28 ± 4 | 3 ± 0 | 3 ± 1 | 3 ± 1 | 4 ± 0 | 12 ± 1 | 9 ± 2 | 11 ± 3 | 12 ± 4 | 7 ± 1 | 8 ± 2 | 8 ± 2 | 8 ± 0 |
| Tightly bound | 8 ± 2 | 13 ± 1 | 11 ± 1 | 16 ± 1 | 1 ± 0 | 1 ± 0 | 1 ± 0 | 1 ± 0 | 1 ± 0 | 1 ± 0 | 1 ± 0 | 1 ± 0 | 1 ± 0 | 1 ± 0 | 1 ± 0 | 1 ± 0 |
| Total | 29 ± 2 | 46 ± 2 | 47 ± 2 | 53 ± 2 | 6 ± 0 | 6 ± 0 | 6 ± 0 | 7 ± 0 | 20 ± 1 | 15 ± 1 | 18 ± 1 | 19 ± 2 | 23 ± 2 | 30 ± 1 | 31 ± 1 | 30 ± 2 |
Figure 4.

Gal/Rha in cell wall fractions of isolated fibers in the wild type and three independent LuBGAL-RNAi lines (1–3). Cell walls were sequentially extracted by ammonium oxalate (AO) and potassium hydroxide (KOH), and the residue was dissolved to obtain tightly bound cellulose matrix polysaccharides. Each measurement is an average of three independent biological replicates assayed in triplicate; error bars show se. [See online article for color version of this figure.]
Anatomical characteristics of LuBGAL-RNAi lines are summarized in Table II. Compared with the wild type, stems of transgenic plants were the same length or slightly longer. Within each stem, we also measured the position of the snap point, which marks the transition to secondary wall deposition during fiber development. The distance between the apex and snap point did not differ significantly between the wild type and any transgenic line. Likewise, the average stem diameter and the number of fibers observed in stem cross sections were similar in all genotypes. The similarities of these aspects of transgenic and wild-type anatomy indicate that decreased expression of LuBGAL1 did not affect either the specification of phloem fibers or the temporal program of fiber development.
Table II. Morphological characteristics of WT and LuBGAL-RNAi transgenic lines.
| Plant Line | Stem Length (cm) | Stem Diameter | Snap Point Position from Apex (cm) | Average No. of Fibers per Stem |
| cm | μm | cm | ||
| WT | 25.9 ± 0.14 | 1319 ± 116 | 7.4 ± 0.12 | 337 ± 39 |
| pHGBGAL 1 | 27.4 ± 0.56* | 1321 ± 116 | 8.0 ± 0.48 | 340 ± 28 |
| pHGBGAL 2 | 25.6 ± 0.87 | 1235 ± 91 | 7.7 ± 0.52 | 307 ± 25 |
| pHGBGAL 3 | 25.1 ± 0.86 | 1215 ± 91 | 7.7 ± 0.33 | 315 ± 18 |
Measurements were made using 6-week-old stems. Values shown are average ± se. Stem length, n = 20; snap point position, n = 20; and fibers per stem, n = 9. Values with an asterisk denote statistical significance in a Student’s two-tailed t test (P < 0.05).
We examined the structure of phloem fibers using light microscopy (Fig. 5). In wild-type plants, fiber secondary cell walls viewed in cross section showed the characteristic bipartite structure often seen in developing bast fibers: A striated Gn-layer that appeared loosely packed was surrounded by a more homogeneous G-layer of comparable thickness (Fig. 5A; Gorshkova et al., 2003; Gorshkova and Morvan, 2006). In LuBGAL-RNAi lines, this normal bipartite anatomy was disrupted; the outer G-layer was greatly reduced and was difficult to detect (Fig. 5B). We quantified the thickness of the fiber cell wall and the proportion of the wall comprised of the Gn-layer (Fig. 6). The total cell wall thickness was unchanged for most transgenic lines (Fig. 6A), while each of the transgenic lines showed a significant increase in the proportion of the Gn-layer and, therefore, a corresponding decrease in the proportion of the G-layer (Fig. 6B). Thus, the reduction in β-galactosidase activity that we observed in LuBGAL-RNAi lines could be correlated specifically with increased persistence of the loosely packed Gn-layer in phloem fiber cells. We note that because measurements were made on fresh tissue, some swelling may cause the absolute values of wall thickness (especially Gn-layers) to be overestimated.
Figure 5.

Microscopic examination of phloem fiber development. Wild type (A) and transgenic (B), a representative LuBGAL-RNAi line (line 1). Phloem fibers (f), transport phloem (p), and xylem (x) are visible in each panel. A distinct border between G-layer and Gn-layer is visible in phloem fibers of the wild-type plant (arrows). Sections were made near the middle of the stem of 4-week-old plants and were stained with toluidine blue. Bars = 50 μm.
Figure 6.

Thickness of phloem fiber cell walls and their component layers. Observed frequency of different measurement classes made on cross sections of stem phloem fibers of wild-type and LuBGAL-RNAi transgenic flax lines 1, 2, and 3. A, Total cell wall thickness of phloem fibers (in micrometers). B, Proportion (%) of total cell wall thickness comprised of the Gn-layer. For each line, n > 109. In B only, the distribution of measurements for each of the transgenic lines was significantly different from the wild type (t test adjusted P value < 0.01). [See online article for color version of this figure.]
To confirm that the inner Gn-layers we observed in both wild-type and transgenic plants (Fig. 5) were equivalent to the galactan-rich layer previously described in flax phloem fibers, we used the LM5 antibody for immunolocalization (Fig. 7; Andeme-Onzighi et al., 2000; Gorshkova et al., 2003; Blake et al., 2008). LM5 specifically recognizes four or more contiguous units of a β-(1→4)-galactosyl polymer (Jones et al., 1997). In wild-type stems, LM5 labeling in bast fibers was predominant in the lumen and in the cell wall layer closest to the plasma membrane (Fig. 7, A and C). However, in LuBGAL-RNAi transgenic lines with reduced β-galactosidase, LM5 labeling covered a much larger domain that spread toward the outer cell wall, and the antibody binding was considerably more intensive per cell wall area unit (Fig. 7, B and D). These results indicated that decreased expression of LuBGAL1 expanded the distribution of galactan epitopes within the cell wall. Furthermore, the presence of the intensively LM5-labeled domain was correlated with a failure of transition from the Gn-layer to the G-layer.
Figure 7.

Stem cross sections immunolabeled with the LM5 antibody. Fluorescent microscopy of nontransgenic (A) and a representative LuBGAL-RNAi line (B). TEM immunogold microscopy of a nontransgenic line (C) and a LuBGAL1-RNAi line (D). Bars = 100 μm in A and B and 5 μm in C and D.
To characterize the effects of LuBGAL-RNAi on the biochemical structure of cell walls, we first measured total sugars and uronic acids within cell wall extracts (Fig. 8). Sequential extraction of cell wall material was performed using trifluoroacetic acid (TFA; to hydrolyze RG-pectins and hemicellulose) and H2SO4 (to hydrolyze homogalacturonans and hemicellulosic sugars tightly linked to cellulose). No significant differences were detected in the sugar content of H2SO4 extracts for any of the lines. However, statistically significant increases in total sugar in the TFA extract were observed in at least two of the LuBGAL-RNAi lines compared with the wild type (Dubois et al., 1956; Fig. 8A). Uronic acid contents were also assayed (Blumenkrantz and Asboe-Hansen, 1973) within the same TFA and H2SO4 extracts used to quantify total sugars (Fig. 8B). However, significantly more total sugars and uronic acids were present in the TFA extract of LuBGAL-RNAi lines 1 and 3 than the wild type. Therefore, the composition of the TFA-accessible cell wall polysaccharide matrix differed between the wild type and at least some of the lines with reduced β-galactosidase activity.
Figure 8.

Total sugar contents in stems of TFA and H2SO4 extracts of wild type and three independent LuBGAL-RNAi lines (1–3). A, Total sugar content was measured by phenol-sulfuric acid assay. B, Total uronic acid content was measured by a colorimetric metadiphenylphenol assay. Each measurement is an average of three independent biological replicates assayed in triplicate. Error bars show se. An asterisk denotes statistical significance as determined by Student’s two-tailed t test (P < 0.05). [See online article for color version of this figure.]
We next compared wild-type and LuBGAL-RNAi transgenic plants using Fourier transform infrared (FTIR) spectroscopy, which is an additional method for detecting changes in cell wall composition. The difference in absorbance (difference = transgenic − control) is shown in Figure 9. For all of the transgenic lines compared with the wild type, differences were observed in spectral regions associated with cellulose and pectin polymers. Reduction in absorbance of cellulose-related wavelengths was seen at 1,162, 1,130, 1,098, and 900 cm−1 (Agarwal and Atalla, 1986; Atalla et al., 1992; Gilbert et al., 1993). Furthermore, it has been reported that the absorbance at 1,098 and 1,130 cm−1 is associated with crystalline cellulose (Stewart et al., 1995). On the other hand, the spectra from transgenic lines were positively correlated with peaks at 1,064, 1,260, 1,458, 1,608, 1,728, and 1,740 cm−1, corresponding to potentially increased pectic content (Himmelsbach et al., 1998) of transgenic lines compared with the wild type. The FTIR spectroscopy analyses are therefore consistent with a decrease in crystalline cellulose and an increase in pectic polysaccharide content in the transgenic lines. To further probe the structure of cellulose within the cell walls of LuBGAL-RNAi transgenic plants and wild-type controls, we also analyzed these tissues using x-ray diffraction (Fig. 10). The diffraction curves for all the samples analyzed fit the typical curve of cellulose I, and the peak height of the transgenic lines was measured to be between 65% and 88% of the wild type (mean 77%), consistent with a lower proportion of crystalline cellulose being present in cell walls of each of the transgenic lines compared to the wild type. In this method, peak height is assumed to be proportional to the crystallinity index, and relative comparisons can be made between samples, although due to the high concentration of uronic acids in the transgenic lines, the quantitative crystallinity index cannot be accurately quantified (Sato et al., 2001; Park et al., 2010).
Figure 9.

FTIR difference spectra of hypocotyls of transgenic lines 1, 2, and 3 and wild-type control. Absorbance at each wavelength in the WT was subtracted from absorbance in the respective LuBGAL-RNAi transgenic line, and the difference was plotted here. Absorbance values shown are the average of at least 15 scans for each line. [See online article for color version of this figure.]
Figure 10.

X-ray diffractogram of hypocotyls of transgenic lines 1, 2, and 3 and wild-type control. The x-ray diffraction data were collected using CuKα radiation. [See online article for color version of this figure.]
Flax bast fibers are known for their high tensile strength. We tested whether this strength is dependent on the normal transition of the loosely packed galactan matrix to the highly crystalline and cellulose-rich cell wall of mature flax bast fibers. We compared the tensile strength of developing stems of LuBGAL-RNAi transgenic lines with wild-type plants (Fig. 11). The maximum load that could be supported by a stem was measured at 3-cm intervals along the length of individual stems. Similar loads were sustained by stem segments from above the snap point of both wild-type and mutant plants. In both genotypes, the maximum load increased sharply below the snap point, consistent with development of fiber secondary cell walls in this part of the stem. However, wild-type plants supported a significantly higher load below the snap point compared to LuBGAL-RNAi plants. At 15 cm distance from the shoot apex, an individual wild-type stem was able to support a mean 1.5-kg load, but LuBGAL-RNAi plants could support only 1.2 kg. These results confirmed that the transition from Gn- to G-layer in fiber secondary cell walls, which failed to occur in LuBGAL-RNAi plants, is necessary for the characteristic mechanical strength of flax stems, although we cannot exclude the possibility that changes in tissues outside of the phloem fiber bundles also contributed to the mechanical weakening in the transgenic lines.
Figure 11.
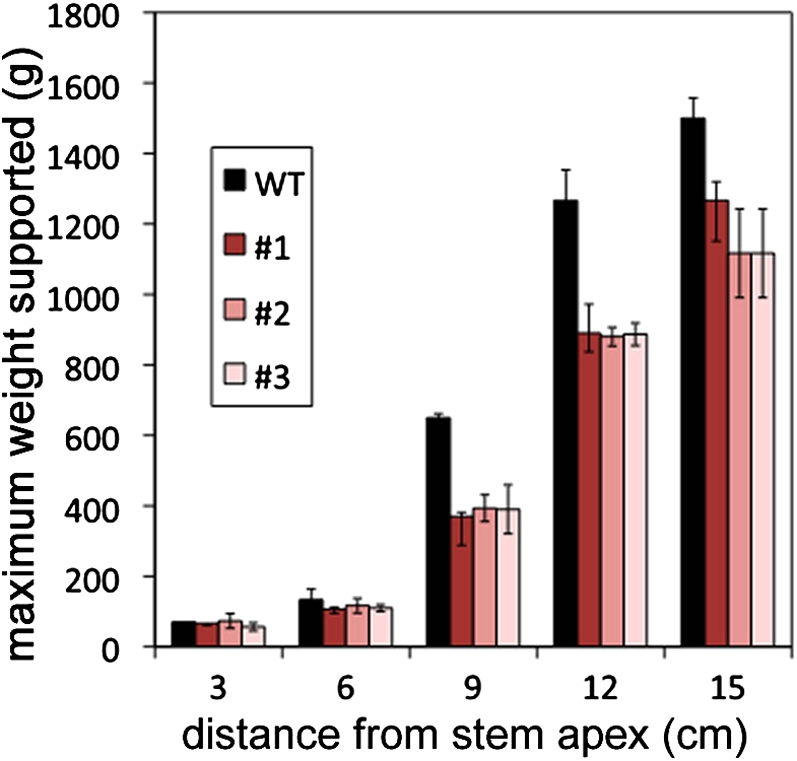
Stem strength of wild-type and LuBGAL-RNAi lines. Weight was added to individual stems at defined locations relative to the stem apex. The minimum amount of weight (g) necessary to cause stem breakage was recorded. n = 3 for each genotype; error bars show se. [See online article for color version of this figure.]
DISCUSSION
A role for a tissue-specific β-galactosidase in fiber development was previously proposed based on transcript and protein expression patterns of a gene named LuBGAL1, whose expression coincides with the onset of fiber cell wall deposition in stems and hypocotyls (Roach and Deyholos, 2007, 2008; Hotte and Deyholos, 2008). This expression pattern is also correlated with a β-galactosidase that has been copurified with a tissue-specific galactan (i.e. RG-I backbone with long galactan side chains) known to be deposited during secondary wall development in flax fibers (Gorshkova et al., 2004; Mikshina et al., 2009). The tissue-specific galactan is a substrate for the native β-galactosidase. In addition to the spatially and temporally correlated expression patterns of the transcript, protein, and β-galactosidase activity, the native β-galactosidase was shown here to contain a peptide found in only two proteins in the flax genome, LuBGAL1, and its close relative, LuBGAL2 (Supplemental Fig. S2). Based on phylogenetic analysis, both LuBGAL1 and LuBGAL2 can be classified within β-galactosidase subgroup a1 (Fig. 1). All of the characterized members of this subgroup act as exogalactanases of cell wall-derived pectic polysaccharides (Gantulga et al., 2009). Definitive proof that LuBGAL1 and LuBGAL2 encode functional β-galactosidases could be obtained through recombinant protein assays; however, it is reasonable to make this preliminary assumption based on phylogenetic classification and the unique peptide shared by the native enzyme and LuBGAL1 and LuBGAL2. Further evidence is provided by the observed reduction in β-galactosidase activity, reduction in β-galactosidase metabolites, increase in residual cell wall-associated galactans, and increased Gal/Rha ratio that was correlated with RNAi-mediated suppression of LuBGAL1 and LuBGAL2 transcripts in the LuBGAL-RNAi transgenics (Figs. 2–4). Although we were not able here to distinguish between LuBGAL1 and LuBGAL2 transcripts, the reduced β-galactosidase activity in the transgenic plants is unambiguous and allows for further exploration of the role of this enzyme in cellulosic cell wall development, which is the primary focus of this report. However, because the RNAi construct was expressed throughout stem tissues, it must be acknowledged that some of the observed effects on aggregate stem properties may also involve changes in cell walls of tissues outside of the bast fibers; indirect effects due to changes in concentrations of free Gal are also possible.
Galactan remodeling has been proposed to be associated with the conversion of galactan-rich cell wall layers that appear loosely packed (Gn-layer) into cell wall layers that appear densely packed (G-layer) and are rich in the crystalline cellulose that typifies gelatinous-type fibers (Gorshkova and Morvan, 2006). Several lines of evidence from the transgenic studies reported here support this role. The main support is that LuBGAL-RNAi lines showed distinctive changes in the bipartite structure of their phloem fibers (Figs. 5–7), indicating a decreased ability to convert the loosely packed layers into tightly packed wall layers. The domain of the loosely packed wall layers occupied an expanded region of the fiber cell wall. Decreased expression of LuBGAL1 may therefore increase the persistence of loosely packed layers by decreasing or preventing the remodeling of the tissue-specific galactan, which prohibits tight packing of the cell wall layers. A model for this activity is shown in Figure 12.
Figure 12.

A model for a role of LuBGAL1 in secondary wall maturation of flax fibers. A tissue-specific, high molecular weight galactan is delivered to the developing Gn-layer by specific secretory vesicles (Salnikov et al., 2008). This abundant galactan is interspersed between nascent cellulose microfibrils, preventing their close association and maintaining the loosely packed morphology characteristic of developing regions of flax bast fiber secondary walls. During secondary wall maturation, the high molecular weight galactan is partially digested by LuBGAL, releasing Gal. Removal of high molecular weight galactan by LuBGAL allows cellulose microfibrils to associate in the highly crystalline matrix typical of mature G-layers, although a galactan with significantly lower molecular weight still remains associated with the secondary cell wall. At maturity, essentially all of the Gn-layer is converted to G-layer. [See online article for color version of this figure.]
Persistence of the tissue-specific galactan in transgenic lines was confirmed by immunodetection with LM5 antibodies (Fig. 7). Previous reports have shown that the tissue-specific galactan is detectable by the LM5 antibody in Golgi bodies and vesicles (Gorshkova and Morvan, 2006; Salnikov et al., 2008) and in the inner-most (loosely packed) layer of the bipartite cell wall (Andeme-Onzighi et al., 2000; His et al., 2001; Blake et al., 2008; Salnikov et al., 2008). In this study, wild-type stem LM5 labeling was detected mostly in the wall layers closest to the lumen, whereas in the transgenic line, the detection of LM5 was expanded throughout the entire thickness of the fiber cell wall.
Three additional types of biochemical analyses also further evidence of the role of β-galactosidase in producing a tightly packed secondary wall that is rich in crystalline cellulose. First, it is hypothesized that the tissue-specific galactan, after remodeling, becomes tightly cross-linked with other cell wall polymers (Fig. 12). The increased sugars and uronic acids measured in TFA extracts of transgenic lines compared to the wild type is consistent with the hypothesis that the cell walls of the transgenic plants remain more loosely packed, allowing better access to, and therefore more complete extraction of, sugars and uronic acids (Fig. 8). Second, FTIR spectra of total cell wall material from transgenic lines reflected a reduction in crystalline cellulose content of transgenic line based on peaks at 1,162, 1,130, and 1,098 cm−1 (Fig. 9). Hypocotyls were used for FTIR and subsequent x-ray diffraction, as these tissues contain phloem fibers that are in every measurable way similar to stem phloem fibers, but it is easier to obtain a large mass of homogeneous tissues from hypocotyls (Roach and Deyholos, 2008). Absorbances over the region 1,200 to 1,090 cm−1 were reported to be associated with crystalline cellulose, whereas absorbance at 900 cm−1 is characteristic of antisymmetric out-of-phase ring stretch of amorphous cellulose (Stewart et al., 1995). An increase in the proportion of pectin is evident from the peaks at 1,608, 1,728, and 1,740 cm−1. Vibration mode at 1,616 cm−1 denotes the carboxylate region (COOH) of GalUA residues (Stewart et al., 1995; Himmelsbach et al., 1998), while vibration at 1,728 and 1,740 cm−1 has been reported to be associated with C = O stretch for methyl ester of pectin (Evans, 1991; Kemp, 1991; Stewart et al., 1995; Himmelsbach et al., 1998). Third, x-ray diffraction analyses showed decreased cellulose crystallinity in tissues of transgenic lines (Fig. 10).
Transgenic LuBGAL-RNAi lines, in which the thickness of the G-layer was decreased, showed a reduction in stem strength of up to 30% compared to control plants, in which the G-layer was fully developed (Fig. 11). Other properties of fibers, such as fiber diameter and fiber cell wall thickness, were not affected. It is therefore reasonable to conclude that the presence of the mature G-layer of bast fibers is a major contributor to stem strength, and this component of stem strength is dependent on the action of β-galactosidase. However, it must be noted that because the RNAi construct was expressed all tissues of the stem, there may be additional effects outside of the phloem that contributed to the reduced stem strength.
Flax fibers are classified as gelatinous fibers (Gorshkova and Morvan, 2006; Gorshkova et al., 2010). These are characterized by a very high proportion of cellulose (up to 90%) and axial orientation of cellulose microfibrils throughout the G-layer. This contrasts with S-layers, which are the best-known secondary cell wall type in xylem and normal wood. S-layers have a helicoidal orientation of cellulose microfibrils and abundant lignin and xylan, two polymers nearly absent in gelatinous fibers. In flax fibers, the matrix polymers are pectic galactans, built upon a RG-I backbone (Davis et al., 1990; Gurjanov et al., 2008). RG-I was also detected by cytochemical approaches in tension wood of several species (Bowling and Vaughn, 2008). Other matrix polymers have also been detected in fibers with gelatinous cell wall layers. Xyloglucan was shown to be the major noncellulosic polysaccharide in isolated G-layers of poplar (Populus spp.) tension wood (Nishikubo et al., 2007; Kaku et al., 2009). Arabinogalactan proteins, as judged by the increase of the corresponding gene expression upon induction of G-layer, may also be another matrix component (Lafarguette et al., 2004; Andersson-Gunneras et al., 2006; Roach and Deyholos, 2007).
Tension wood is a well-studied tissue that is enriched in gelatinous fibers. Tension wood is induced during mechanical stress, and its fibers are known to have contractile properties (Clair et al., 2006; Mellerowicz et al., 2008). The contractile ability is usually based on the different swelling capacities of S- and G-layers due to the different orientations of cellulose microfibrils in each type of layer (Goswami et al., 2008; Burgert and Fratzl, 2009). The presence of matrix polysaccharides is actually ignored in this model. However, matrix polymers have been proposed to contribute to the mechanical properties of gelatinous-type cell walls in at least two ways, in addition to the developmental role described above. First, G-layers have a high swelling capacity, which presumably results from the abundance of RG-I (Bowling and Vaughn, 2008). Second, in the absence of large amounts of lignin and xylan within the G-layer, microfibrils of cellulose interact laterally, entrapping some matrix polysaccharides. The presence of the entrapped polysaccharides during lateral interactions of axially oriented microfibrils causes longitudinal tensile stress in the cellulose (Mellerowicz et al., 2008). In developing flax fibers, the fiber-specific complex RG-I with β-(1→4)-galactan side was proposed to fill this role (Gorshkova et al., 2010). By modifying in muro galactan metabolism in this study, we provide further evidence that matrix polysaccharides confer specific mechanical properties on cellulose-enriched plant fibers.
G-layers consist of highly crystalline cellulose. The highly ordered assembly of cellulose synthase complexes within the plasma membrane is believed to be, at least partially, responsible for cellulose crystallinity, as the cellulose synthase complexes organize coalescence of individual glucan chains into a cellulose microfibril. However, interactions of matrix polymers with the nascent glucan chains can also affect the crystalline properties of the cellulose microfibrils and the further aggregation of microfibrils into macrofibrils (Ding and Himmel, 2006). Previous studies have shown that cellulose microfibril aggregation can be increased via the postsynthetic removal of matrix polymers, such as pectins, xyloglucans (Thimm et al., 2009), and xylans (Ha et al., 1998), as well as by modulation of the hydration status of the matrix polymers (Thimm et al., 2000). Through these results, along with our results presented here, a potential role emerges for noncellulosic matrix polysaccharides in influencing the aggregation and crystallinity of cellulose microfibrils. As highly crystalline cellulose is a major stumbling block in the enzymatic conversion of biomass to biofuels (Himmel et al., 2007; Harris et al., 2009), matrix polysaccharides therefore represent a promising target for exerting finely tuned modulation of cellulose crystallinity.
MATERIALS AND METHODS
Plant Materials
Flax (Linum usitatissimum) var Norlin seeds were donated by Gordon Rowland (Crop Development Center, Saskatoon, SK, Canada). For morphological characterization, plants were grown in boxes containing a 50-cm layer of soil in the open at natural daylight and daily watering. The experiment was performed at the period of rapid growth (6 weeks after the sowing). Plant material was sampled with regard to the location of a snap point, the marker for the fiber transition from the elongation to the formation of secondary cell wall with separation of fibrous and xylem parts. Stem length and position of snap point were determined for 20 plants of each line.
Fosmid Library Construction and Genomic Screening
DNA was extracted from etiolated flax seedlings of variety CDC Bethune. The fosmid library was produced using the CopyControl Fosmid Library Production Kit (EPICENTRE Biotechnologies). The library was further pooled (approximately 80 clones per well) and screened via PCR for the target gene. Bgal_FOR1 (5′-TCAGCATACTGCCTGATTGC-3′) and Bgal_REV1 (5′-CCATCCTCGGTGGTTGTATC-3′) primers were designed from cDNA sequence referenced as probe set 4738 in Roach and Deyholos (2007). This was tested on flax genomic DNA and found to amplify a fragment of roughly 200 bp. A single isolate was identified after successive rounds of restreaking and PCR. The fosmid clone containing LuBGAL1 was isolated from an induced 25-mL culture (CopyControl Induction solution from Library Kit) using a Qiagen Plasmid Midi Kit (catalog no. 12143). Identity was confirmed through sequencing using BigDye v3.1 using existing primers. Shotgun sequencing was performed by nebulizing approximately 10 μg of fosmid, and fragments were size selected for 1.5- to 2-kb pieces on a 1% agarose (1× Tris-acetic acid EDTA) gel and gel extracted. Fragments were ligated into a SmaI-digested and shrimp alkaline phosphatase-dephosphorylated pUC19 and transformed into Escherichia coli strain DH5α. A total of 288 clones was submitted to Canada’s Michael Smith Genome Sciences Centre for bidirectional sequencing off of the M13 forward and reverse primers. Sequence assembly was performed using the default settings of Genetool 2.0 sequence assembler. PCR was also used to distinguish LuBGAL1 and LuBGAL2 by amplification of genomic DNA. Gene-specific primers used for this purpose were LuBGAL1 (5′-AAACCCAACTACCCAAGTCG-3′ and 5′-CAGAAAGAACTCACCAAAACCA-3′) and LuBGAL2 (5′-TTTTACCCTCTTGTTTGTTGAAAA-3′ and 5′-TAGATATGGGCCACCCAAAA-3′).
Plasmid Construction
RNAi (knockout) vectors were constructed using Gateway recombination cloning technology and the pHELLSGATE RNAi vector (Helliwell and Waterhouse, 2003). A 340-bp region of the LuBGAL1 transcript, located largely within the 3′ UTR, was PCR amplified from cDNA template using primers modified with attB sites (5′-3′ Fwd primer, attB site + ACCACGCGTCCGAGAT; 5′-3′ Rev primer, attB site + GGGTCATTCACTCACTTGAGC) to perform recombination cloning using the pHELLSGATE12 system. Constructs were transformed into GV3101 Agrobacterium tumefaciens.
Tissue Culture
Plant transformations of flax variety ‘Norlin’ were conducted using a protocol adapted from Mlynarova et al. (1994) and Wrobel-Kwiatkowska et al. (2004). Flax hypocotyls were grown for 6 d on half-strength Murashige and Skoog (MS) + 1% Suc plates + 0.7% phytablend agar. Agrobacterium infection was performed on cut hypocotyl segments in 20 mL cocultivation media containing 1× MS, 3% Suc, 1 mg/L benzyladenine (BA), 0.1 mg/L naphthylacetic acid (NAA), and 20 μm acetosyringone for 2 h with agitation. Hypocotyl explants were then transferred to cocultivation solid media containing 1× MS salts, 3% Suc, 0.7% phytablend agar, 1 mg/L BA, 0.1 mg/L NAA, and 100 μm acetosyringone for 3 d. Hypocotyl explants were transferred to shoot initiation/selection media containing 1× MS salts, 3% Suc, 0.7% phytablend agar, 1 mg/L BA, 0.1 mg/L NAA, 300 mg/L Timentin, and 200 mg/L kanamycin to promote callus development and select against nontransformed hypocotyl segments. Explants were maintained on selection media for 2 to 3 weeks under 16-h/8-h light/dark cycles. Calli were excised from the infected ends of the hypocotyls and placed on selective shoot regeneration media containing 1× MS, 2.5% Suc, 0.7% phytablend, 0.02 mg/L BA, 0.001 mg/L NAA, 300 mg/L Timentin, and 220 mg/L kanamycin for 2 weeks. Calli were transferred to fresh shoot regeneration media every 2 weeks. As shoots developed, they were excised from the callus and transferred to shoot elongation media containing 1× MS, 1% Suc, 0.7% phytablend, 100 mg/L Timentin, and 100 mg/L kanamycin. Shoots elongated for 2 weeks and then were transferred to root induction media containing half-strength MS, 1% Suc, 0.7% phytablend, 0.2 mg/L IBA, 100 mg/L Timentin, and 100 mg/L kanamycin. Those transgenics that produced well-developed roots were transferred to soil and grown up for T1 seed collection. Transgene confirmation in T1 plants was conducted by genomic DNA PCR for the nptII selectable marker. T2 seeds were planted out on soil, and tissue was collected for quantitative reverse transcription analysis to quantify expression of the target gene. Negative siblings of the transgenic lines were used as controls; similar results were obtained when wild-type plants were used as controls.
Quantitative Reverse Transcription-PCR
RNA was extracted from transgene-containing plants and a Norlin-nontransformed positive control. For reverse transcription, 2 μg of total RNA pretreated with DNase I and primed with oligo(dT)12-18 was used. Primers LuGAL_F (5′-AACTGCGGTGGCTGTTCTTAC-3′) and LuGAL_R (5′-ATGACCGCGGAACATGGTA-3′) were used for subsequent amplification. Threshold cycles (CT) were determined using 7500 Fast Software. CT values were normalized using elongation factor 1-α as an endogenous control. ΔΔCT values were generated using the wild-type nontransgenic negative sibling sample as a reference.
Cell Wall Biochemistry
Bast fiber bundles were purified from 10-cm fiber-enriched peels collected below the snap point. The surrounding tissues were removed by several washings in 96% ethanol with gentle stirring by pestle in a mortar. Fiber purity was confirmed by microscopy. Fibers were dried and ground in liquid nitrogen, and cell walls were isolated according to Talmage et al. (1973). To remove starch, the pellet was digested overnight with glucoamylase (Siekagaki Kogyo). Cell walls (35–50 mg) were extracted sequentially by 0.5% ammonium oxalate (pH 7.0) and 4 m KOH. Matrix polysaccharides, tightly bound to cellulose microfibrils, were isolated according to Joseleau et al. (1980). The pellet, remaining after cell wall treatment with chelator and alkali was left in water overnight, then cellulose was dissolved by addition of 4-methyl morpholine-N-oxide monohydrate (MMNO; Sigma-Aldrich) at 70°C for 2 to 3 h (10 mg of pellet per 66.5 mL of water and 0.5 g MMNO with 2 mL dimethyl sulfoxide). Cellulose was reprecipitated by hot water and hydrolyzed by cellulase (Cellusoft-L; Novo Nordisk Bioindustrrie; 10 μL in 1.5 mL of 0.01 m AcONa buffer, pH 5.2) for 72 h at 37°C. Supernatants before and after cellulase treatment were combined and used to analyze matrix polysaccharides, tightly bound to cellulose.
The fractions extracted by ammonium oxalate, KOH, and obtained after treatment with MMNO and cellulase were purified from salts and low-Mr products on Sephadex G-25 column (15 × 50 mm; GE Healthcare; Supelco), dried, hydrolyzed with 2 m TFA at 120°C for 1 h, and used for monosaccharide analysis by high-performance anion-exchange chromatography on a CarboPac PA-1 column (4 × 250 mm; Dionex) equipped with a pulsed amperometric detector (Dionex; rate of elution 1 mL/min and column temperature of 30°C). Gradient elution was conducted with buffer A (100 mm NaOH in 1 m sodium acetate) and buffer B (15 mm NaOH) according to the following scheme: 0 to 20 min in 100% B, 20 to 21 min in 90% B and 10% A, 22 to 41 min in 50% B and 50% A, 42 to 55 min in 100% A, and 56 to 85 min in 100% B. The results were analyzed using a PeakNet software product.
To characterize cell wall composition in hypocotyls, used for FTIR experiments, dried cell wall material was obtained by incubating hypocotyls in 1:1 methanol:chloroform for at least 1 week. Then, samples were rinsed in acetone and dried. Cell wall material was sequentially extracted first with 2 m TFA to extract RG-pectins and hemicellulose and then concentrated sulfuric acid (H2SO4) to extract homogalacturonans (calcium pectates) and hemicellulosic sugars linked to cellulose. Cell wall material was incubated in 2 m TFA at a concentration of 1 mL TFA per mg dried cell wall material for 2 h at 110°C (Morvan et al., 1991; Douchiche et al., 2007). Cell wall residue was removed from the TFA extract by filtration and was then extracted with concentrated (18 m) sulfuric acid for 1 h at room temperature and then was diluted with water to 1 m sulfuric acid and incubated for 2 h at 110°C. Sugar quantifications were completed using the TFA and H2SO4 sugar extracts. Total sugars were quantified by the Dubois method (Dubois et al., 1956) using standards of Gal. Uronic acids were quantified (Blumenkrantz and Asboe-Hansen, 1973) using GalUA as a standard. Measurements are an average of three independent biological replicates.
Microscopy
Homozygous lines were initially analyzed microscopically by either hand-sectioning or Vibratome sectioning of fresh tissues and then stained with toluidine blue. Both stems and hypocotyls were examined for abnormalities related to fiber development in particular or cell wall development in general. For quantification, fibers were counted in 1/8 part of cross section for nine plants of each line. Measurements of the fiber cell wall and Gn thickness on the thin cross sections were obtained in between cell corners with the Aim Image Browser program provided with the microscope. The total numbers of fibers that were measured are as follows: wild type, 109; line 1, 119; line 2, 115; and line 3, 124.
For immunofluorescence, 5-week stems were thinly sectioned using a Vibratome and then fixed in 4% paraformaldehyde in PEM buffer (50 mm PIPES, 5 mm EGTA, and 5 mm MgSO4, pH 6.9) for 1 h under vacuum (McCartney et al., 2003). After fixation, sections were washed extensively in 1× phosphate-buffered saline (PBS). Primary antibody detection was conducted using a 10× dilution of LM5 antibody for β-(1→4)-d-galactan in 1× PBS + 5% (w/v) skim milk powder for 1 h. Sections were then washed extensively in 1× PBS. Secondary antibody detection was conducted in the dark using a 100× dilution of anti-rat Ig -fluorescein isothiocyanate conjugate in 1× PBS + 5% (w/v) skim milk powder for 1 h. Sections were washed extensively in 1× PBS and then viewed using epifluorescence.
Samples for electron microscopy were prepared according to Salnikov et al. (2008). Briefly, stem segments (20 mm), collected 10 to 12 cm below the snap point, were prefixed by infiltration under vacuum with 0.5% glutaraldehyde in 0.05 m Na-phosphate buffer (pH 7.4) and left in this solution for 3 h at room temperature. Then, 5-mm pieces were cut out from the middle part of the 20-mm samples, fixed in 2.5% glutaraldehyde in 0.1 m Na- phosphate buffer (pH 7.4) overnight at 4°C, and postfixed with 1.0% osmium tetroxide for 1 h. After dehydration, the samples were embedded in LR White resin (Ted Pella). Ultrathin sections for immunolocalization were cut with a diamond knife on an LKB Ultracut III ultramicrotome, mounted on Formvar-coated 100-mesh nickel grids, and stained for 20 min with 2% aqueous uranyl acetate and then for 2 min with lead citrate at room temperature (Reynolds, 1963). Sections were examined with a JEOL 1200 EX transmission electron microscope operating at 80 kV. For immunolocalization, ultrathin sections were (1) blocked (15 min, room temperature, high-humidity chamber) in Tris-buffered saline plus 5% bovine serum albumin; (2) incubated (2 h, room temperature) with primary antibody LM5 [monoclonal, rat IgG, specific to (1→4)-β-galactan; Plant Probes; Jones et al., 1997] diluted 1:200 with Tris-buffered saline plus Tween 20/0.6% bovine serum albumin; (3) washed three times in 20 mm Tris buffer (TB); (4) incubated (2 h, room temperature) with secondary antibody (goat anti-rat coupled to 5-nm colloidal gold; Amersham Pharmacia Biotech) diluted 1:50 with TB plus 0.06% bovine serum albumin; and (5) washed in TB and water. Silver enhancement of gold particles conjugated to the secondary antibody was carried out using the BB International Silver Enhancing Kit (Ted Pella); the solution was applied for 2 to 5 min (Hainfield and Powell, 2000). Control experiments were performed by omitting primary antibody. The LM5 antibody was kindly provided by Dr. P. Knox (University of Leeds, UK).
Analysis of Free Monomeric Gal Content and β-Galactosidase Activity in Fiber-Enriched Peels of Flax Stem
For analysis of free monomeric Gal content and β-galactosidase activity, stem peels (fibrous parts) of 10-cm-long segments located below the snap point were used. Samples were homogenized with liquid nitrogen in 10 mm Na-acetate buffer (pH 5.5, 10 mL buffer/g tissue). The homogenate was centrifuged for 5 min at 8,000g and filtered. Monosaccharides and β-galactosidase activity were assayed in 20 μL of the clarified homogenate. Samples (clarified homogenate) were boiled for 5 min to prevent the additional accumulation of free Gal as a result of endogenous enzymes action and analyzed by high-performance anion-exchange chromatography as described above.
β-Galactosidase activity was measured with o-nitrophenyl β-d-galactopyranoside (Sigma-Aldrich) as a substrate. A total of 0.5 mL of substrate mixture (8.3 mm o-nitrophenyl β-d-galactopyranoside, 1 mm MgCl2, and 0.1 m β-mercaptoethanol in 0.1 m Na-phosphate buffer, pH 7.0) was added to 0.5 mL of the sample (20 μL of the clarified homogenate in 480 μL of Na-acetate buffer). After the incubation at 30°C for 30 min, the reaction was terminated with 0.5 mL of 0.5 m Na2CO3. Release of o-nitrophenol was recorded at 420 nm using a Perkin-Elmer spectrophotometer. One unit of β-galactosidase corresponded to the amount of enzyme necessary for substrate hydrolysis with the formation of 1 nm o-nitrophenol per min. β-Galactosidase activity for each sample was extrapolated from a calibration curve. Sample in which 0.5 m Na2CO3 to stop the reaction was added before the substrate mixture was used as a control. Each measurement was performed with three independent biological replicates.
Spectroscopy and X-Ray Diffraction
Hypocotyls from at least 10 individual plants for each line were ground in liquid nitrogen using a mortar and pestle. The material was extracted with 80% ethanol overnight at 65°C. After extraction with acetone, the cell wall material was air-dried at room temperature and then ground to a fine powder. Prior to collection of FTIR spectra, the powder was dried at 30°C overnight and then mixed with potassium bromide. Fifteen spectra for each line were collected on a Thermo-Nicolet Nexus 470 spectrometer over the range 1800 to 800 cm−1. For each spectrum, 32 scans were coadded at a resolution of 4 cm−1 for Fourier transform processing and absorbance spectrum calculation using Omnic software (Thermo Nicolet). Spectra were baseline corrected, area normalized, and analyzed further. X-ray diffraction patterns of the same samples were obtained using an automatic powder diffractometer (Siemens-850) using Cu Kα radiation at a scan rate of 2° min−1 in terms of a 2θ angle of diffraction.
Mechanical Testing
Tensile strength of the stem was determined at 3-cm intervals. Flax stem at certain distance from the apex was fixed between two pairs of cardboard plates (2 × 2 cm). The distance between the plates was 1 cm. The stem was suspended on the hook attached to the upper plate pair. Increasing weights were added to the lower plate pair until the stem broke. The minimum amount of weight necessary to cause stem breakage was recorded. The number of replications in each line was three plants.
Sequence data from this article can be found in the GenBank/EMBL data libraries under accession numbers HQ902251 and HQ902252.
Supplemental Data
The following materials are available in the online version of this article.
Supplemental Figure S1. Structure of LuBGAL1.
Supplemental Figure S2. Mascot results from tryptic digestion and mass spectrometric analysis of a 1D gel electrophoresis band containing native β-galactosidase activity copurified with tissue-specific galactan from developing flax stems (Mikshina et al., 2009).
Supplementary Material
Acknowledgments
We thank Prof. J.P. Knox (University of Leeds, UK) for donation of LM5 antibodies and Dr. Claudine Morvan (University of Rouen, France) for assistance with sugar and uronic acid measurements.
References
- Andeme-Onzighi C, Girault R, His I, Morvan C, Driouich A. (2000) Immunocytochemical characterization of early-developing flax fiber cell walls. Protoplasma 213: 235–245 [Google Scholar]
- Andersson-Gunnerås S, Mellerowicz EJ, Love J, Segerman B, Ohmiya Y, Coutinho PM, Nilsson P, Henrissat B, Moritz T, Sundberg B. (2006) Biosynthesis of cellulose-enriched tension wood in Populus: Global analysis of transcripts and metabolites identifies biochemical and developmental regulators in secondary wall biosynthesis. Plant J 45: 144–165 [DOI] [PubMed] [Google Scholar]
- Agarwal UP, Atalla RH. (1986) In situ raman microprobe studies of plant-cell walls: macromolecular organization and compositional variability in the secondary wall of Picea mariana (Mill). Planta 169: 325–332 [DOI] [PubMed] [Google Scholar]
- Agarwal UP, Atalla RH, Bond JS. (1992) Raman spectroscopy. Lin SY, Dence CW, , Methods in Lignin Chemistry. Springer-Verlag, Berlin, pp 162–176 [Google Scholar]
- Blake AW, Marcus SE, Copeland JE, Blackburn RS, Knox JP. (2008) In situ analysis of cell wall polymers associated with phloem fiber cells in stems of hemp, Cannabis sativa L. Planta 228: 1–13 [DOI] [PubMed] [Google Scholar]
- Blumenkrantz N, Asboe-Hansen G. (1973) New method for quantitative determination of uronic acids. Anal Biochem 54: 484–489 [DOI] [PubMed] [Google Scholar]
- Bowling AJ, Vaughn KC. (2008) Immunocytochemical characterization of tension wood: Gelatinous fibers contain more than just cellulose. Am J Bot 95: 655–663 [DOI] [PubMed] [Google Scholar]
- Bowling AJ, Vaughn KC. (2009) Gelatinous fibers are widespread in coiling tendrils and twining vines. Am J Bot 96: 719–727 [DOI] [PubMed] [Google Scholar]
- Burgert I, Fratzl P. (2009) Plants control the properties and actuation of their organs through the orientation of cellulose fibrils in their cell walls. Integr Comp Biol 49: 69–79 [DOI] [PubMed] [Google Scholar]
- Clair B, Alméras T, Yamamoto H, Okuyama T, Sugiyama J. (2006) Mechanical behavior of cellulose microfibrils in tension wood, in relation with maturation stress generation. Biophys J 91: 1128–1135 [DOI] [PMC free article] [PubMed] [Google Scholar]
- Davis EA, Derouet C, Hervé du Penhoat C, Morvan C. (1990) Isolation and an N.M.R. study of pectins from flax (Linum usitatissimum L.). Carbohydr Res 197: 205–215 [Google Scholar]
- Day A, Addi M, Kim W, David H, Bert F, Mesnage P, Rolando C, Chabbert B, Neutelings G, Hawkins S. (2005) ESTs from the fibre-bearing stem tissues of flax (Linum usitatissimum L.): expression analyses of sequences related to cell wall development. Plant Biol (Stuttg) 7: 23–32 [DOI] [PubMed] [Google Scholar]
- Deyholos MK. (2006) Bast fiber of flax (Linum usitatissimum L.): biological foundations of its ancient and modern uses. Isr J Plant Sci 54: 273–280 [Google Scholar]
- Ding SY, Himmel ME. (2006) The maize primary cell wall microfibril: a new model derived from direct visualization. J Agric Food Chem 54: 597–606 [DOI] [PubMed] [Google Scholar]
- Douchiche O, Rihouey C, Schaumann A, Driouich A, Morvan C. (2007) Cadmium-induced alterations of the structural features of pectins in flax hypocotyl. Planta 225: 1301–1312 [DOI] [PubMed] [Google Scholar]
- Dubois M, Gilles KA, Hamilton JK, Rebers PA, Smith F. (1956) Colorimetric method for determination of sugars and related substances. Anal Chem 28: 350–356 [Google Scholar]
- Esau K. (1943) Vascular differentiation in the vegetative shoot of Linum III: the origin of the bast fibers. Am J Bot 30: 579–586 [Google Scholar]
- Evans PA. (1991) Differentiating “hard” from “soft” woods using Fourier transform infrared and Fourier transform spectroscopy. Spectrochim Acta A 47: 1441–1447 [Google Scholar]
- Gantulga D, Ahn YO, Zhou C, Battogtokh D, Bevan DR, Winkel BSJ, Esen A. (2009) Comparative characterization of the Arabidopsis subfamily a1 β-galactosidases. Phytochemistry 70: 1999–2009 [DOI] [PubMed] [Google Scholar]
- Gierlinger N, Sapei L, Paris O. (2008) Insights into the chemical composition of Equisetum hyemale by high resolution Raman imaging. Planta 227: 969–980 [DOI] [PMC free article] [PubMed] [Google Scholar]
- Gilbert C, Kokot S, Meyer U. (1993) Application of DRIFT spectroscopy and chemometrics for the comparison of cotton fabrics. Appl Spectrosc 47: 741–748 [Google Scholar]
- Gorshkova TA, Chemikosova SB, Salnikov VV, Pavlencheva NV, Gurjanov OP, Stolle-Smits T, van Dam JEG. (2004) Occurrence of cell-specific galactan is coinciding with bast fiber developmental transition in flax. Ind Crops Prod 19: 217–224 [Google Scholar]
- Gorshkova TA, Gurjanov OP, Mikshina PV, Ibragimova NN, Mokshina NE, Salnikov VV, Ageeva MV, Amenitskii SI, Chernova TE, Chemikosova SB. (2010) Specific type of secondary cell wall formed by plant fibers. Russ J Plant Physiol 57: 346–360 [Google Scholar]
- Gorshkova T, Morvan C. (2006) Secondary cell-wall assembly in flax phloem fibres: role of galactans. Planta 223: 149–158 [DOI] [PubMed] [Google Scholar]
- Gorshkova TA, Sal'nikov VV, Chemikosova SB, Ageeva MV, Pavlencheva NV. (2003) The snap point: a transition point in Linum usitatissimum bast fiber development. Ind Crops Prod 18: 213–221 [Google Scholar]
- Goswami L, Dunlop JWC, Jungnikl K, Eder M, Gierlinger N, Coutand C, Jeronimidis G, Fratzl P, Burgert I. (2008) Stress generation in the tension wood of poplar is based on the lateral swelling power of the G-layer. Plant J 56: 531–538 [DOI] [PubMed] [Google Scholar]
- Gurjanov OP, Ibragimova NN, Gnezdilov OI, Gorshkova TA. (2008) Polysaccharides, tightly bound to cellulose in the cell wall of flax bast fiber: isolation and identification. Carbohydr Res 72: 719–729 [Google Scholar]
- Ha MA, Apperley DC, Evans BW, Huxham IM, Jardine WG, Viëtor RJ, Reis D, Vian B, Jarvis MC. (1998) Fine structure in cellulose microfibrils: NMR evidence from onion and quince. Plant J 16: 183–190 [DOI] [PubMed] [Google Scholar]
- Hainfeld JF, Powell RD. (2000) New frontiers in gold labeling. J Histochem Cytochem 48: 471–480 [DOI] [PubMed] [Google Scholar]
- Harris D, Stork J, Debolt S. (2009) Genetic modification in cellulose-synthase reduces crystallinity and improves biochemical conversion to fermentable sugar. Globe Change Biol Bioenergy 1: 51–61 [Google Scholar]
- Helliwell C, Waterhouse P. (2003) Constructs and methods for high-throughput gene silencing in plants. Methods 30: 289–295 [DOI] [PubMed] [Google Scholar]
- Himmel ME, Ding SY, Johnson DK, Adney WS, Nimlos MR, Brady JW, Foust TD. (2007) Biomass recalcitrance: engineering plants and enzymes for biofuels production. Science 315: 804–807 [DOI] [PubMed] [Google Scholar]
- Himmelsbach DS, Khalili S, Akin DE. (1998) FT-IR microspectroscopic imaging of flax (Linum usitatissimum L.) stems. Cell Mol Biol 44: 99–108 [PubMed] [Google Scholar]
- His I, Andème-Onzighi C, Morvan C, Driouich A. (2001) Microscopic studies on mature flax fibers embedded in LR white: immunogold localization of cell wall matrix polysaccharides. J Histochem Cytochem 49: 1525–1536 [DOI] [PubMed] [Google Scholar]
- Hotte NSC, Deyholos MK. (2008) A flax fibre proteome: identification of proteins enriched in bast fibres. BMC Plant Biol 8: 52. [DOI] [PMC free article] [PubMed] [Google Scholar]
- Jones L, Seymour GB, Knox JP. (1997) Localization of pectic galactan in tomato cell wall using a monoclonal antibody specific to (1→4)-β-D-galactan. Plant Physiol 113: 1405–1412 [DOI] [PMC free article] [PubMed] [Google Scholar]
- Joseleau JP, Chambat J, Chumpitazi-Hermosa B. (1980) Solubilization of cellulose and other plant structural polysaccharides in 4-methylmorpholine-N-oxide: an improved method for the study of cell wall constituents. Carbohydr Res 90: 339–344 [Google Scholar]
- Kaku T, Serada S, Baba K, Tanaka F, Hayashi T. (2009) Proteomic analysis of the G-layer in poplar tension wood. J Wood Sci 55: 250–257 [Google Scholar]
- Kemp W. (1991) Organic Spectroscopy. MacMillan Education, London, pp 42–51 [Google Scholar]
- Lafarguette F, Leple J-C, Dejardin A, Laurans F, Costa G, Lesage-Descauses M-C, Pilate G. (2004) Poplar genes encoding fasciclin-like arabinogalactan proteins are highly expressed in tension wood. New Phytol 164: 107–121 [DOI] [PubMed] [Google Scholar]
- McCartney L, Steele-King CG, Jordan E, Knox JP. (2003) Cell wall pectic (1—>4)-β-d-galactan marks the acceleration of cell elongation in the Arabidopsis seedling root meristem. Plant J 33: 447–454 [DOI] [PubMed] [Google Scholar]
- Mellerowicz EJ, Immerzeel P, Hayashi T. (2008) Xyloglucan: the molecular muscle of trees. Ann Bot (Lond) 102: 659–665 [DOI] [PMC free article] [PubMed] [Google Scholar]
- Mikshina PV, Chemikosova SB, Mokshina NE, Ibragimova NN, Gorshkova TA. (2009) Free galactose and galactosidase activity in the course of flax fiber development. Russ J Plant Physiol 56: 58–67 [Google Scholar]
- Mlynarova L, Bauer M, Nap JP, Pretova A. (1994) High-efficiency Agrobacterium-mediated gene-transfer to flax. Plant Cell Rep 13: 282–285 [DOI] [PubMed] [Google Scholar]
- Mohanty AK, Misra M, Hinrichsen G. (2000) Biofibers, biodegradable polymers and biocomposites: an overview. Macromol Mater Eng 276: 1–24 [Google Scholar]
- Morvan C, Hafez AMA, Jauneau A, Thoiron B, Demarty M. (1991) Incorporation of D-[U-C-14]glucose in the cell-wall of Linum plantlets during the 1st steps of growth. Plant Cell Physiol 32: 609–621 [Google Scholar]
- Nishikubo N, Awano T, Banasiak A, Bourquin V, Ibatullin F, Funada R, Brumer H, Teeri TT, Hayashi T, Sundberg B, et al. (2007) Xyloglucan endo-transglycosylase (XET) functions in gelatinous layers of tension wood fibers in poplar: a glimpse into the mechanism of the balancing act of trees. Plant Cell Physiol 48: 843–855 [DOI] [PubMed] [Google Scholar]
- Park S, Baker JO, Himmel ME, Parilla PA, Johnson DK. (2010) Cellulose crystallinity index: measurement techniques and their impact on interpreting cellulase performance. Biotechnol Biofuels 3: 10. [DOI] [PMC free article] [PubMed] [Google Scholar]
- Reynolds ES. (1963) The use of lead citrate at high pH as an electron-opaque stain in electron microscopy. J Cell Biol 17: 208–212 [DOI] [PMC free article] [PubMed] [Google Scholar]
- Roach MJ, Deyholos MK. (2007) Microarray analysis of flax (Linum usitatissimum L.) stems identifies transcripts enriched in fiber-bearing phloem tissues. Mol Genet Genomics 278: 149–165 [DOI] [PubMed] [Google Scholar]
- Roach MJ, Deyholos MK. (2008) Microarray analysis of developing flax hypocotyls identifies novel transcripts correlated with specific stages of phloem fiber differentiation. Ann Bot (Lond) 102: 317–330 [DOI] [PMC free article] [PubMed] [Google Scholar]
- Salnikov VV, Ageeva MV, Gorshkova TA. (2008) Homofusion of Golgi secretory vesicles in flax phloem fibers during formation of the gelatinous secondary cell wall. Protoplasma 233: 269–273 [DOI] [PubMed] [Google Scholar]
- Sato S, Kato T, Kakegawa K, Ishii T, Liu YG, Awano T, Takabe K, Nishiyama Y, Kuga S, Sato S, et al. (2001) Role of the putative membrane-bound endo-1,4-β-glucanase KORRIGAN in cell elongation and cellulose synthesis in Arabidopsis thaliana. Plant Cell Physiol 42: 251–263 [DOI] [PubMed] [Google Scholar]
- Schreiber N, Gierlinger N, Pütz N, Fratzl P, Neinhuis C, Burgert I. (2010) G-fibers in storage roots of Trifolium pratense (Fabaceae): tensile stress generators for contraction. Plant J 61: 854–861 [DOI] [PubMed] [Google Scholar]
- Stewart D, Wilson HM, Hendra PJ, Morrison IM. (1995) Fourier-transform infrared and raman-spectroscopic study of biochemical and chemical treatments of oak wood (Quercus rubra) and barley (Hordeum vulgare) straw. J Agric Food Chem 43: 2219–2225 [Google Scholar]
- Talmage KW, Keegstra K, Bauer WO, Albersheim P. (1973) The structure of plant cell walls. I. The macromolecular components of the walls of suspension-cultured sycamore cells with a detailed analysis of the pectic polysaccharides. Plant Physiol 51: 158–173 [DOI] [PMC free article] [PubMed] [Google Scholar]
- Thimm JC, Burritt DJ, Ducker WA, Melton LD. (2000) Celery (Apium graveolens L.) parenchyma cell walls examined by atomic force microscopy: effect of dehydration on cellulose microfibrils. Planta 212: 25–32 [DOI] [PubMed] [Google Scholar]
- Thimm JC, Burritt DJ, Ducker WA, Melton LD. (2009) Pectins influence microfibril aggregation in celery cell walls: an atomic force microscopy study. J Struct Biol 168: 337–344 [DOI] [PubMed] [Google Scholar]
- Wrobel-Kwiatkowska M, Lorenc-Kukula K, Starzycki M, Oszmianski J, Kepczynska E, Szopa J. (2004) Expression of β-1,3-glucanase in flax causes increased resistance to fungi. Physiol Mol Plant Pathol 65: 245–256 [Google Scholar]
Associated Data
This section collects any data citations, data availability statements, or supplementary materials included in this article.