Abstract
This paper demonstrates and systematically characterizes the enrichment of biomolecular compounds using aptamer-functionalized surfaces within a microfluidic device. The device consists of a microchamber packed with aptamer-functionalized microbeads and integrated with a microheater and temperature sensor to enable thermally controlled binding and release of biomolecules by the aptamer. We first present an equilibrium binding-based analytical model to understand the enrichment process. The characteristics of the aptamer-analyte binding and enrichment are then experimentally studied, using adenosine monophosphate (AMP) and a specific RNA aptamer as a model system. The temporal process of AMP binding to the aptamer is found to be primarily determined by the aptamer-AMP binding kinetics. The temporal process of aptamer-AMP dissociation at varying temperatures is also obtained and observed to occur relatively rapidly (< 2 s). The specificity of the enrichment is next confirmed by performing selective enrichment of AMP from a sample containing biomolecular impurities. Finally, we investigate the enrichment of AMP by either discrete or continuous introduction of a dilute sample into the microchamber, demonstrating enrichment factors ranging from 566 to 686×, which agree with predictions of the analytical model.
Keywords: Aptamer, enrichment, microfluidic, solid phase capture, isocratic elution
1. Introduction
Microfluidic devices have been making a significant impact on bioanalytical systems because of benefits such as reduced material consumption, improved reaction efficiency, and the potential for enhanced sensitivity and multiplexed analysis. However, microfluidics-based analytical techniques have not come free of obstacles. In particular, the small volumes generally required for chip-based analyses reduce the quantity of molecules present in the sample, and thus necessitate sensitive detection techniques [1]. This constraint can be exacerbated further by the practical demand for processing of rare or diluted analytes within complex biological fluids (for instance, blood, serum, or urine) that are clouded with impurities [2]. To address this problem, it is often necessary to incorporate sample preparation steps [3], which involve the processing of a sample to reduce its complexity within microfluidic analytical systems.
Sample enrichment is one of the most common sample preparation strategies in bioanalytical assays due to the need to amplify low-concentration analytes while simultaneously separating them from impurities in raw samples [4]. Enrichment of a sample prior to analysis can alleviate the sensitivity demands placed on the detector by partitioning available analyte molecules into a smaller volume for enhanced detection. Microfluidic devices have been developed to realize a number of sample enrichment methods, including electrokinetic sample stacking [5] in which dilute analytes of interest are concentrated in a localized equilibrium zone by electrokinetic transport, size exclusion in which analytes are partitioned by molecular weight [6], and in particular, sample capture and enrichment by solid-phase extraction (SPE) [7].
SPE involves capture of a target analyte via interaction with a solid phase whose surfaces are coated with functional molecules. Specifically, the target analyte becomes immobilized onto the functional surface through this interaction, whereas impurities and non-target compounds remain in the liquid phase and can be removed. Repeating this process enables the enrichment of the analyte on the solid surfaces. Next, the analyte is eluted, typically by adjusting the polarity, ionic strength, or pH of the solvent, for subsequent detection. SPE on microfluidic platforms has been readily demonstrated. For instance, an early device employed a glass microchip packed with nonpolar octadecylsilane coated silica microbeads to demonstrate the enrichment of hydrophobic fluorophores (BODIPY and fluorescein), which were eluted with acetonitrile, an organic solvent [8]. Likewise, a reverse-phased C18 coating on the channel walls of a glass chip was used to concentrate coumarin dye and subsequently eluted with acetonitrile [9]. Additionally, reversed-phase octadecy-derived beads packed within a glass microchip were employed to capture fluorescent molecules on a nonpolar surface, whose polarity was subsequently reversed with a Tris-HCl 2-proponal buffer to elute the captured analyte [10]. Moreover, a poly(vinylpyrrolidone) chip packed with C18 microbeads was used for the reverse-phase enrichment of ephedrine, which was then eluted using an acetonitrile-borate buffer solution [11].
While demonstrating the potential of microfluidic SPE for sample enrichment, these devices commonly suffer from two major limitations. First, relying on nonspecific interactions between the solid phase and analytes, the enrichment process is indiscriminate. That is, in addition to the target analyte, impurities in the sample that exhibit similar interactions with the solid-phase are also captured. This lack of specificity can often severely hinder the sensitive and unambiguous detection of the analytes. Second, analyte elution in these devices is accomplished by using gradients of pH, salt concentration or solvent polarity. The required use of additional reagents and solvents increases the complexity of device design and operation, and may also compromise the integrity of the analyte and present other compatibility issues.
The lack of specificity can be addressed by SPE methods that incorporate affinity receptors. Such receptors specifically bind to analytes, allowing selective enrichment and purification [12, 13]. For example, an electrokinetically driven glass microchip incorporating a polymer monolith functionalized with the lectin pisum sativum agglutinin was used for the separation and enrichment of glycoproteins [14]. Antibody-conjugated magnetic beads in a polymer microfluidic device were used to purify and enrich Dengue virus [15]. Unfortunately, protein receptors such as lectins and antibodies generally suffer from poor stability, are expensive and time-consuming to develop, and are susceptible to undesirable biofouling [12], or accumulation of microorganisms via protein-protein interactions. Aptamers, which are oligonucleotides that bind to analyte molecules by specific affinity interaction, in general do not suffer from these problems and offer an attractive alternative as affinity receptors [16]. In an early demonstration of this concept, aptamers were functionalized on microbeads via photo-cleavable immobilization chemistry, and subsequently packed in a silicon-glass microchip for the purification and detection of Hepatitis-C virus (HCV) [17]. Elution of HCV required photolytic decoupling of the aptamer-HCV complex from the microbeads. More recently, aptamers were employed to enhance specific binding on a poly(methylmethacrylate) microchip in conjunction with capillary electrophoresis for the detection of thrombin [18].
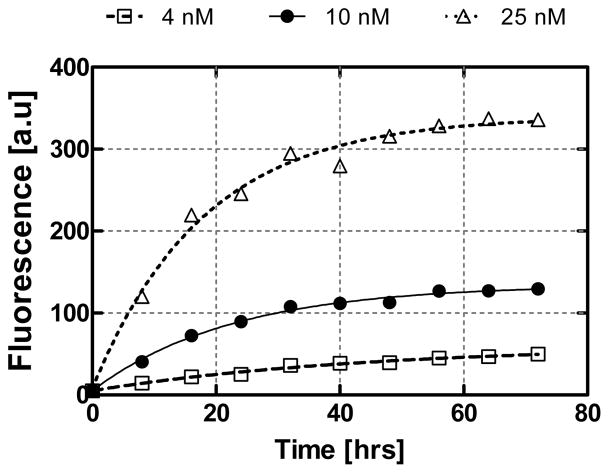
We recently reported that aptamer-functionalized microfluidic surfaces are capable of capturing analytes, which can be eluted by thermally disrupting the affinity binding with a modest temperature increase [19]. Several important issues were not considered in that preliminary investigation, and will be addressed in this work. These include the specificity of analyte capture on microfluidic aptamer surfaces, the characteristics of formation and thermally induced disruption of aptamer-analyte binding, and most importantly, the possibility of drastic enrichment of analytes from dilute samples. Hence, this paper presents the demonstration and systematic characterization of aptamer-based microfluidic purification and enrichment of biomolecular analytes, using a microchip that consists of a microchamber packed with aptamer-functionalized microbeads for analyte purification and enrichment, and on-chip temperature control elements for thermally induced analyte elution. We investigate the affinity binding of a model system consisting of adenosine monophosphate (AMP) and an oligonucleotide aptamer derived from RNA. First, the time-resolved behavior of the aptamer and AMP binding system is characterized. This is followed by testing the aptamer’s selectivity to AMP by microfluidic purification from a model impurity. Subsequently, microfluidic enrichment of AMP is characterized by successive discrete injections as well as continuous introduction of a dilute AMP sample. These experimental data are explained with an analytical model, and demonstrate the potential of the aptamer-based microfluidic enrichment approach for practical applications.
2. Principle and Design
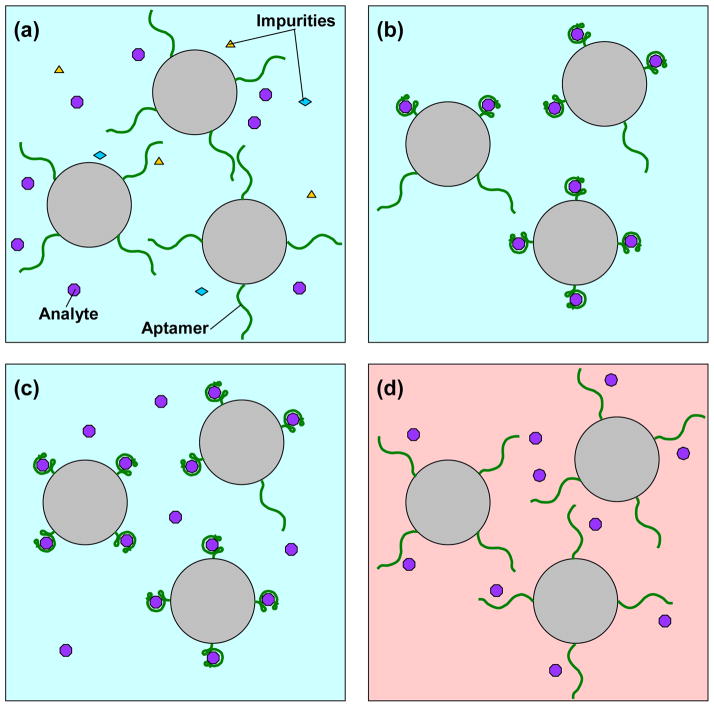
The principle of selective purification and enrichment of biomolecules on aptamer-functionalized surfaces is illustrated in Figure 1. Initially, a sample that contains molecules of a target analyte, as well as non-target impurities, is introduced to molecules of an analyte-specific aptamer immobilized on a solid phase (Figure 1a). At a suitable (e.g., room) temperature, the aptamer specifically and reversibly captures the analyte from the liquid-phase while impurities are flushed from the system (Figure 1b). This capture step is repeated to enrich the analyte on the aptamer-functionalized surface either discretely (by consecutive infusion of batches of dilute sample) or continuously (by continuous infusion of a dilute sample) (Figure 1c). Unique to aptamers, the binding can then be disrupted by altering the temperature of the surface such that the enriched analyte is released into a pure liquid phase and isocratically eluted, or elution using only a single and homogeneous liquid phase, for subsequent analysis (Figure 1d). Returning the temperature to the initial state allows the aptamer to revert to its initial functional structure, permitting reuse.
Figure 1.
Principle of aptamer-based microfluidic enrichment. (a) A mixture of target and impurities introduced to a specific aptamer on a surface (for example, microbeads) at a certain temperature. (b) Rinsing out impurities and purifying the analyte (c) Enrichment of analytes via addition of subsequent dilute sample, or continuous infusion after a short time Δt. (d) Release of the target molecule at a suitably different temperature.
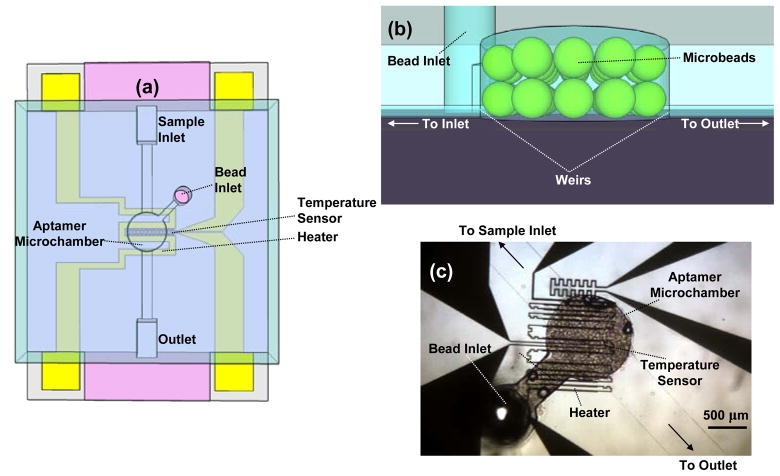
We demonstrate aptamer-based specific microfluidic analyte enrichment with a microchip adapted from an earlier design (Figure 2) [19]. The chip consists of an aptamer microchamber packed with microbeads whose surfaces are functionalized with the aptamer. Compared with the earlier design [19], the microchamber volume is reduced to decrease detection signal nonuniformity (significant with larger sized microchambers), and to ensure that the sample is exposed to all available aptamer binding sites. The microbeads are introduced from a dedicated bead inlet and retained in the chamber using a dam-like structure termed a weir (Figure 2b), while samples and buffer are introduced via the sample inlet and outlet. Two meandering resistive temperature sensors, and a microheater, are integrated on-chip for closed-loop temperature control, enabling thermally induced disruption of affinity binding for analyte release. We demonstrate specific microfluidic purification and enrichment using AMP as a model analyte, which is a nucleotide involved in metabolic processes and recognized by an RNA aptamer (5′-GGG UUG GGA AGA AAC UGU GGC ACU UCG GUG CCA GCA ACC C-3′). The characterization of the enrichment process utilizes thiazole orange, an asymmetric cyanine that is attached to AMP (TO-AMP) to allow fluorescent detection. As thiazole orange naturally fluoresces in the 510–580 nm band (with peak emission at 530 nm) when intercalating with nucleic acid and irradiated with 480 nm light (peak absorption), TO-AMP can be detected by optical fluorescence when it binds to the aptamer.
Figure 2.
(a) Schematic of the microchip. (b) Magnified view of the aptamer microchamber highlighting the weir structure. Microbeads are trapped provided the height of the weir is smaller than 0.5× the nominal bead diameter. (c) Micrograph of a packaged device.
3. Analyte Enrichment Model
To quantitatively interpret the analyte enrichment process, consider a simple model of analyte-receptor interaction based on the following assumptions. First, the interaction is in equilibrium and is reversible, as is typically true for all noncovalent binding conjugates regardless of affinity. Second, the analyte-receptor coupling is monovalent, i.e., one corresponding binding epitope exists on either molecule. This is generally valid for aptamer systems, since specific correlating sections of both the aptamer sequence and analyte molecule become highly affine to one another during aptamer synthesis. Lastly, receptor and analyte molecules remain viable throughout interaction, while also participating in no secondary reactions.
In a microchamber packed with aptamer-functionalized microbeads, the total effective aptamer concentration is approximately that of the surface-bound linker molecules used for aptamer immobilization:
| (1) |
where ρ is the mass of linker molecules per unit volume of the bead-packed chamber (typically obtainable from microbead vendors), and M is the linker’s molecular weight. Consider a discrete enrichment scheme, in which consecutive infusions of a dilute sample (analyte concentration: cS) are introduced into the chamber. Under the assumptions above, the binding equilibrium with analyte depletion [24] taken into account is represented by
| (2) |
where c is the effective surface-bound analyte-receptor complex concentration, and Kd is the system’s equilibrium dissociation constant [20]. This equation can be solved for c
| (3) |
and gives the effective concentration of the captured analyte from a single extraction from sample of concentration cS. During enrichment, the analyte-receptor complex concentration (c) changes incrementally at the end of the nth sample introduction and incubation step (n ≥ 0), so at the (n+1)th step, the effective captured analyte concentration increases to cn+1 = cn + Δcn. Substituting into Eq. (2) and solving for cn+1 yields
| (4) |
and provides a recursive relationship to determine the captured analyte concentration resulting from each sample introduction step.
During experiments (below), the captured analyte concentration is represented by the observed fluorescence intensity, Xn. After acquiring the fluorescence response for enrichment experiments, Eq. (4) can be fitted to determine binding constants.
As can be shown, Eq. (4) implies that Δcn is always positive and decreases monotonically with n. This is consistent with the intuition that the analyte capture ability of the aptamer-functionalized surface decreases as the number of captured analyte molecules increases. In the limiting case, when the analyte enrichment process has progressed for a sufficiently long time, Δcn approaches zero. Then, Eq. (4) can be employed to determine the enrichment factor (Qn), which is the ratio of the captured analyte concentration to the introduced sample concentration after (n) sample infusions. It follows then that the asymptotic enrichment factor is defined as
| (5) |
This provides the maximum achievable concentration of captured analyte molecules. It can be seen that the asymptotic enrichment factor (Q∞) increases proportionally with the total effective aptamer concentration, which is a measure of available binding sites on the solid phase. In addition, Q∞ increases with decreasing sample concentration (cS) and dissociation constant (Kd). In particular, when cS is sufficiently small, Q∞ varies inversely with Kd. Intuitively, this indicates that higher tightness of affinity binding allows for a larger enrichment factor.
4. Experimental Methods
4.1 Materials and Instrumentation
TO-AMP was synthesized in-house, while its affinity RNA aptamer, with a biotinylated 5′-end, was acquired through Integrated DNA Technologies. An aqueous buffer solution (pH 7.4) was prepared with a mixture of purified water (sterile RNase/Protease-free water, Fisher), Tris-HCl (20 mM), NaCl (140 mM), KCl (5 mM), and MgCl2 (5 mM) and subsequently used in all experiments. Porous bis-acrylamide beads copolymerized with azlactone (50–80 μm in diameter) and coated with UltraLink streptavidin were acquired from Pierce and used to immobilize the RNA aptamer via a biotin-streptavidin link. Microfabrication materials, including SU-8 2025 and 2100, Sylgard 184 PDMS, Dow Corning 733 silicone sealant, and microscope grade glass slides (25 mm × 75 mm), were purchased from MicroChem, Dow Corning, and Fisher, respectively.
4.2 Microchip Fabrication and Experimental Setup
The enrichment microchip was fabricated by soft lithography techniques [21, 22]. Briefly, a sheet of polydimethylsiloxane (PDMS) bearing the microfluidic features, including a microchamber 1.5 mm in diameter and 150 μm in height (i.e., with a volume of 0.26 μl), was obtained by micromolding from a master made of SU-8 photoresist. The microheater and temperature sensor were patterned from a 100 nm gold thin film (using a 5 nm chrome adhesion layer) on glass. Subsequently, the PDMS sheet was bonded to the glass chip after treating the bonding interfaces by oxygen plasma.
During experiments, the device was mounted to a fluorescence microscope (Nikon Diaphot300) coupled with a CCD camera (Pixelink PL-B742U). The microheater and temperature sensor in the device were used in conjunction with off-chip programming to achieve closed-loop temperature control. A DC power supply (Agilent E3631A), digital multimeter (Agilent 34410A), and a proportional-integral-derivative (PID) control algorithm within a LabVIEW program were used for temperature control, while a New Era NE-1000 syringe pump was used for sample and buffer introduction.
Throughout all experiments except those used for control purposes, a single microfluidic device was used to ensure consistency of experimental data. The device’s microheater was measured to have a resistance of 650 Ω, and its micro temperature sensor had a measured resistance of 240 Ω with a temperature coefficient of resistance of 1.68 × 10⁻³·°C−1. In order to alleviate the possible degradation of this device, two additional, nominally identical device chips were used in the control experiments. The effects of any minor variations of the control devices from the nominal design were considered insignificant, as the control experimental data (Sections 5.1–5.4) were not used to compare different equilibrium binding and enrichment results.
4.3 Testing Procedures
A nominal flowrate of 10 μl·min−1 was used during washing and discrete sample introduction steps (unless noted otherwise). This choice was to produce a pumping pressure of approximately 3.1 kPa, which conformed to the pressure limits of the syringe pump and structural PDMS layer. In the initial flush and subsequent rinses, the microchip was infused with pure buffer solution for 5 min at the maximum flowrate. Sample solutions of varying concentrations of TO-AMP were prepared based on its molar mass and buffer solution volume. Microbeads were packed manually into the microchamber through the auxiliary channel from the bead inlet, which was subsequently sealed permanently using a silicone sealant imbued PDMS plug. This bead packing was used for the lifetime of the chip. The enrichment chamber and channels were then washed through the sample inlet, followed by injection of 2 μl, total, of an aptamer solution (722 μM) at the nominal flowrate. Incubation followed for at least 1 hr in the microchamber, allowing sufficient time for the aptamer to attach and properly align to microbead surfaces (incubation time for TO-AMP samples was determined based on the capture time characterization data (Section 5.2)). Based on the calculated theoretical concentration of streptavidin (approximately 16.37 mM) on the microbeads, the extremely high affinity of the biotin-avidin binding (Kd ~ 10−15 M) [23] implies that nearly all introduced biotinylated aptamer molecules become immobilized onto the streptavidin-coated surface. Next, the chamber was washed again and a baseline fluorescence signal was taken at the center of the chamber producing a resulting CCD image. Fluorescence images were processed to obtain an 8-bit RGB intensity mean using ImageJ analysis software. This intensity was further averaged in a 1.25 mm2 region of highest fluorescence uniformity to represent the effective captured analyte signal (Χ). The preceding protocol was additionally used following TO-AMP sample extraction. Subsequently, release of analytes following extraction was achieved using temperature-induced reversal of the aptamer-analyte interaction [19], which is explored in further detail below (Section 5.3). Hence, isocratic elution, regeneration and reuse of the device for further experiments were allowed.
5. Results and Discussion
5.1 Experimental Controls
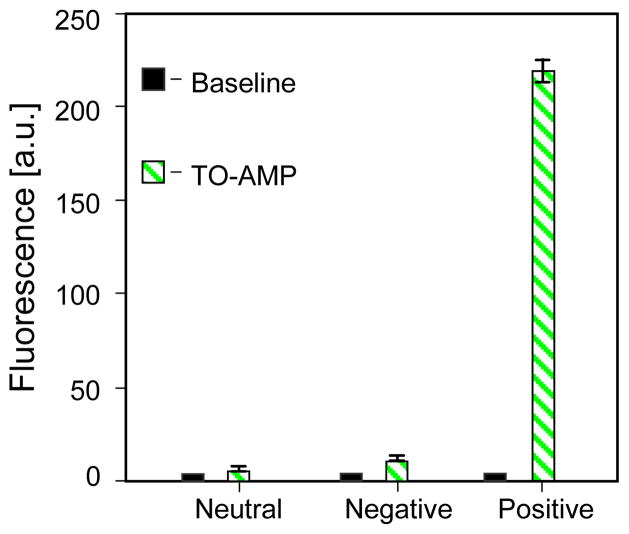
Several control experiments were first performed, in which TO-AMP (11.7 μM) was injected into the microchamber under three conditions. First, microbeads with no aptamer attached were packed into the chamber (referred to as the aptamer-neutral control). The second condition involved beads functionalized with a nonspecific aptamer (derived for guanosine triphosphate) that does not bind to AMP (aptamer-negative). Under the final condition, the chamber was packed with beads functionalized with the AMP-specific aptamer (aptamer-positive). Results from these control experiments are presented in Figure 3. The error bars in the figure (as well as in the other figures below) represented the standard deviation calculated from three measurements. These errors reflected contributions from several sources including changes in microbead packing between experiments, and fluorescence lamp fluctuations during measurements. As shown in the figure, the fluorescence intensity from the aptamer-positive experiment was dominant, while there was no appreciable signal above the baseline for the aptamer-neutral case and only a slight increase in fluorescence during the aptamer-negative control, which could be attributed to nonspecific adsorption to the microbeads by TO-AMP. It can thus be concluded that TO indeed fluoresces solely in the presence of nucleic acid, and that a lack of fluorescence in our measurements signified negligible affinity binding between TO-AMP and the aptamer.
Figure 3.
Control experiments. A 11.7 μM sample of TO-AMP was injected into the microchamber containing three SPE media: 1) non-functional beads (“aptamer neutral”); 2) beads coated with nonspecific aptamer (GTP-aptamer, “aptamer negative”); 3) AMP-specific aptamer coated beads (“aptamer positive”). Insets show fluorescence micrographs of the chamber corresponding to each control condition. Experiments were performed in triplicate to determine a standard error, which procedurally was similar for all subsequent figures containing error bars.
5.2 Determining Binding Capture Time
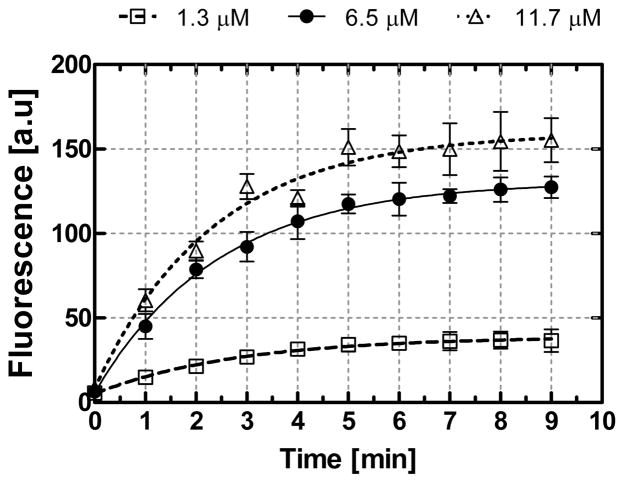
The time course of affinity capture of TO-AMP by the aptamer was obtained to understand the kinetic behavior of the system for finite volume samples. Fluorescence exposure occurred at minute intervals following an injection of TO-AMP (1.3, 6.5, and 11.7 μM). The fluorescence intensity was obtained and then plotted as a function of time (Figure 4). In all experiments, the fluorescence saturated at sufficiently large times, where the apparent analyte capture time (τcap), or the time constant for the observed time course of analyte capture, was obtained by fitting the data to a first order exponential model. Hence, τcap for the experiments with 1.3, 6.5, and 11.7 μM samples were approximately 2.89, 2.45, and 2.29 min, respectively. In general, τcap is determined by consideration of two time scales: the diffusion time for the analyte to reach the surface-immobilized aptamer by diffusion, and the kinetic binding time for the analyte to bind to the aptamer. For the porous microbeads, the diffusion time scale can be estimated by where d0 is the average bead diameter and D the analyte diffusivity. Using d0 ≈ 80 μm for our beads and D ≈ 4.44 × 10⁻⁶ cm2·s−1 for AMP [24] yields the diffusion time to be nearly 14 seconds. This was negligible compared with the observed values of τcap. It can thus be concluded that τcap was primarily determined by kinetic binding time, which agrees well with previous results reported for the same aptamer-analyte system [25].
Figure 4.
Time course of resolved fluorescence measurements for the extraction of TO-AMP by its aptamer. Lines represent a nonlinear least squares fit to an exponential association model.
5.3 Time-Resolved Measurement of Thermally Induced Analyte Release
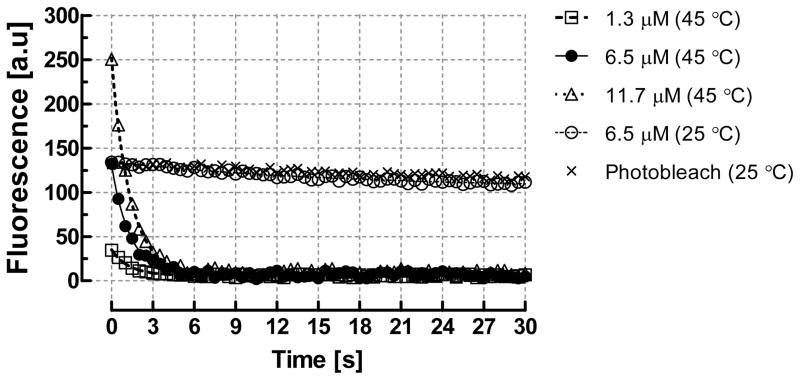
The aptamer-analyte complex is typically temperature-dependent, and can be disrupted at a modestly elevated temperature to enable thermally activated release and isocratic elution of the enriched analyte from the aptamer-functionalized surface [19]. Here, we characterize heat-induced dissociation of analyte-aptamer binding. Solutions of TO-AMP (1.3, 6.5, and 11.7 μM) were first introduced into the microchamber to allow analyte capture and fluorescence intensity to increase to equilibrium. The chip temperature was then rapidly increased (~0.85 s) to 45 °C and held for 30 s with fluorescence measurements taken every 0.5 s (Figure 5). Within the first second following the temperature increase, the fluorescence intensity decreased abruptly, and remained within 2–3% the baseline reading for all tested samples. As photobleaching was estimated to account for less than 10% of the fluorescence intensity decrease for tested samples, while temperature-dependent behavior of the TO fluorophore is minimal when TO is intercalated with nucleic acids [26, 27], we concluded that the measurements reflected thermally induced dissociation of TO-AMP from the aptamer. An exponential fit to the data revealed dissociation time constants (τdiss) of 1.28, 1.32, and 1.32 s for the 1.3, 6.5 and 11.7 μM samples, respectfully. Since the diffusion time scale was much slower (14 s), while the heating time constant was only about 0.85 s, the rapid transient of dissociation with moderate heating can be primarily attributed to disruption of binding. We subsequently performed dissociation without heating by continuously flowing buffer into the microchamber after a 6.5 μM TO-AMP sample introduction, while monitoring fluorescence intensity. At room temperature, the dissociation transient (τdiss = 16.5 s) was significantly larger than with moderate heating, obtaining a fluorescence value slightly below that for photobleaching after 30 s. Hence, temperature indeed significantly influences the dissociation rate, suggesting that thermal energy likely intensifies unfolding of the specific binding pocket used by the aptamer for AMP recognition. This effect is reversible, and has been exploited in our present and prior work [19] to induce isocratic release of analytes from aptamer receptors followed by device regeneration and reuse.
Figure 5.
Temperature induced dissociation (i.e., isocratic elution) of TO-AMP from the aptamer using the integrated heating elements on the microchip. The release profiles suggest the microchip is capable of rapid (τdiss = 1.31 s, average) and thorough release and elution of TO-AMP as compared to room temperature dissociation (τdiss = 16.5 s when considering the 6.5 μM case).
5.4 Specificity of Analyte Purification
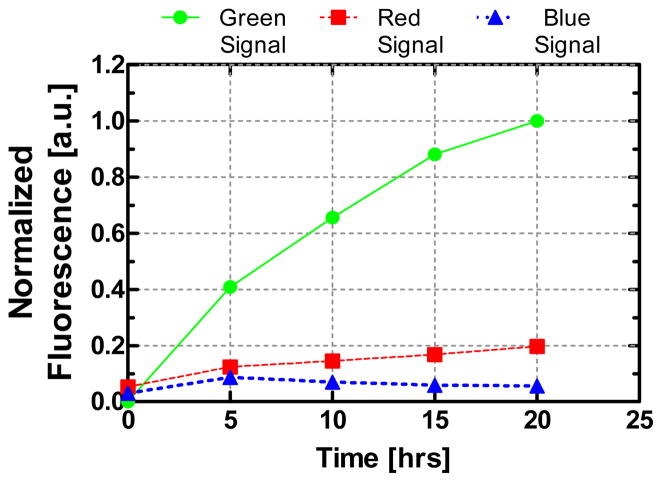
To elucidate the selectivity of the aptamer to TO-AMP, we purified 10 nM TO-AMP from a sample containing 1 μM vasopressin (AVP), a related metabolic hormone used here as a model impurity [28]. Vasopressin was labeled with Tamra dye (TMR-AVP), which has excitation and emission wavelength bands at 550 nm and 620 nm [29], respectively, to distinguish from TO-AMP. The solution was continuously introduced into the device while recording RGB signals, which were normalized to the green value, or the TO-AMP signal (Figure 6). Sufficient experimental time (20 hrs) was used to assure intrinsic molecular transport differences between TO-AMP and TMR-AVP would not affect their final signals. Negligible signal was observed at blue wavelengths, indicating a narrow emission band for both TO-AMP and TMR-AVP, as expected. Significant signal was observed only from TO-AMP, which indicated highly selective interaction of TO-AMP to the aptamer. In contrast, the red fluorescence intensity, corresponding to nonspecifically bound TMR-AVP, was significantly less, thereby indicating successful purification of TO-AMP. Using final signal levels, the ratio of specific to nonspecific binding was approximately 7:1, which was satisfactory considering no surface blocking was utilized to prevent nonspecific adsorption. This suggests that any nonspecific binding of AVP was likely via adsorption to microbead surfaces, rather than by interaction with the aptamer. Moreover, due to the wide emission spectra of TO [30], low intensity light from TO near 600 nm wavelengths could have contributed slightly to the TMR signal. Therefore, the actual specificity of TO-AMP enrichment by the aptamer might be potentially higher.
Figure 6.
Enrichment by continuous infusion of an impure and dilute sample of TO-AMP (10 nM). A solution of TO-AMP is spiked with a model impurity (TMR-AVP) at a concentration ratio of 100:1, which is a common neurophysical hormone present alongside AMP physiologically. The red, green and blue channel for each fluorescence data point is extracted and plotted to measure the efficiency of TO-AMP purification by the aptamer.
5.5 Equilibrium Binding Measurements
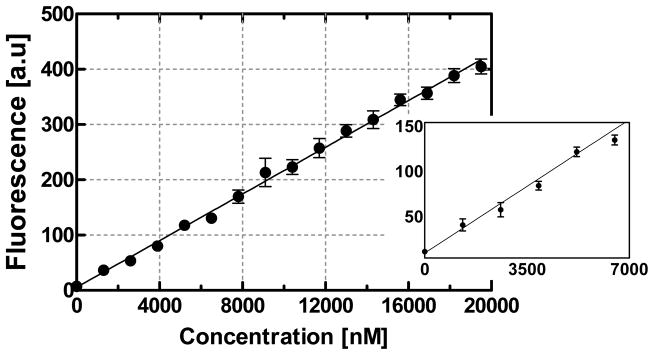
We obtained an equilibrium binding curve to relate fluorescence response, Χ, to TO-AMP sample concentration (Figure 7). Solutions of TO-AMP within a concentration range of 1.3–19.5 μM were tested using the microfluidic chip. Following each sample introduction, fluorescence yield was quantified after incubating for 3 min to insure complete capture of TO-AMP. It can be seen that below approximately 1.3 μM, no appreciable signal was detected. Concentrations at and above 1.3 μM, however, were detectable, and the fluorescence was linear with TO-AMP concentration. This was expected at these relatively low concentrations, since the concentration of aptamer, cA, was predicted to be very large (1.44 mM) Section 4.3. A proportionality constant (β = 0.02 au·nM−1) can thus be used to relate bound analyte concentration to Χ.
Figure 7.
Equilibrium binding fluorescence response of TO-AMP within the linear binding range. Inset is a magnification of the low concentration range (0–7000 nM).
5.6 Analyte Enrichment by Discrete Infusion of a Dilute Solution
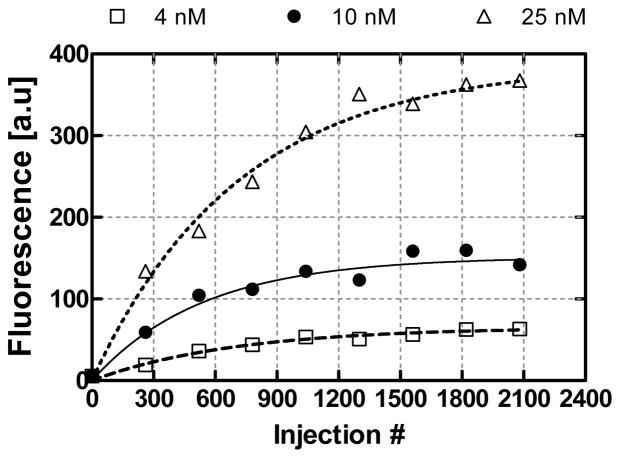
Next, we performed analyte enrichment by discrete infusion of a dilute TO-AMP solution to demonstrate the utility of aptamer-based microfluidic enrichment to enhance detection of low-concentration analyte samples (Figure 8). Discrete samples of concentrations (cS) 4, 10 or 25 nM (1 μl) were introduced into the microchamber with an incubation period of 3 min (allowing adequate capture time). Fluorescence measurements were conducted every 260 infusions.
Figure 8.
Enrichment by discrete infusion of dilute samples of TO-AMP. Lines represent a least squares fit of data to Eq. (4). As expected, the change in concentration between successive concentrations approaches zero as the number of experimental infusions increase, exhibiting a nonlinear trend.
Using a 4 nM sample, we noticed a gradual increase in fluorescence intensity as the sample infusion number (n) increased. As expected, after a sufficiently large number of sample infusions, the fluorescence signal approached a saturating value. Note that the level of fluorescence after 2080 injections (63.1 au) is well within the detectable range, whereas previously (Figure 7), detection at this analyte level was not possible. This was similar for the 10 and 25 nM samples, where the asymptotic fluorescence levels were 152 and 367 au, respectively, after 2080 injections. At n = 2080, the effective concentration of captured TO-AMP was determined to be 2.74, 6.62 and 15.9 μM for dilute feed solutions of 4, 10 and 25 nM, respectively. Thus, enrichment factors (Q2080) of 686, 662 and 639× were obtained respectively for 4, 10 and 25 nM experiments. Such enrichment factors are comparable to those achieved for common SPE enrichment approaches [8, 9], with advantages in higher specificity binding and thermally activated release.
Subsequently, as tabulated in Table 1, the enrichment model Eq. (4) was fitted to the experimental data (lines in Figure 8). The dissociation constant (Kd) was determined from the fitting to be 2.20, 2.63, and 1.91 μM for feed solutions with 4, 10, and 25 nM concentrations, respectively. Hence, the model correctly predicts the trend in the experimental data. Similarly, fitted values for the total aptamer concentration (cA) were consistent, being 1.40, 1.41, and 1.38 mM (these were within 5% of the cA predicted in Section 4.3) for the 4, 10, and 25 nM samples, respectively. By examining Eq. (5) with the calculated values for cA and Kd from Table 1, predicted asymptotic enrichment factors (Q∞) of 637, 556 and 713× for 4, 10 and 25 nM feed solutions, respectively can be obtained. This agrees with observed enrichment factors (above) by 7.17, 15.9 and 11.5%. On average, the Kd obtained from experiments above was 2.24 μM, which is roughly an order of magnitude higher than the dissociation constant for solution-based assays with the same aptamer-analyte system [31]. This deviation could be attributed to both aberrations caused by differing detection methods, and effects of the aptamer being surface-immobilized; it is thought that surface-constrained receptor orientation and steric hindrance may lead to reduced binding affinity [7].
Table 1.
Tabulated enrichment parameters following nonlinear least squares fit of Eq. (4) to experimental data in Figure 8.
| cS [nM] | Q | Kd [μM] | cA [mM] |
|---|---|---|---|
| 4 | 637 | 2.20 | 1.40 |
| 10 | 556 | 2.63 | 1.41 |
| 25 | 713 | 1.91 | 1.38 |
5.7 Analyte Enrichment by Continuous Infusion of a Dilute Solution
We finally demonstrated continuous-flow analyte enrichment due to its practical utility. Samples of 4, 10 and 25 nM TO-AMP solutions were continuously infused (0.5 μl·min−1) into the microchamber to assess any significant concentration-dependent variation in time and efficacy (Q∞) (Figure 9). Trends similar to those in the discrete infusion base (Figure 8) can be observed. That is, for all dilute sample concentrations, the fluorescence intensity increased consistently with time at a decreasing rate. Saturation appeared to occur for all samples, which were of the same TO-AMP concentration as in the discrete infusion experiments (Section 5.6). This was expected since the total molar amount of TO-AMP introduced for discrete and continuous infusion experiments was identical. Analyzing the asymptotic fluorescence values revealed final captured TO-AMP concentrations of 2.27, 5.88, and 15.3 μM for the 4, 10 and 25 nM samples, respectively. This corresponded to enrichment factors of 566, 588, and 612×, respectively, and was considered to agree with the discrete infusion results within 11, 5.7 and 14%, respectively. We surmise that fluid flow effects (e.g., shear effects, and TO-AMP transport from the microbead surface before binding), in addition to experimental errors (as mentioned previously in Section 5.1), may have been responsible for the enrichment factor differences. In addition, as only a single device was employed throughout Sections 5.5–5.7, reduced activity of aptamer due to prolonged experimentation was also a factor.
Figure 9.
Enrichment by continuous infusion of dilute samples of TO-AMP. In spite of the non-discrete method in which this experiment is performed, Eq. (5) of our model can still be used to predict the final enrichment factor for each tested TO-AMP concentration.
These enrichment characterization experiments involved time durations much longer than the corresponding enrichment time constant, which is defined in terms of the best exponential fit to the experimental data. This time constant was 45.2, 22.5 and 15.9 hours for the experiments with samples that were 4, 10 and 25 nM in AMP concentration, respectively. The enrichment time constant, which represents the time duration needed by practical enrichment processes, can be shortened by appropriate measures. For example, faster flowrates could be utilized to introduce more TO-AMP to the microchamber over shorter times, although at the expense of slightly suboptimal binding conditions. Unless flowrate is excessively high to inhibit mass transport, or kinetics, enrichment is still expected to occur. Additionally, the enrichment time could be shortened with improved microfluidic device designs, such as the inclusion of a rapid, but nonspecific, analyte preconcentration stage preceding aptamer-based specific enrichment. Furthermore, aptamer-analyte systems with faster binding kinetics could be selected to allow for more rapid enrichment. Such binding systems can in general be obtained by aptamer selection processes that enable choice of kinetic parameters [32].
6. Conclusions
As microfluidic systems are increasingly coupled to sensitive bioanalytical equipment requiring highly pure and concentrated samples, the potential for poor performance becomes high without adequate sample enrichment. We addressed this issue here by utilizing thermally responsive affinity aptamer molecules for specific purification, enrichment and release of analytes. This method offers distinct advantages over existing purification and enrichment systems, particularly platforms utilizing solid-phase extraction. These include selective analyte purification and enrichment, low temperature analyte release and isocratic elution, and a simplistic design and fabrication. We systematically characterized this method on a microchip coupled to fluorescence detection, and as a proof-of-concept, studied the binding of adenosine monophosphate and its specific aptamer, a model system. Initially, the temporal process of AMP capture by the aptamer was elucidated, which exhibited a time constant (τcap) between 2.29 and 2.89 min. This was primarily attributed to the aptamer-AMP binding kinetics. Similarly, the time course of aptamer-AMP dissociation by thermal stimulation was characterized and observed to complete within 1.3 s. Additionally, the utility of aptamer-based microfluidic purification was illustrated by performing selective capture of AMP from a sample contaminated with a biomolecular impurity, vasopressin. We then performed enrichment of AMP by either discrete or continuous infusion of a dilute sample to the aptamer-functionalized surfaces. Notably, the results corresponded satisfactorily to estimates from an analytical model developed to understand the enrichment process, while exhibiting analyte enrichment factors of 686, 662 and 639× for the discrete case, and 566, 588, and 612× for the continuous case (using feed solutions of 4, 10 and 25 nM, respectively). Further research will involve systems that use other practically important aptamer-analyte systems and are integrated with detection methods beyond fluorescence microscopy.
Acknowledgments
This research has been funded in part by the National Science Foundation (CBET-0693274, CBET-0854030 and EIA-0324845) and the National Institutes of Health (RR025816-02 and CA147925-01).
Biographies
ThaiHuu Nguyen received his B.Sci. from the University of Virginia in 2005, majoring in Aerospace Engineering. He received his M.S. from Columbia University in Mechanical Engineering in 2007. He is currently a Ph.D. candidate in Mechanical Engineering at Columbia University, and his research interests include integrating aptamers in microfluidic platforms for biochemical and biomedical related applications.
Renjun Pei received his B.Sci. degree in 1993 and Ph.D. degree in 1998 in the Department of Chemistry from Wuhan University, PR China. Dr. Pei held a JSPS postdoctoral fellowship in 2001 to 2003 in the Institute for Chemical Research, Kyoto University, Japan. He is currently working in the Department of Medicine, Columbia University. His research interests include aptamers, light-up probes, allosteric deoxyribozymes, molecular robotics, and bio/nano technologies.
Milan Stojanovic obtained his B.Sci. at Beogradski Univerzitet, Serbia and Ph. D. in organic chemistry at Harvard University, USA. After a postdoctoral fellowship at Columbia University, Department of Medicine, he remained there as a faculty member.
Qiao Lin received his Ph.D. in Mechanical Engineering from the California Institute of Technology in 1998 with thesis research in robotics. Dr. Lin conducted postdoctoral research in microelectromechanical systems (MEMS) at the Caltech Micromachining Laboratory from 1998 to 2000, and was an Assistant Professor of Mechanical Engineering at Carnegie Mellon University from 2000 to 2005. He has been an Associate Professor of Mechanical Engineering at Columbia University since 2005. His research interests are in designing and creating integrated micro/nanosystems, in particular MEMS and microfluidic systems, for biomedical applications.
References
- 1.Rios A, Escarpa A, Gonzalez MC, Crevillen AG. Challenges of Analytical Microsysterns. Trac-Trends in Analytical Chemistry. 2006;25:467–479. [Google Scholar]
- 2.Crevillen AG, Hervas M, Lopez MA, Gonzalez MC, Escarpa A. Real Sample Analysis on Microfluidic Devices. Talanta. 2007;74:342–357. doi: 10.1016/j.talanta.2007.10.019. [DOI] [PubMed] [Google Scholar]
- 3.Song S, Singh AK. On-Chip Sample Preconcentration for Integrated Microfluidic Analysis. Analytical and Bioanalytical Chemistry. 2006;384:41–43. doi: 10.1007/s00216-005-0206-3. [DOI] [PubMed] [Google Scholar]
- 4.Yang Y, Li C, Lee KH, Craighead HG. Coupling on-Chip Solid-Phase Extraction to Electrospray Mass Spectrometry through Integrated Electrospray Tip. Electrophoresis. 2005;26:3622–3630. doi: 10.1002/elps.200500121. [DOI] [PubMed] [Google Scholar]
- 5.Kim SJ, Song YA, Han J. Nanofluidic Concentration Devices for Biomolecules Utilizing Ion Concentration Polarization: Theory, Fabrication, and Applications. Chemical Society Reviews. 2010;39:912–922. doi: 10.1039/b822556g. [DOI] [PMC free article] [PubMed] [Google Scholar]
- 6.Li Y, Lee ML. Biocompatible Polymeric Monoliths for Protein and Peptide Separations. Journal of Separation Science. 2009;32:3369–3378. doi: 10.1002/jssc.200900478. [DOI] [PubMed] [Google Scholar]
- 7.Balamurugan S, Obubuafo A, Soper SA, Spivak DA. Surface Immobilization Methods for Aptamer Diagnostic Applications. Analytical and Bioanalytical Chemistry. 2008;390:1009–1021. doi: 10.1007/s00216-007-1587-2. [DOI] [PubMed] [Google Scholar]
- 8.Oleschuk R, Shultz-Lockyear L, Ning Y, Harrison D. Trapping of Bead-Based Reagents within Microfluidic Systems: On-Chip Solid-Phase Extraction and Electrochromatography. Analytical Chemistry. 2000;72:585–590. doi: 10.1021/ac990751n. [DOI] [PubMed] [Google Scholar]
- 9.Kutter JP, Jacobson SC, Ramsey JM. Solid Phase Extraction on Microfluidic Devices. Journal of Microcolumn Separations. 2000;12:93–97. [Google Scholar]
- 10.Ramsey J, Collins D. Integrated Microfluidic Device for Solid-Phase Extraction Coupled to Micellar Electrokinetic Chromatography Separation. Analytical Chemistry. 2005;77:6664–6670. doi: 10.1021/ac0507789. [DOI] [PubMed] [Google Scholar]
- 11.Long ZC, Shen Z, Wu DP, Qin JH, Lin BC. Integrated Multilayer Microfluidic Device with a Nanoporous Membrane Interconnect for Online Coupling of Solid-Phase Extraction to Microchip Electrophoresis. Lab on a Chip. 2007;7:1819–1824. doi: 10.1039/b711741h. [DOI] [PubMed] [Google Scholar]
- 12.Linhult M, Gulich S, Hober S. Affinity Ligands for Industrial Protein Purification. Protein and Peptide Letters. 2005;12:305–310. doi: 10.2174/0929866053765662. [DOI] [PubMed] [Google Scholar]
- 13.Hou C, Herr AE. Clinically Relevant Advances in on-Chip Affinity-Based Electrophoresis and Electrochromatography. Electrophoresis. 2008;29:3306–3319. doi: 10.1002/elps.200800244. [DOI] [PubMed] [Google Scholar]
- 14.Mao X, Luo Y, Dai Z, Wang K, Du Y, Lin B. Integrated Lectin Affinity Microfluidic Chip for Glycoform Separation. Analytical Chemistry. 2004;76:6941–6947. doi: 10.1021/ac049270g. [DOI] [PubMed] [Google Scholar]
- 15.Lien KY, Lin JL, Liu CY, Lei HY, Lee GB. Purification and Enrichment of Virus Samples Utilizing Magnetic Beads on a Microfluidic System. Lab on a Chip. 2007;7:868–875. doi: 10.1039/b700516d. [DOI] [PubMed] [Google Scholar]
- 16.Tombelli S, Minunni M, Mascini M. Analytical Applications of Aptamers. Biosensors & Bioelectronics. 2005;20:2424–2434. doi: 10.1016/j.bios.2004.11.006. [DOI] [PubMed] [Google Scholar]
- 17.Chung WJ, Kim MS, Cho S, Park SS, Kim JH, Kim YK, Kim BG, Lee YS. Microaffinity Purification of Proteins Based on Photolytic Elution: Toward an Efficient Microbead Affinity Chromatography on a Chip. Electrophoresis. 2005;26:694–702. doi: 10.1002/elps.200410005. [DOI] [PubMed] [Google Scholar]
- 18.Gong M, Nikcevic I, Wehmeyer KR, Limbach PA, Heineman WR. Protein-Aptamer Binding Studies Using Microchip Affinity Capillary Electrophoresis. Electrophoresis. 2008;29:1415–1422. doi: 10.1002/elps.200700777. [DOI] [PMC free article] [PubMed] [Google Scholar]
- 19.Nguyen T, Pei R, Stojanovic M, Lin Q. An Aptamer-Based Microfluidic Device for Thermally Controlled Affinity Extraction. Microfluidics and Nanofluidics. 2009;6:479–487. [Google Scholar]
- 20.Lauffenburger DA, Linderman JJ. Receptors: Models for Binding, Trafficking, and Signaling. Reprint, Illustrated. New York: Oxford University Press; 1996. [Google Scholar]
- 21.Kim P, Kwon KW, Park MC, Lee SH, Kim SM, Suh KY. Soft Lithography for Microfluidics: A Review. Biochip Journal. 2008;2:1–11. [Google Scholar]
- 22.Xia YN, Whitesides GM. Soft Lithography. Annual Review of Materials Science. 1998;28:153–184. [Google Scholar]
- 23.Wilchek M, Bayer EA. The Avidin Biotin Complex in Bioanalytical Applications. Analytical Biochemistry. 1988;171:1–32. doi: 10.1016/0003-2697(88)90120-0. [DOI] [PubMed] [Google Scholar]
- 24.Dworkin M, Keller KH. Solubility and Diffusion-Coefficient of Adenosine 3′,5′-Monophosphate. Journal of Biological Chemistry. 1977;252:864–865. [PubMed] [Google Scholar]
- 25.Shen L, Chen Z, Li YH, Jing P, Xie SB, He SL, He PL, Shao YH. A Chronocoulometric Aptamer Sensor for Adenosine Monophosphate. Chemical Communications. 2007:2169–2171. doi: 10.1039/b618909a. [DOI] [PubMed] [Google Scholar]
- 26.Svanvik N, Westman G, Wang DY, Kubista M. Light-up Probes: Thiazole Orange-Conjugated Peptide Nucleic Acid for Detection of Target Nucleic Acid in Homogeneous Solution. Analytical Biochemistry. 2000;281:26–35. doi: 10.1006/abio.2000.4534. [DOI] [PubMed] [Google Scholar]
- 27.Nygren J, Svanvik N, Kubista M. The Interactions between the Fluorescent Dye Thiazole Orange and DNA. Biopolymers. 1998;46:39–51. doi: 10.1002/(SICI)1097-0282(199807)46:1<39::AID-BIP4>3.0.CO;2-Z. [DOI] [PubMed] [Google Scholar]
- 28.Rieg T, Vallon V. ATP and Adenosine in the Local Regulation of Water Transport and Homeostasis by the Kidney. American Journal of Physiology-Regulatory Integrative and Comparative Physiology. 2009;296:R419–R427. doi: 10.1152/ajpregu.90784.2008. [DOI] [PMC free article] [PubMed] [Google Scholar]
- 29.Unruh JR, Gokulrangan G, Wilson GS, Johnson CK. Fluorescence Properties of Fluorescein, Tetramethylrhodamine and Texas Red Linked to a DNA Aptamer. Photochemistry and Photobiology. 2005;81:682–690. doi: 10.1562/2004-10-06-RA-339. [DOI] [PubMed] [Google Scholar]
- 30.Lee LG, Chen CH, Chiu LA. Thiazole Orange - a New Dye for Reticulocyte Analysis. Cytometry. 1986;7:508–517. doi: 10.1002/cyto.990070603. [DOI] [PubMed] [Google Scholar]
- 31.Pei R, Rothman J, Xie YL, Stojanovic MN. Light-up Properties of Complexes between Thiazole Orange-Small Molecule Conjugates and Aptamers. Nucleic Acids Research. 2009;37 doi: 10.1093/nar/gkp154. [DOI] [PMC free article] [PubMed] [Google Scholar]
- 32.Drabovich AP, Berezovski M, Okhonin V, Krylov SN. Selection of Smart Aptamers by Methods of Kinetic Capillary Electrophoresis. Analytical Chemistry. 2006;78:3171–3178. doi: 10.1021/ac060144h. [DOI] [PubMed] [Google Scholar]


