

Abstract
It is unclear whether ethnic differences exist in adipose tissue (AT) and skeletal muscle (SM) distribution in black and white youth. Investigation into the pattern of AT and SM distribution in black versus white youth may provide insight into the previously reported health disparities between these ethnicities. Therefore, we examined total and regional AT and SM in overweight black and white boys. The study sample included overweight black (n = 19) and white (n = 21) boys (11–18 yr, BMI ≥ 85th) whose body composition was evaluated using whole-body MRI. Despite similar age, Tanner stage, and BMI, black boys had significantly (P < .05) less visceral AT than white boys and more (P < .05) total and lower-body subcutaneous AT (SAT) in both absolute (kg) and relative (%) terms. There was a main effect (P < .05) of ethnicity on the relationship between total and regional AT, such that for a given amount of total body AT (kg), black boys had a greater (P < .05) lower-body SAT and less visceral AT than their white peers. For a given amount of total SM, black boys had more (P < .05) SM in the thigh. Compared with overweight white boys, overweight black boys have less visceral fat, more subcutaneous fat, and more thigh skeletal muscle.
1. Introduction
It is now well-established that visceral adipose tissue (AT) is a strong risk factor for many obesity related comorbidities, independent of overall obesity in children and adolescents [1–3]. Ethnic differences in abdominal AT distribution have been noted in adults [4–6] and in the pediatric age group [7–10], such that black children and adolescents have lower visceral AT area (cm2) than their white peers despite similar BMI or total fat. By contrast, little is known regarding subcutaneous AT (SAT) patterning in black versus white youth. Recently, Sisson et al. [11] have shown that white boys and girls have higher subcutaneous AT estimated by skinfold-thicknesses than their black peers, while others report no differences between black and white children [12]. Investigation into the ethnic differences in regional AT distribution is of importance since it may provide insight into underlying mechanism explaining the previously reported health disparities between blacks and whites.
Accurate assessment of skeletal muscle (SM) is essential since it plays a major role in functional capacity and metabolism. Indeed, SM is the primary site of glucose uptake [13], and the increases in SM with strength training have been reported to be associated with increases in insulin sensitivity [14]. Additionally, alterations in SM morphology (e.g., increased lipid accumulation between muscle bundles (intermuscular AT: IMAT)) are shown to be associated with decreased insulin sensitivity [15]. A previous study in adults using MRI indicates significant ethnic differences in total IMAT [16]. It is currently unclear whether this observation remains true in the pediatric age group.
Currently, magnetic resonance imaging (MRI) is considered the gold-standard imaging technique for evaluating human body composition [17]. By comparison to computed tomography, MRI provides accurate measure of different tissue areas without radiation exposure, and allows for the analysis of separate anatomical regions (e.g., legs, hips, abdomen and arms), thereby permitting a comprehensive assessment of AT and SM [17]. Using this technique, we sought to compare total and regional AT (SAT, visceral AT, and IMAT) and SM distribution in overweight black and white adolescent boys of similar age, Tanner stage, and BMI.
2. Materials and Methods
2.1. Subjects
Subjects consisted of black (n = 19) and white (n = 21) overweight (BMI ≥ 85th percentile) [18] pubertal boys (11–18 yrs old). Briefly, nine boys were participants in a cross-sectional study [19], where whole-body MRI was obtained as a secondary data, and 31 boys were recruited for an intervention study currently ongoing. All participants were recruited via newspaper advertisements in the greater Pittsburgh area, flyers posted in city public transportation, posters placed on campus, and the Weight Management and Wellness Clinic at Children's Hospital of Pittsburgh. Inclusion criteria required that all subjects were pubertal in Tanner stages II–V, nondiabetic, sedentary (no structured physical activity >2 times per week for past 3 months), and not taking medications known to affect the study outcomes (e.g., hormone therapy). These studies were approved by the University of Pittsburgh Institutional Review Board. Parental informed consent and child assent were obtained from all participants before participation.
All participants underwent physical examination at the Pediatric Clinical and Translational Research Center (PCTRC) at Children's Hospital of Pittsburgh to ensure eligibility. Pubertal development was assessed according to Tanner criteria (genital development and pubic hair). Ethnic background was verified by self-identification in three generations of both sides of the parents. All participants were evaluated at the PCTRC at Children's hospital of Pittsburgh.
2.2. Anthropometric Measurements
Body weight was measured on a balanced scale to the nearest 0.1 kg, and height was measured to the nearest 0.1 cm using a stadiometer. BMI was calculated as weight (kg) divided by height squared (m2). The Centers for Disease Control and Prevention Growth Charts were used to calculate sex- and age-specific BMI percentiles [18].
2.3. Whole-Body Magnetic Resonance Imaging (MRI)
Whole-body MRI data were obtained at the University of Pittsburgh Magnetic Resonance Research Center. In 11 subjects (8 black, 3 white), whole-body MRI data were obtained with a 1.5 Tesla magnet (General Electric Medical Systems, Milwaukee, WI) using an established protocol described in detail elsewhere [20, 21]. For 29 subjects (11 black, 18 white), a 3.0 Tesla magnet (Siemens Magnetom TIM Trio) was used to acquire whole-body MRI. This was necessitated by MR system upgrade affecting all ongoing studies.
In both 1.5 and 3.0 Tesla scanners, the subjects lay in the magnet in a prone position with their arms placed straight overhead as described previously [20, 21]. Using the L4-L5 as the point of origin, transverse images (10 mm image thickness) were obtained every 50 mm to the hand and foot. Three series of 7 images (e.g., 7 images per series) were obtained for the lower body and 3 series of 7 images were obtained for the upper body, resulting in a total of ∼41 equidistant images.
The 1.5 Tesla images were obtained using T1-weighted spin-echo sequence (210-ms repetition time and 17-ms echo time) with a 48 × 36 field of view and a 256 × 256 matrix throughout the whole-body as shown previously [20, 21]. For the abdominal series, the subjects were asked to hold their breath for 26 sec to minimize the respiratory motion artifacts. The 3.0 Tesla images were obtained using T1-weighted spin-echo sequence (700-ms repetition time and 5.5-ms echo time) with a 48 × 36 field of view and a 320 × 240 matrix throughout the whole body. For the abdominal series, the subjects were asked to hold their breath for 20 sec to minimize the respiratory motion artifacts. Once acquired, the MRI data were transferred electronically to a stand-alone computer for analysis using specially designed image analysis software (Tomovision, Montreal, Canada), the procedures for which are fully described elsewhere [20, 22]. The intra-observer variability in the analyses of 1.5 Tesla and 3.0 Tesla MR images acquired from the same subjects on the same day was 3.9% for visceral AT (n = 2) and 2.1% for abdominal SAT (n = 2) as shown previously [19].
2.4. Determination of Regional AT and SM Measures
Total AT, SAT, IMAT and SM volumes were determined using all 41 images. As shown previously [23], the image at 5 cm below L4-L5 was used to divide the upper-body and lower-body. Total VAT and abdominal SAT volumes were calculated using the five images extending from 5 cm below to 15 cm above L4-L5. Hip SAT and SM volume was calculated using the images beginning from 5 cm below L4-L5 moving inferiorly until the femoral head. Thigh SAT and SM volume was derived from the 7 images extending from the femoral head to the top of the knee. AT and SM volume was converted to mass units (kg) by multiplying the volumes by the assumed constant density for AT (0.92 kg/L) and SM (1.04 kg/L) [24].
2.5. Statistical Analysis
All statistical procedures were performed using SAS v9.1. Independent t-test was used to compare ethnic differences in subject characteristics. A chi-squire test was used to compare Tanner distribution between black versus white boys. Ethnic differences in regional AT distribution were examined using ANCOVA, with ethnicity as a fixed factor, and Tanner stage and total AT as covariates. General linear models were used to examine ethnic differences in slope (interactions) and intercept (main effects) of the regression lines between total and regional AT and SM adjusting for Tanner stage.
3. Results
3.1. Subject Characteristics
Subject characteristics are shown in Table 1. Overweight black and white boys were not significantly different (P > .05) with respect to age, Tanner stage, anthropometric measurements, and total AT or SM mass.
Table 1.
Subject characteristics.
| Black | White | P | |
|---|---|---|---|
| n | 19 | 21 | |
| Age (yr) | 14.9 ± 1.6 | 14.1 ± 1.4 | .098 |
| Tanner stage (n) | .452 | ||
| II | 1 | 0 | |
| III | 3 | 8 | |
| IV | 2 | 2 | |
| V | 13 | 11 | |
| Height (cm) | 168.2 ± 7.3 | 170.6 ± 7.6 | .316 |
| Weight (kg) | 95.4 ± 13.8 | 93.7 ± 14.2 | .707 |
| BMI (kg/m2) | 33.7 ± 4.3 | 32.1 ± 3.7 | .202 |
| BMI (percentile) | 97.8 ± 3.9 | 98.3 ± 1.5 | .530 |
| Waist circumference (cm) | 104.6 ± 12.4 | 106.8 ± 10.1 | .532 |
| Total AT (kg) | 38.8 ± 11.7 | 39.5 ± 9.5 | .846 |
Mean ± SD.
3.2. Ethnic Differences in Regional AT and SM Distribution
Ethnic differences in regional AT distribution after adjustment for Tanner stage and total AT is shown in Table 2. In absolute terms (kg), there were ethnic differences in SAT and visceral AT, such that black boys had significantly (P < .05) greater total, lower-body, leg and thigh SAT, and lower visceral AT. Similarly, when expressed relative to total AT, black boys had a significantly (P < .05) higher % leg SAT and lower % visceral AT compared with white boys (Figure 1). There were no ethnic differences (P > .05) in IMAT. Thigh SM was marginally higher in black boys than white boys (P = .052) with adjustment for Tanner stage and total AT (Table 2) or body weight (data not shown).
Table 2.
Adjusted means for regional AT and SM in black and white boys.
| Black | White | P | |
|---|---|---|---|
| SAT (kg) | |||
| Total SAT | 34.0 ± 0.3 | 32.9 ± 0.3 | .004 |
| Lower-body SAT | 18.4 ± 0.4 | 16.8 ± 0.3 | .002 |
| Upper-body SAT | 15.6 ± 0.3 | 16.2 ± 0.3 | .171 |
| Leg SAT | 15.3 ± 0.3 | 14.1 ± 0.3 | .018 |
| Thigh SAT | 10.2 ± 0.2 | 9.4 ± 0.2 | .014 |
| Hip SAT | 3.9 ± 0.2 | 3.7 ± 0.2 | .449 |
| Abdominal SAT | 6.1 ± 0.1 | 6.0 ± 0.1 | .572 |
| Arm SAT | 5.8 ± 0.1 | 5.9 ± 0.1 | .498 |
| Visceral AT (kg) | 1.0 ± 0.1 | 1.5 ± 0.1 | <.001 |
| Skeletal muscle (kg) | |||
| Total SM | 28.0 ± 0.8 | 27.0 ± 0.8 | .422 |
| Leg SM | 14.5 ± 0.5 | 14.0 ± 0.4 | .452 |
| Thigh SM | 9.6 ± 0.3 | 8.8 ± 0.3 | .052 |
| Upper-body SM | 11.2 ± 0.3 | 11.0 ± 0.3 | .672 |
| Total IMAT (kg) | 3.0 ± 0.2 | 3.4 ± 0.2 | .133 |
Adjusted mean ± SE (adjusted for Tanner stage and total AT).
Figure 1.
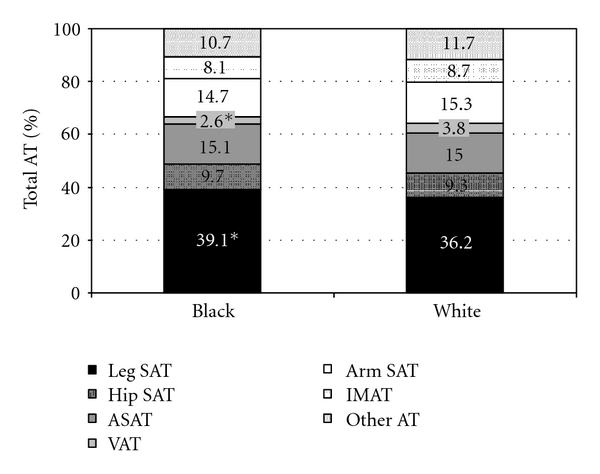
Regional AT distribution (%) in overweight black and white boys. Within bars are percentages of total AT within body segment. Other AT includes pelvic AT and head AT. *Significantly different from white boys, P < .05.
3.3. Effect of Ethnicity on the Relationships between Total and Regional AT and SM Distribution
There was a significant (P < .05) main effect of ethnicity on the relationship between total AT and regional AT, such that black boys had greater lower-body SAT compared with white boys for a given level of total AT. By contrast, there was no significant (P > .05) main effect of ethnicity on the relationship between total AT and overall upper-body SAT (e.g., arms, chest and abdomen). There were no significant ethnic differences in IMAT. For a given total AT (kg), black boys had a significantly lower (P < .05) visceral AT (kg) than white boys. Black and white boys did not differ in SM in the upper- or lower-body, but black boys did have more SM in the thigh area (P < .05), such that black boys had 0.42 kg more SM in the thighs for a given amount of total SM than white boys with adjustment for Tanner stage.
4. Conclusions
In addition to previously reported ethnic differences in visceral AT [19], we observe significant ethnic differences in the whole-body subcutaneous adipose tissue patterning between overweight black and white adolescent boys. In comparison to white boys, black boys had higher total and lower-body SAT for a given amount of total AT. Further, there were differences in skeletal muscle distribution, such that black boys had more SM in the thigh for a given amount of total SM.
Our observation that there is lower visceral AT in black compared with white boys is consistent with the previous literature in children and adolescents [7–10]. Furthermore, with the use of advanced imaging technique (whole-body MRI), our observation extends the previous studies in youth reporting black-white SAT differences estimated by skinfold thickness [11, 12]. Indeed, we quantified whole-body AT distribution and observe significantly greater total and lower-body SAT in overweight black boys compared with overweight white boys.
Using whole-body MRI, Gallagher et al. [16] report that black men and women have greater IMAT compared with their white peers. Unlike this observation in adults, we did not observe significant differences in total IMAT between black and white boys: a finding similar to our previous observations using a single-slice CT at midthigh [19]. Although we cannot be certain, it is possible that the disparate findings may be due to differences in the cohort studied. Indeed, it is unclear whether the magnitude of these ethnic differences are consistent throughout the range of obesity and age, as our study sample consisted of only young overweight boys and the aforementioned study [16] had a wide range of BMI (16–40 kg/m2) and age (18–88 yrs).
In this study, we did not observe significant ethnic differences in total SM for a given body weight. However, there were differences in SM distribution after adjusting for Tanner stage, such that black boys had a significantly greater proportion of their SM in the thigh than whites. This may indicate ethnic differences in body composition or differences in training status. However, the latter is unlikely as an inclusion criterion for the study required the boys to be physically inactive (physical activity <2 times per week).
Together, the ethnic differences in AT and SM would appear to reflect a more beneficial cardiometabolic profile in overweight black boys compared with their white peers. Ethnic differences in insulin resistance and glycemia are inconsistent in the pediatric literature, with some reporting a similar [25, 26] or worse [8] diabetogenic profile in blacks as compared to whites. In adults, emerging evidence suggests that increased lower-body SAT and total SM are protective against cardiometabolic risk. Snijder et al. [27, 28] have shown that after controlling for abdominal AT and/or visceral AT, increased thigh AT is associated with lower fasting glucose and 2-hr glucose postload glucose levels, and better lipid profiles in elderly men and women. It remains to be determined if the observed differences in body composition between overweight black and white boys translate to a more favorable cardiometabolic risk profile in overweight black boys.
The strengths and limitations of this study warrant mention. Our study extends previous observations by employing a whole-body MRI technique to quantify AT and SM in separate anatomical regions (e.g., legs, thighs, hips, arms and abdomen) in a small sample of boys. Due to system upgrade, our data was obtained using two different MRI systems. Our study participants were sedentary overweight black and white boys. Whether similar findings would be observed in other ethnic groups, physically active, or normal weight boys is unknown. Finally, because of gender differences in body composition and topography [11, 12, 29], this study was limited to boys only with currently ongoing recruitment of black and white girls as the next study.
In conclusion, we observed significant ethnic differences in the regional AT and SM patterning between overweight black and white boys. Compared with overweight white boys, overweight black boys have a body composition phenotype characterized by less visceral fat, more subcutaneous fat, and more thigh skeletal muscle. Further studies are needed to determine if these differences in body composition translate to a lower cardiometabolic risk in overweight black youth compared with their white peers, and to examine the independent associations between various AT depots and obesity-related health risk in each ethnic group.
Acknowledgments
This research was funded by Grants 7-08-JF-27 (SL, American Diabetes Association Junior Faculty Award), Department of Defense (SL & SA), 2R01-HD-27503 (SA), K24 HD01357 (SA), and UL1 RR024153 CTSA. The authors express their gratitude to the study participants and their parents, to Nancy Guerra, Sabrina Kadri, Allison Prince, and the PCTRC nursing staff for their excellent contributions.
References
- 1.Lee S, Gungor N, Bacha F, Arslanian S. Insulin resistance: link to the components of the metabolic syndrome and biomarkers of endothelial dysfunction in youth. Diabetes Care. 2007;30(8):2091–2097. doi: 10.2337/dc07-0203. [DOI] [PubMed] [Google Scholar]
- 2.Weiss R, Dufour S, Taksali SE, et al. Prediabetes in obese youth: a syndrome of impaired glucose tolerance, severe insulin resistance, and altered myocellular and abdominal fat partitioning. Lancet. 2003;362(9388):951–957. doi: 10.1016/S0140-6736(03)14364-4. [DOI] [PMC free article] [PubMed] [Google Scholar]
- 3.Goran MI, Lane C, Toledo-Corral C, Weigensberg MJ. Persistence of pre-diabetes in overweight and obese hispanic children; Association with progressive insulin resistance, Poor β-cell function, and increasing visceral fat. Diabetes. 2008;57(11):3007–3012. doi: 10.2337/db08-0445. [DOI] [PMC free article] [PubMed] [Google Scholar]
- 4.Hoffman DJ, Wang Z, Gallagher D, Heymsfield SB. Comparison of visceral adipose tissue mass in adult African-Americans and whites. Obesity Research. 2005;13(1):66–74. doi: 10.1038/oby.2005.9. [DOI] [PubMed] [Google Scholar]
- 5.Hill JO, Sidney S, Lewis CE, Tolan K, Scherzinger AL, Stamm ER. Racial differences in amounts of visceral adipose tissue in young adults: the CARDIA (coronary artery risk development in young adults) study. American Journal of Clinical Nutrition. 1999;69(3):381–387. doi: 10.1093/ajcn/69.3.381. [DOI] [PubMed] [Google Scholar]
- 6.Després JP, Couillard C, Gagnon J, et al. Race, visceral adipose tissue, plasma lipids, and lipoprotein lipase activity in men and women: the health, risk factors, exercise training, and genetics (HERITAGE) family study. Arteriosclerosis, Thrombosis, and Vascular Biology. 2000;20(8):1932–1938. doi: 10.1161/01.atv.20.8.1932. [DOI] [PubMed] [Google Scholar]
- 7.Goran MI, Nagy TR, Treuth MS, et al. Visceral fat in white and African American prepubertal children. American Journal of Clinical Nutrition. 1997;65(6):1703–1708. doi: 10.1093/ajcn/65.6.1703. [DOI] [PubMed] [Google Scholar]
- 8.Bacha F, Saad R, Gungor N, Janosky J, Arslanian SA. Obesity, regional fat distribution, and syndrome X in obese black versus white adolescents: race differential in diabetogenic and atherogenic risk factors. Journal of Clinical Endocrinology and Metabolism. 2003;88(6):2534–2540. doi: 10.1210/jc.2002-021267. [DOI] [PubMed] [Google Scholar]
- 9.Owens S, Gutin B, Barbeau P, et al. Visceral adipose tissue and markers of the insulin resistance syndrome in obese black and white teenagers. Obesity Research. 2000;8(4):287–293. doi: 10.1038/oby.2000.34. [DOI] [PubMed] [Google Scholar]
- 10.Liska D, Dufour S, Zern TL, et al. Interethnic differences in muscle, liver and abdominal fat partitioning in obese adolescents. PLoS One. 2007;2(6) doi: 10.1371/journal.pone.0000569. Article ID e569. [DOI] [PMC free article] [PubMed] [Google Scholar]
- 11.Sisson SB, Katzmarzyk PT, Srinivasan SR, et al. Ethnic differences in subcutaneous adiposity and waist girth in children and adolescents. Obesity. 2009;17(11):2075–2081. doi: 10.1038/oby.2009.132. [DOI] [PMC free article] [PubMed] [Google Scholar]
- 12.He Q, Horlick M, Thornton J, et al. Sex and race differences in fat distribution among Asian, African-American, and Caucasian prepubertal children. Journal of Clinical Endocrinology and Metabolism. 2002;87(5):2164–2170. doi: 10.1210/jcem.87.5.8452. [DOI] [PubMed] [Google Scholar]
- 13.DeFronzo RA, Gunnarsson R, Bjorkman O. Effects of insulin on peripheral and splanchnic glucose metabolism in noninsulin-dependent (type II) diabetes mellitus. Journal of Clinical Investigation. 1985;76(1):149–155. doi: 10.1172/JCI111938. [DOI] [PMC free article] [PubMed] [Google Scholar]
- 14.Poehlman ET, Dvorak RV, DeNino WF, Brochu M, Ades PA. Effects of resistance training and endurance training on insulin sensitivity in nonobese, young women: a controlled randomized trial. Journal of Clinical Endocrinology and Metabolism. 2000;85(7):2463–2468. doi: 10.1210/jcem.85.7.6692. [DOI] [PubMed] [Google Scholar]
- 15.Goodpaster BH, Thaete FL, Kelley DE. Thigh adipose tissue distribution is associated with insulin resistance in obesity and in type 2 diabetes mellitus. American Journal of Clinical Nutrition. 2000;71(4):885–892. doi: 10.1093/ajcn/71.4.885. [DOI] [PubMed] [Google Scholar]
- 16.Gallagher D, Kuznia P, Heshka S, et al. Adipose tissue in muscle: a novel depot similar in size to visceral adipose tissue. American Journal of Clinical Nutrition. 2005;81(4):903–910. doi: 10.1093/ajcn/81.4.903. [DOI] [PMC free article] [PubMed] [Google Scholar]
- 17.Ross R, Janssen I. Human Body Composition. 2nd edition. Champaign, Ill, USA: Human Kinetics; 2004. Computed tomography and magnetic resonance imaging. [Google Scholar]
- 18.Kuczmarski RJ, Ogden CL, Guo SS, et al. 2000 CDC Growth Charts for the United States: methods and development. Vital and Health Statistics, Series 11. 2002;(246):1–190. [PubMed] [Google Scholar]
- 19.Lee S, Guerra N, Arslanian S. Skeletal muscle lipid content and insulin sensitivity in black versus white obese adolescents: is there a race differential? The Journal of Clinical Endocrinology and Metabolism. 2010;95(5):2426–2432. doi: 10.1210/jc.2009-2175. [DOI] [PMC free article] [PubMed] [Google Scholar]
- 20.Ross R, Leger L, Morris D, De Guise J, Guardo R. Quantification of adipose tissue by MRI: relationship with anthropometric variables. Journal of Applied Physiology. 1992;72(2):787–795. doi: 10.1152/jappl.1992.72.2.787. [DOI] [PubMed] [Google Scholar]
- 21.Lee SJ, Janssen I, Heymsfield SB, Ross R. Relation between whole-body and regional measures of human skeletal muscle. American Journal of Clinical Nutrition. 2004;80(5):1215–1221. doi: 10.1093/ajcn/80.5.1215. [DOI] [PubMed] [Google Scholar]
- 22.Ross R, Rissanen J, Pedwell H, Clifford J, Shragge P. Influence of diet and exercise on skeletal muscle and visceral adipose tissue in men. Journal of Applied Physiology. 1996;81(6):2445–2455. doi: 10.1152/jappl.1996.81.6.2445. [DOI] [PubMed] [Google Scholar]
- 23.Kuk JL, Janiszewski PM, Ross R. Body mass index and hip and thigh circumferences are negatively associated with visceral adipose tissue after control for waist circumference. American Journal of Clinical Nutrition. 2007;85(6):1540–1544. doi: 10.1093/ajcn/85.6.1540. [DOI] [PubMed] [Google Scholar]
- 24.Snyder WS, Cooke MJ, Manssett ES, Larhansen LT, Howells GP, Tipton IH. Report of the Task Group on Reference Man. Oxford, UK: Pergamon; 1975. [Google Scholar]
- 25.Williams DE, Cadwell BL, Cheng YJ, et al. Prevalence of impaired fasting glucose and its relationship with cardiovascular disease risk factors in US adolescents, 1999-2000. Pediatrics. 2005;116(5):1122–1126. doi: 10.1542/peds.2004-2001. [DOI] [PubMed] [Google Scholar]
- 26.D'Adamo E, Northrup V, Weiss R, et al. Ethnic differences in lipoprotein subclasses in obese adolescents: importance of liver and intraabdominal fat accretion. American Journal of Clinical Nutrition. 2010;92(3):500–508. doi: 10.3945/ajcn.2010.29270. [DOI] [PMC free article] [PubMed] [Google Scholar]
- 27.Snijder MB, Dekker JM, Visser M, et al. Trunk fat and leg fat have independent and opposite associations with fasting and postload glucose levels: the Hoorn study. Diabetes Care. 2004;27(2):372–377. doi: 10.2337/diacare.27.2.372. [DOI] [PubMed] [Google Scholar]
- 28.Snijder MB, Visser M, Dekker JM, et al. Low subcutaneous thigh fat is a risk factor for unfavourable glucose and lipid levels, independently of high abdominal fat. The Health ABC Study. Diabetologia. 2005;48(2):301–308. doi: 10.1007/s00125-004-1637-7. [DOI] [PubMed] [Google Scholar]
- 29.Cowell CT, Briody J, Lloyd-Jones S, Smith C, Moore B, Howman-Giles R. Fat distribution in children and adolescents—the influence of sex and hormones. Hormone Research. 1997;48(supplement 5):93–100. doi: 10.1159/000191336. [DOI] [PubMed] [Google Scholar]