

Abstract
Semitelechelic HPMA (N-(2-hydroxypropyl)methacrylamide) copolymers possessing a single terminal lipophilic triphenylphosphonium (TPP) cation and fluorescent labels were synthesized to determine how the attached cation affected cellular uptake and intracellular trafficking. In vitro mitochondrial uptake fluorescence quenching assays using isolated mouse liver mitochondria indicated that only lower molecular weight (<5 kDa) BODIPY FL-labeled TPP-semitelechelic HPMA copolymers exhibited significant organelle localization or uptake. In vitro cellular uptake and intracellular trafficking was evaluated using cultured human ovarian carcinoma cells. Cells incubated with all types of TPP copolymers used in the study appeared to internalize the polymer by endocytosis only, and all of the internalized copolymer was confined to the lysosomal compartment after 24 h. Endocytotic uptake of the TPP–HPMA copolymer conjugates was rapid, suggesting that they were internalized by adsorptive endocytosis, rather than fluid-phase pinocytosis. Low-molecular weight (<5 kDa) and high-molecular weight (>5 kDa) semitelechelic copolymers, microinjected into cultured cells indicated that the TPP moiety did not significantly localize the polymers to mitochondria.
1. Introduction
Synthetic polymers, such as HPMA copolymers, have been shown in recent years to be versatile tools to improve the efficacy of a wide array of conventional low-molecular weight drugs. When applied to the treatment of cancer, for example, polymeric carriers of anti-cancer drugs have been used to greatly enhance the biocompatibility, pharmacokinetics1, nonimmunogenicity,2 and targetability3–7 of these agents, while reducing their toxicity toward normal cells.
Because macromolecular therapeutics (polymer–drug conjugates) are not as freely diffusible as low molecular weight (LMW) drugs, their transport and biodistribution differs markedly from free drugs. Intravascular half-life, for instance, is greatly lengthened, particularly for polymer conjugates larger than the glomerular filtration cutoff. Drug concentrations in tumor tissue are increased due to the EPR (enhanced permeability and retention) effect as a result of high rates of leakage from the neovasculature of tumor tissue. Typically, cell uptake has been shown to occur via endocytosis, whereby high molecular weight molecules are typically trafficked to the lysosomal compartment, where nondegradable compounds remain. Drug activity in this case typically requires release of the drug from the carrier via hydrolyzable bonds. Obstacles that reduce the amount of drug delivered to target cells are created by the rate of cellular internalization and/or lysosomal release. Efficacy is further limited by the problem of trafficking of bioactive agents to the subcellular compartment where the target's active site is located.
Plasma membrane transduction and delivery to the cytosol of synthetic polymers and biopolymers (such as nucleic acids) has recently been explored using cationic oligopeptides or CPPs (cell penetrating peptides). The CPP Tat peptide from the HIV-1 Tat protein has been used to deliver HPMA copolymers to the cytosol of cultured cells.8,9 Both ANTP peptides from the antennapedia protein and Tat have been used to deliver antisense PNAs to the cytosol and nucleus to inhibit gene expression.10,11
Once macromolecules are delivered to the cytosol, a number of methods have been employed to traffic them to specific subcellular compartments such as the nucleus and mitochondria. Targeting constructs to affect nuclear and mitochondria targeting of synthetic and biological polymers have included nuclear targeting sequence (NLS)12–18 and mitochondrial targeting sequence (MLS) peptides,19–21 respectively. In both cases, the peptide sequences take advantage of the endogenous nuclear or mitochondrial import machinery to deliver a conjugated, high-molecular weight cargo.
Nonpeptidic cationic functional groups have also been used as targeting moieties to penetrate the plasma membrane and to traffic conjugates to the mitochondrial compartment. These include rhodamine-123,22,23 oligoguanidinium,24 and triphenylphosphonium.25–28 Of particular interest, the experiments of Murphy et al. used terminally functionalized TPP to target anti-sense PNA into the mitochondria of isolated organelles and whole intact cells in vitro.29,30 It was determined that TPP–PNA conjugates as large as 4 kDa were directly transduced through the plasma membrane, trafficked through the cytosol, and passed through the inner and outer membranes of mitochondria in high concentrations.
Here, we have tested whether the lipophilic cationic moiety triphenylphosphonium (TPP) can be used to also traffic HPMA copolymer conjugates to the mitochondria of target cells. Semitelechelic HPMA polymers were synthesized using a thiol chain transfer agent containing TPP, thereby creating low-molecular weight polymers possessing single cation fixed on one terminus of the final polymer (TPP–HPMA).31 Semitelechelic copolymers were then created using methacroylated monomers containing either fluorescein or BODIPY FL (4,4-difluoro-5,7-dimethyl-4-bora-3a,4a-diaza-s-indacene) to act as drug models and to allow for microscopic visualization of the polymers (Scheme 1). Cell uptake and intracellular trafficking of the copolymers was then characterized using cultured human ovarian carcinoma cells.
Scheme 1.

General Synthesis of TPP-Functionalized Semitelechelic HPMA Copolymers with MA-FITC and MA-GG-BODIPY FL Comonomers
Ultimately, the ability to deliver macromolecular carriers to the cytoplasm with high efficiency and to control their intracellular trafficking will greatly widen the application and improve the efficacy of many drugs. This approach and internalization/intracellular trafficking model can be contrasted with the use of the polycationic polymer PEI (polyethyleneimine) to transport nucleic acids to the cytoplasm and, subsequently, the nucleus.32
Mitochondrion malfunction is associated with many aspects of neuron degeneration, cancer, and aging.33 Mitochondria-targeting drug carriers could be used as effective vectors for anticancer drugs, as well as other drugs, that affect mitochondrion function, the apoptotic pathway, or other signal transduction factors localized in the mitochondria.
2. Experimental Section
2.1. Materials
Chemicals and solvents used were of reagent grade or better unless otherwise stated. Before syntheses, 4-bromo-1-butene (Sigma) and thiolacetic acid (Sigma) were freshly distilled under N2. Triphenylphosphine (TPP, Sigma) was recrystallized from 95% ethanol. Diethyl ether was dried over CaCl2 and stored over Na metal. Toluene was washed with 1/10 vol. cold concentrated H2SO4, dried over CaCl2, and stored over Na.
Nontelechelic copolymers of HPMA and methacryloylated fluorescein (MA-FITC) monomer were used as control and were prepared as described by Minko et al., previously.34 These HPMA-FITC copolymers were fractionated using size-exclusion chromatography to produce polymers of a narrow polydispersity.
2.2. Synthesis of the Chain Transfer Agent Thiobutyltriphenylphosphonium Bromide (TBTP)
Following the protocol by Burns et al.,35 the thiol TBTP was generated by first synthesizing acylated TBTP. TBTP with a free thiol was generated as needed by removing the acyl protecting group using base hydrolysis.
2.2.1. Synthesis of 4-Bromobutylthiolacetate (BBTA)
The precursor 4-bromobutylthiolacetate, was synthesized by reacting 36 mmol (2.8 g) of thiolacetic acid with 18 mmol (2.5 g) of 4-bromo-1-butene with 3.3 mg of AIBN (2,2′-azobis-isobutyronitrile) at 40 °C for 60 min under nitrogen. Water was removed from thiolacetic acid by distilling the liquid with phosphorus pentoxide. The crude product was extracted into CHCl3, washed 3× with distilled H2O, and dried overnight using MgSO4. The solvent was then removed under vacuum, and BBTA was purified by alumina chromatography using CHCl3 as the mobile phase. The identity of BBTA was confirmed by TLC in CHCl3, ESI-MS (electrospray ionization mass spectroscopy; m/z = 210.8), and 1H NMR. The yield was 4.0 g (75%).
2.2.2. Acylated Thiolbutyltriphenylphosphonium Bromide (aT-BTP)
Acylated thiolbutyltriphenylphosphonium bromide was synthesized by refluxing 4-bromobutyl thiolacetate (10.1 mmol, 1.5 mL) with triphenylphosphine (10.1 mmol, 2.7 g) in dry toluene (8 mL) for 2 h under nitrogen. After cooling, the product was obtained as a viscous yellow liquid under a layer of toluene and white precipitate. The bottom solvent layer was washed with pentane followed by dry diethyl ether and dried under vacuum. Product identity and yield was determined using 1H NMR, ESI MS, and UV absorption spectra (Cary 400 Bio spectrophotometer). The yield of acyl-protected TBTP was 1.1 g or 22%.
2.2.3. Thiobutyltriphenylphosphonium Bromide (TBTP)
Thiobutyltriphenylphosphonium bromide, the deprotected mercaptan used as a chain-transfer agent, was prepared using a procedure modified from Burns et al.35 Acylated TBTP was first dissolved in 95% ethanol. Then, 0.1 M NaOH was added, and the solution was bubbled with argon for between 15 and 25 min. The solution was then neutralized by the addition of 90 mM HEPES buffer (pH 4.0). The solution containing TBTP thiol was then added directly to the polymerization reactions.
2.3. Triphenylphosphonium-BODIPY FL
As a control for the BODIPY-labeled HPMA copolymers in the isolated mitochondria assay, TBTP was conjugated to BODIPY FL N-(2-aminoethyl)maleimide (Molecular Probes), as shown in Scheme 2. Activated thiol TBTP was generated from acylated TBTP as described above immediately before the conjugation reaction. In a glass vial, 5.7 mg (12.1 μmol) of acylated TBTP was first deprotected by base hydrolysis, and the activated thiol solution was then added to a solution of 4.5 mg (11.0 μmol) of BODIPY FL N-(2-aminoethyl)maleimide dissolved in 1 mL of 1:1 DMF:H2O and left to stir at room-temperature overnight. The reaction mixture was then dried by rotoevaporation.
Scheme 2.

Synthesis of the Control Fluorescent Probe TPP–BODIPY FL by the Conjugation of TBTP and BODIPY FL N-(2-Aminoethyl)maleimide
The TPP–BODIPY conjugate was purified by preparative reverse-phase HPLC, using an analytical C18 RP column with UV (220 nm) and fluorescence detection (ex/em 480/518 nm). The column was run using a linear solvent gradient and solvent system consisting of buffer A = acetonitrile with 0.1% TFA and buffer B = 0.1% TFA. The gradient was started at 30%/70% A/B and ended at 80%/20% A/B over 25 min. Fractions collected during the main elution absorbance/fluorescence peak were pooled and dried by rotoevaporation. A MALDI-TOF MS analysis of the purified product showed a single main product with a mass of 765.2, compared to 765 for the M+1 of the expected TPP–BODIPY conjugate. The final yield of product was 5.1 mg or 52.6%.
2.4. MA-GG-BODIPY FL Monomer
Monomer incorporating the BODIPY FL fluorescent dye was synthesized by reacting (11.3 mg, 30.5 μmol) of BODIPY FL EDA (Molecular Probes) with MA-GG-ONp36 (11.8 mg, 36.8 μmol) and a 1.2 molar excess (36.8 μmol) of N,N-diisopropylethylamine (DIPEA) in DMF (Scheme 3). After stirring for 4 h at room temperature, the product was purified on an LH-20 column, and the fractions containing the product were pooled, dried, resuspended in water, and freeze-dried. The final yield of the bright orange product was 97% of theoretical yield. ESI mass spectroscopy confirmed the product at mass 517 (M+1, m/z).
Scheme 3.

Synthetic Scheme for the Comonomer MA-GG-BODIPY FL by the Conjugation of BODIPY FL EDA and MA-GG-ONp
1H NMR (400 MHz, d6-DMSO) δ 8.24–7.84 (m, 4H, −NH−), 7.64–6.29 (m, 4H, Ar−H), 5.74 (s, 1H, −C=CH2), 5.37 (s, 1H, − C=CH2), 3.76–3.65 (m, 4H, CO−CH2−NH), 3.45–3.10 (m, 8H, −CH2−CH2−), 2.46 (s, 3H, Ar−CH3), 2.25 (s, 3H, Ar−CH3), 1.87 (s, 3H, CH3−C=CH2).
2.5. Semitelechelic HPMA Polymers: Synthesis and Characterization
Semitelechelic HPMA polymers possessing triphenylphosphonium as a terminal functional group were synthesized by free radical polymerization using TBTP as a chain transfer agent. All reactions used AIBN as the initiator. Ratios of initiator, monomers, and chain transfer agent used for the polymerization of semitelechelic polymers were roughly based on those used by Oupický, et al.37 In general, all polymerization reactions were performed with 0.8 M HPMA, 3 × 10⁻³ M AIBN, and TBTP chain transfer agent concentrations ranging from 1 × 10⁻³ to 5 × 10⁻² M. If fluorophore containing comonomers were included for the synthesis of copolymers, mol %'s ranging from 0.5 to 5.0 were used, as stated below.
Reactions were typically performed at a scale of 1 mL. Before each reaction, the protecting acyl group of the chain transfer agent TBTP was removed to produce the free thiol, as described above.35,38 Methanol was used to dissolve all other reactants of the polymerization. After mixing, the reactant solution was bubbled with argon and sealed in a glass ampule. Polymerization reactions were done at 50 °C for 24 h. When complete, the solutions were diluted 10× with distilled water and then dialyzed extensively against water using tubing with a molecular weight cutoff (MWCO) of 1 kDa for polymers ranging below 5 kDa and a MWCO of 2 kDa for polymers ranging above 5 kDa. The samples were then freeze-dried to isolate the finished solid product.
2.5.1. Octanol:H2O Partition Coefficient Determinations
Approximately 1 mg of fluorescently labeled HPMA copolymer was first dissolved in 500 μL of PBS (pH 7.4) in a 1.7 mL tube. An equal volume (500 μL) of 1-octanol was aliquotted to the tube, and the sealed tube was mixed by shaking for at least 1 h. The tubes were then centrifuged at high speed for 1 min. The octanol layer was then removed, and the concentration in each fraction was determined by fluorescent spectrophometry (ex/em = 480/518 nm; in/out slit widths = 10 nm). For this, standard curves of each polymer were created using both octanol-saturated PBS and PBS-saturated octanol.
2.5.2. Size-Exclusion Chromatography
Size-exclusion chromatography (SEC) was used to determine the molecular weight distribution of the polymers. All samples were run on a Pharmacia FPLC System equipped with UV and differential refractive index detectors (ÄKTA, Pharmacia) using either a Superdex 75 or Superose 6 HR10/30 analytical column in PBS (pH 7.3) calibrated with polyHPMA standards of a narrow polydispersity (Mw/Mn < 1.1).
2.5.3. Mass Spectrometry
MALDI TOF mass spectra were determined using a Voyager-DETM STR Biospectrometry Workstation (Perseptive Biosystems, Framingham, MA). Polymer samples were spotted for analysis using a dried-droplet method. For each sample, ∼1 mg of polymer sample was first dissolved in 400 μL of 50:50 water:acetonitrile/0.1% TFA solution. A fresh saturated solution of matrix material in the solvent system of 50:50 water:acetonitrile and 0.1% TFA solution was prepared by thoroughly mixing the matrix powder of either HABA (2-[(4-hydroxyphenyl)azo]benzoic acid) or sinapinic acid with 1 mL of solvent in a 1.7 mL tube and then centrifuged to pellet the undissolved matrix. Then 5.0 μL of the supernatant matrix solution in a small plastic tube was taken and mixed thoroughly for a few seconds in a vortex mixer with the 5.0 μL of polymer sample. A 0.5–2 μL droplet of the resulting mixture was placed on the mass spectrometer's sample stage, and then the droplet was dried at room temperature.
2.5.4. TPP–HPMA-FITC Copolymers
Preliminary polymerizations were performed to characterize fluorescently labeled TPP–HPMA polymers. Initial copolymerizations used 0.5 mol % (4 mM) methacryloylated fluorescein (MA-FITC) monomer.39 In general, two different conditions were used consisting of either 7.5 or 12.5 mM TBTP chain transfer agent and the same comonomer concentrations described for TPP–HPMA polymers above. During dialysis, the samples were centrifuged to remove precipitate that formed due to the high concentrations of MA-FITC and TBTP in the aqueous solution.
The molecular weights of the polymers were characterized by SEC using an analytical Superose 6 HR10/30 FPLC column. Due to the high polydispersity of the TPP–HPMA–FITC copolymers, they were further fractionated using a preparative Superdex 75 (HR16/60) column by FPLC. Fractions from the SEC column were subsequently pooled into 6 separate cohorts. These were then dialyzed extensively against water and freeze-dried. The molecular weight distribution of each polymer fraction was then analyzed using SEC (Superose 6 HR10/30) and MALDI-TOF MS.
2.5.5. TPP–HPMA-BODIPY FL Copolymers
Semitelechelic polymers incorporating the BODIPY monomer were synthesized using MA-GG-BODIPY FL monomer and TBTP as a chain transfer agent and the general conditions described above. Copolymers with higher molecular weights (between 8 and 12 kDa) were produced using a TBTP concentration of 10 mM and a 0.1 mol % MA-GG-BODIPY FL comonomer feed concentration. Low molecular weight copolymers were generated using either 0.5 mol % (4 mM) MA-GG-BODIPY FL with 40 mM TBTP, or 1.0 mol % (8 mM) MA-GG-BODIPY FL with 10 mM TBTP. Due to the low polydispersity of the BODIPY FL-labeled polymers, no further purification or size fractionation was performed.
2.5.6. Polymers for Uptake and Localization Experiments
The semitelechelic polymers, synthesized to characterize mitochondrial and cellular uptake, were designed to test a range of parameters considered important to the mechanism of action of the cationic TPP moiety. In studies using TPP to enhance the uptake and localization of PNA the criteria cited to ensure activity were a molecular weight less than 4 kDa and a noncharged and relatively nonpolar macromolecular conjugate. For this reason, the semitelechelic polymers were synthesized from several types to investigate the physical requirements for activity. By varying the concentration of CTA used in polymerization, two classes of molecular weight distribution were created: a lower molecular weight class from 2 to 5 kDa, and a higher molecular weight class of 8–12 kDa. For both classes, semitelechelic copolymers were synthesized using fluorescent monomers possessing either fluorescein or BODIPY FL. A summary of the polymers used in uptake and microinjection studies is shown in Table 1.
Table 1. Summary of Polymers Used for Mitochondrial Uptake, Cell Incubation, and Microinjection Studies.
| polymer class | copolymers | type (Mw) | approximate MW range (kDa) |
|---|---|---|---|
| semitelechelic TPP–HPMAs | TPP–HPMA-FITC | 4 kDa | 2–5 |
| semitelechelic TPP–HPMAs | TPP–HMPA–FITC | 10 kDa | 8–12 |
| semitelechelic TPP–HPMAs | TPP–HPMA-BODIPY FL | 3 kDa | 1–5 |
| semitelechelic TPP–HPMAs | TPP–HPMA–BODIPY FL | 12 kDa | 10–15 |
| control polyHPMAs | HPMA-FITC | 10 kDa | 8–12 |
| control polyHPMAs | HPMA-FITC | 170 kDa | 150–210 |
2.6. Uptake of TPP–HPMAs by Isolated Mitochondria
Uptake of the labeled polymers was measured using a fluorescence quenching assay using isolated mitochondria. Mouse liver mitochondria were suspended in solutions containing fluorescently labeled polymers, and quenching after the activation of mitochondrial electropotential was used to determine polymer uptake.40
Free mitochondria were isolated from freshly removed mouse liver. For each series of experiments, the organ was washed with ∼10 mL of isolation buffer (10 mM sucrose, 200 mM mannitol, 5 mM HEPES, 1 mM EGTA, 1 mg/mL BSA; pH 7.4). The liver was then homogenized using an Ultraturrax homogenizer with S25N186 shearing head. The liver was homogenized at low speed (8000 rpm) until tissue was dispersed and then at high speed (9500 rpm) two times for 15 s.
To remove crude tissue debris, the homogenate was centrifuged at low speed (800g) for 10 min. The supernatant was then aliquotted into new tubes and centrifuged at high speed (10 000g) for 10 min. The pellets were then washed with fresh isolation buffer and recentrifuged for 10 min. The pellets were then suspended in ∼1 mL of cold mitochondria uptake assay buffer (70 mM sucrose, 230 mM mannitol, 3 mM HEPES, 5 mM KH2PO4, 0.5 μM rotenone; pH 7.4). The yield of mitochondria was calculated by total protein content using a standard microplate/Coomassie Blue assay.
An LS-55 luminescence spectrometer (Perkin-Elmer) was used to monitor the fluorescence of 2.5 mL sample solutions over time in a stirred sample cell warmed to 37 °C. Polymer concentrations used were typically between 0.1 and 1 μg/mL. Solutions of ∼1 μM MitoTracker CM-H2TMRos (Molecular Probes) and ∼10 μg/mL TPP–BODIPY FL were used as controls. Solutions testing unconjugated, free FITC, BODIPY FL EDA, and nontelechelic HPMA-FITC (MW = 10 kDa) were also run as controls. To test for the effect of bulk polymer on probe fluorescence, solutions containing 10 μg/mL TPP–BODIPY FL and 10 μg/mL unlabeled polyHPMA were run also.
For each incubation and fluorescence measurement, 0.5 mg of mouse liver mitochondria in 100 μL of uptake buffer was aliquotted to the glass cuvette. Shortly after, 100 μL of succinate solution buffered in 5 mM HEPES (pH 7.4) was added to activate the mitochondria to a final concentration of 5 mM. Finally, after 1–4 min, the decoupler FCCP was aliquotted in 100 μL to a concentration of 0.4 μM.41
2.7. Whole Cell Incubation
Live cell, polymer uptake studies using scanning laser confocal fluorescence microscopy (Olympus Flowview with krypton/argon excitation lasers) were performed using OVCAR-3 and MDAH2774 ovarian carcinoma cells (ATCC) to determine if polymer was internalized and localized to mitochondria. Cells were cultured in media supplemented with 10% fetal bovine serum (HyClone Laboratories, Logan, UT) and 10 μg/mL insulin (HyClone) and 12.5 mM HEPES buffer (pH 7.4) under a humidified atmosphere at 37 °C. OVCAR-3 cells were grown in RPMI media, and MDAH2774 ovarian carcinoma cells were grown in Leibovitz L-15 media (Sigma).
One day prior to each study, 50 000–100 000 cells were seeded on no. 1.5 glass-bottom 14 mm microwell dishes (MatTek Corp., Ashland, MA). For incubations, 2 mL of fresh media containing micromolar concentrations of TPP–HPMA polymer was added and the cell incubated for up to 24 h. Polymer concentrations were varied from 1 to 10 μM; however, 2 μM was used in most experiments. To visualize mitochondria, 100 nM MitoTracker Orange CM-H2TMRos was added to the media at least 1 h before microscopy. In some experiments, MitoTracker was added after the cells had incubated with polymer. Before microscopy, the incubation media was replaced with fresh media and the cells were observed without ambient polymer to reduce background fluorescence. For microscopy, images were collected by combining dual-channel fluorescent and transmitted light using z-series slices in 0.2 μm steps. Image data was processed using ImageJ software.
2.8. Microinjection
Polymer localization from the cytosol was determined using microinjection. Fluorescently labeled 0.5 mg/mL polymer/PBS solutions were directly introduced into the cytosol of plated MDAH2774 cells. Injections were performed using 0.5 μm glass needles equipped on an Eppendorf Transjector 5346 pressure injector and fixed to an Eppendorf 5171 micromanipulator arm. Pressures used varied from 50 to 200 HPa, and extra care was taken to inject solutions as far from the cell nuclei as possible to avoid traumatizing the cell structure during injection. After injection, the media was replaced with fresh media containing 100 nM of MitoTracker. The cells were then observed periodically for up to 24 h using laser scanning fluorescence confocal microscopy, as described above, to determine copolymer localization.
3. Results
3.1. Synthesis and Characterization of Semitelechelic TPP–HPMA Copolymers
The number average molecular weights (Mn) of polyHPMAs as a function of CTA concentration are summarized in Figure 1. Here, there was a very strong correlation between CTA concentration and the resulting polymer molecular weights. For comparison, the resulting values of Mn of two polymers with 1 mol % MA-FITC comonomer included in the polymerization are also shown in Figure 1. It is evident that the molecular weight of these copolymers is also consistent with the trend obtained from TPP–HPMA copolymers, based on the CTA concentration used.
Figure 1.

Summary of semitelechelic TPP–HPMA molecular weight vs feed chain-transfer agent concentration to monomer concentration ratio (●). The results for semitelechelic copolymer with MA-FITC are also shown (*).
When the data of these results are fitted into the Mayo equation40
where DPn(end) and DPn,0 are the number average degrees of polymerization with and without the chain-transfer agent S, respectively, [M] is the monomer concentration, and Cs is the chain-transfer constant. Given that all of the polymers using the CTA TBTP are semitelechelic and using the number average molecular weights derived from the SEC data, the calculated Cs value was determined to be 0.84. Compared to previous data for other thiols used as CTAs, this result indicated that TBTP had a high efficiency of chain-transfer in the polymerization reaction.43
UV–vis spectra of the semitelechelic polymers were determined using 1 mg/mL polymer sample solutions in water. The UV–vis spectra of the polymer samples indicated the incorporation of the TPP moiety based on its absorption maximum at 262 nm. MALDI-TOF mass spectra indicated that approximately 100% of the polymer chains possessing a single TPP moiety. Number average molecular weights of the polymer preparations were calculated using a molar absorptivity of ε262nm = 1650 M−1 cm−1.
MALDI-TOF analyses of all preparations of semitelechelic TPP–HPMA showed a single series of molecular weights corresponding with the increments of increasing degrees of polymerization. As shown in Figure 2, the peak series corresponded well with m/z = 143.1n (HPMA) + 349.1 (TBTP), where n is the degree of polymerization. For copolymers incorporating MA-FITC, the MALDI spectra typically showed two series of peaks: one corresponding to TPP1-(HPMA)n and another consistent with the empirical formula: m/z = 143.1n (HPMA) + 349.1 (TBTP) + 532 (MA-FITC). In Figure 3, the MALDI spectrum of SEC-fractionated semitelechelic copolymer synthesized using a 1% MA-FITC:HPMA mole ratio is shown. Here, only one peak series is prominent and the masses correspond to semitelechelic copolymer where every polymer possesses exactly one TBTP moiety and one MA-FITC monomer. The MALDI-TOF MS of unfractionated, semitelechelic copolymer synthesized with a 1% MA-GG-BODIPY FL:HPMA feed mole ratio and 10 mM TBTP is shown Figure 4. Here, there are two series of peaks: one corresponding to TPP1-(HPMA)n and another consistent with the empirical formula: m/z = 143.1n (HPMA) + 349.1 (TBTP) + 517.4 (MA-GG-BODIPY FL).
Figure 2.

MALDI-TOF mass spectrum of semitelechelic TPP–HPMA (25 mM TBTP chain-transfer agent).
Figure 3.
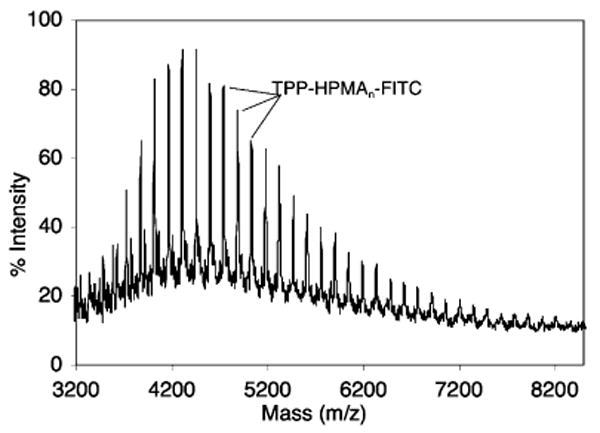
Typical MALDI-TOF mass spectrum of semitelechelic TPP–HPMA/MA-FITC copolymer.
Figure 4.

Typical MALDI-TOF mass spectrum of semitelechelic TPP–HPMA/MA-GG-BODIPY FL copolymer.
SEC and MALDI-TOF MS analyses of the synthesized copolymers confirmed that all labeled polymer chains possessed exactly one TPP moiety and exactly one fluorophore pendant group. Polymers were produced with narrow molecular weight distributions, which were predictably determined by the concentration of chain-transfer agent in the polymerization reaction. Overall, the TPP–HPMA copolymers produced for experimentation were synthesized within two molecular weight distributions: a lower molecular weight range of 2–4 kDa, and a higher molecular weight range of 8–16 kDa. When semitelechelic copolymers were produced using methacryloylated fluorescein monomer (MA-FITC), the average molecular weight of the polymer was found to be similar to that predicted from the curve for semitelechelic TPP–HPMA, based on the concentration of chain-transfer agent. Before fractionation, the polydispersity of the FITC-labeled polymers was significantly higher than those determined for other semitelechelic polymers (μ = 1.4–1.8). The molecular weights of copolymers using the BODIPY FL monomer MA-GG-BODIPY FL were significantly lower than that predicted by the CTA concentration. In general, typical yields of TPP–HPMA were 25%, TPP–HPMA-FITC 10%, and TPP–HPMA-BODIPY FL only 1%.
3.2. Partition Coefficients
The relative hydrophobicities of native polyHPMA and semitelechelic TPP–HPMAs were found to be similar to that of PNA. The octanol:water partition coefficients determined for FITC-labeled and BODIPY FL-labeled TPP–HPMA copolymers were found to be not significantly different from each other based on fluorophore type or molecular weight. The coefficients for TPP–HPMA copolymers all ranged from 3 × 10⁻³ to 1.5 × 10⁻². The coefficients for nonsemitelechelic control HPMA-FITC polymers all were found to be approximately 5 × 10⁻². These results can be compared to the coefficient for PNAs, which has been determined to be between 1 × 10⁻² and 2 × 10−2.44
3.3. Fluorescence Quenching Analyses with Isolated Mitochondria
Quenching studies using free mitochondria were performed with MitoTracker CM-H2TMRos and TPP–BODIPY FL as positive controls for the assay. Shown in Figure 5 are typical examples of the timeline profiles obtained using TPP–BODIPY FL control probe (Figure 5A) and the copolymer TPP–HPMA-BODIPY FL (Figure 5B). In these examples, specific uptake/adsorption of the fluorescently labeled compounds is indicated by the quenching of fluorsecence following the addition of succinate (S) and reactivation of mitochondrial membrane potential. Reversal of membrane potential and fluorophore uptake occurred after the addition of the inhibitor FCCP (F). The linear decrease of the fluorescent intensity before of the addition of mitochondria and the increase seen after the addition of the succinate solution are likely due to photobleaching of the fluorophores. For all probes and labeled copolymers, quenching occurred immediately after succinate addition and deflection of the fluorescence profile reached equilibrium within 60 s. For each profile, the addition of the inhibitor was followed by a mirror image deflection the profile that reached equilibrium in the same time frame as quenching. After correcting for appropriate dilution effects from the added activator and inhibitor solutions (3%–4%), the magnitude of de-quenching was calculated to be approximately the same magnitude as quenching in each profile as a percentage of total fluorescent intensity. Profiles from the low molecular weight MitoTracker and TPP–BODIPY FL probes all showed smooth exponential transitions to equilibrium fluorescence after each step addition of solutions containing mitochondria, succinate, and FCCP. Using polymer solutions, however, these transitions were sometimes characterized by large fluctuations in intensity before reaching equilibrium. The profile for TPP–HPMA-BODIPY FL-3kDa (Figure 5B) displays one example.
Figure 5.

Timeline profiles of fluorescence quenching by mitochondria. Solution of TPP–BODIPY FL control probe (A). Solution of semitelechelic copolymer TPP–HPMA-BODIPY FL-3 kDa (B).
Using the control TPP–BODIPY FL probe, the average percentage of quenching/dequenching was found to be about ±4% (Figure 5A). Of the copolymers samples, only the profile of TPP–HPMA-BODIPY FL-3 kDa possessed significant deflections from mitochondrial activation and inhibition, which were ±2% (Figure 5B). The profile of the higher molecular weight copolymer TPP–HPMA-BODIPY FL-12 kDa appeared to also have a quenching/de-quenching deflection; however, it was not significant (<1%). The profile of control HPMA-FITC-12 kDa possessing only decreases in fluorescent intensity consistent with dilution effects. None of the FITC-labeled semitelechelic TPP copolymers had deflections significantly different than that of control HPMA-FITC. The presence of unlabeled polyHPMA-10 kDa in the assay had no significant effect on the profile of the TPP–BODIPY FL probe (data not shown).
3.4. Cell Uptake and Localization Studies
Typical results from incubating cultured cells with fluorescently labeled polymers are shown in Figure 6. MDAH2774 cells incubated with TPP–HPMA copolymers in media showed only punctuate fluorescent staining for all types of polymers, regardless of time of incubation, cell type, or polymer concentration, fluorophore or molecular weight. No significant colocalization of polymer (green channel) with MitoTracker (red channel) was observed for any of the polymer samples. In general, the semitelechelic TPP–HPMA copolymers showed a much more rapid degree of internalization compared to nonsemitelechelic HPMA-FITC control polymers. After 1 h, the amount of TPP–HPMA-BODIPY FL internalized was roughly equivalent to that seen after 24 h using nontelechelic FITC-labeled control polymer. After 1 h, the amount of internalized TPP–HPMA-FITC was significantly lower than that of TPP–HPMA-BODIPY FL. No differences in the results occurred whether polymer or MitoTracker was applied first to the cells.
Figure 6.

Confocal laser scanning fluorescent microscopy (40× mag.) of MDAH2774 ovarian carcinoma cells after incubation with fluorescently labeled polymers. The red channel is Mitotracker Orange and the green channel is either FITC or BODIPY FL. (A) Control polymer HPMA-FITC after 24 h incubation. (B–E) Semitelechelic TPP–HPMAs after 6 h incubations; (B) TPP–HPMA-FITC-4 kDa; (C) TPP–HPMA-FITC-12 kDa; (D) TPP–HPMA-BODIPY FL −3 kDa; E: TPP–HPMA-BODIPY FL-12 kDa;
MDAH2774 ovarian carcinoma cells microinjected with TPP–HPMA copolymer showed only diffuse fluorescent staining throughout the cytosol and nucleus for all sample types (Figure 7, panels A and B). This was true for all types of polymer, regardless of time of incubation, fluorophore used, or molecular weight. In control injections, the diffusion of 10 kDa HPMA-FITC (Figure 7C) was observed to not be significantly different than that seen using TPP–HPMA-FITC or TPP–HPMA-BODIPY FL, and all appeared to enter the nuclei of the cells rapidly (<15 min). No differences in the amount of label between the cytosol or nucleus was noticeable after approximately 30 min. When injecting 170 kDa HPMA-FITC, the polymer was largely excluded from the nucleus for up to 8 h after injection (Figure 7D). No differences in the results occurred whether polymer or MitoTracker was applied first to the cells.
Figure 7.

Confocal laser scanning fluorescent microscopy of MDAH2774 cells after microinjection with fluorescently labeled polymers. The red channel is Mitotracker Orange and the green channel is either FITC or BODIPY FL. (A) Injection with TPP–HPMA-FITC-4 kDa and 24 h incubation at 37 °C. (B) Injection with TPP–HPMA-BODIPY FL-3 kDa and 24 h incubation. (C) Injection with HPMA-FITC-10 kDa control and 20 min incubation. (D) Injection with HPMA-FITC-170 kDa control and 6 h incubation.
4. Discussion
4.1. Polymer Synthesis and Characterization
In characterizing the semitelechelic polymers in this study, there are several points and caveats that should be made. In general, all of the MALDI-TOF MS analyses of the polymers indicated that a large majority of the polymerization products were semitelechelic and possessed exactly one TPP moiety per chain. In polymerizations using comonomers possessing a fluorophore, the product typically indicated that most common species incorporated no fluorophore while species possessing one fluorophore were a minority product. In evaluating the distribution of molecular weights, it should be noted that MALDI spectra have several biases due to the varying efficiencies of ionization of the different molecules that alter the results.45,46 First, polymers are polydisperse and the sensitivity of MALDI signals attenuates rapidly with increased molecular weight. For this reason, the molecular weight distribution of polymers derived from MALDI is heavily biased toward polymers with lower degrees of polymerization. This is especially true of polymers whose MWs range below 1 kDa as the ionizability of polymers grows exponentially higher as the degree of polymerization went below n = 10. Conversely, it is difficult to collect MALDI signals for synthetic polymers with molecular weights greater than 15 kDa. In general, “reasonable” molecular weight distributions from MALDI analyses were only possible when the total ranges were between approximately 2 and 12 kDa.
It is also possible that MALDI analysis overestimated the percentage of semitelechelic polymers compared to nontelechelic polyHPMA. The addition of a single TPP moiety to the polymer greatly increases its efficiency of ionization compared to native polyHPMA. If there was an order of magnitude difference in ionizability, it is possible that the assumed yield of semitelechelic polymer has been greatly overestimated in some of the calculations.45, 46
These caveats aside, the MALDI-TOF MS spectra for TPP–HPMA were shown to be significantly more uniformly semitelechelic in contrast to previously synthesized semitelechelic polymers using thiol CTAs.43 Previous analyses indicated that a significant portion of the polymers were terminated with AIBN adducts. This increased efficiency may be the result of using lower concentrations of AIBN initiator and higher concentrations of CTA in the polymerizations described here.37
The drawback of the concentration ratios used to produce this series of polymers, however, was low polymer yield. Typical yields of TPP–HPMA were 25%, TPP–HPMA-FITC 10%, and TPP–HPMA-BODIPY FL only 1%. The very low yield of BODIPY copolymers, however, can be largely attributed to the radical scavenger activity of BODIPY.47 Fortunately, very little material was required to complete the studies described here.
4.2. Biological Activity
The use of lipophilic cations to target mitochondria is based on its physical properties. Trafficking to the mitochondria is a function of the attraction of the delocalized positive charge to the large electronegative transmembrane potential of the mitochondria. Membrane transduction can occur since the lipophilic cation disrupts the membrane structure allowing the molecule to diffuse through the barrier, drawn by the transmembrane potential. In the case of the macromolecule PNA, it can be assumed that membrane destabilization is sufficient to drive the insertion of the linear conjugate through the lipid bilayer. Since PNA is a neutral molecule and relatively hydrophobic, the energy barrier required to move the rest of the molecule through the membrane would be low enough to be driven by the electrostatic interaction created by the cation. Here, we have tested this hypothesis with synthetic copolymers of HPMA.
The scenario for this hypothesized transmembrane transport mechanism suggested that the mitochondrotropic cation should be fixed to one terminus of a linear macromolecule. This was achieved for HPMA copolymers by the use of a triphenylphosphonium alkanethiol as a chain transfer agent. Radical chain polymerization with TBTP resulted in semitelechelic polymers that possessed single terminal TPP moiety on the polymer backbone. The other presumed physical requirements for mitochondrial targeting with lipophilic cations qualified that the conjugate possess a molecular weight less than 4 kDa and be otherwise electrically neutral and relatively nonpolar.
In this study, batches of TPP–HPMA copolymers were synthesized above and below 4 kDa by altering the concentration of CTA used in the polymerization. The requirement for conjugate neutrality was investigated by the use of two different fluorophores in comonomers: fluorescein, which possesses a negative charge at physiological pH, and the lipophilic dye BODIPY FL, which is uncharged. Using these probes, ionization state was investigated as a requirement for membrane transduction. The uptake studies using free isolated mitochondria indicated that TPP-modified HPMA polymers could be trafficked to mitochondria in solution, but also showed that this partitioning was sensitive to the physical properties of the conjugate. In this qualitative analysis, only semitelechelic TPP–HPMA-BODIPY FL with an average molecular weight below 5 kDa showed significant localization to mitochondria after the activation of membrane potential. Higher molecular weight BODIPY FL copolymers above 10 kDa showed little if any localization and none of the FITC-labeled polymer yielded significant localization. Apparently, the TPP cation is only able to direct the movement of electrically neutral and very low molecular weight conjugates.
The fluorescence quenching results are not definitive, however, as they represent only a qualitative analysis of mitochondrial uptake. Fluorophore quenching can only indicate local concentration and does not yield information as to whether the probe is uptaken into the membranes of mitochondria or only absorbed to their surface. The significance of the degree of quenching of fluorophores conjugated to polymers is also questionable since the structure of the polymer around the fluorophore can have unpredictable effects on quenching/dequenching. This issue may be responsible for the complex fluctuations of fluorescent intensity seen in the quenching profiles for the copolymers. Because of these uncertainties, localization studies using live cells should be considered more definitive on the effects of TPP conjugate.
The results of the cell incubation studies clearly showed that TPP–HPMA copolymers were not uptaken by the cells in the same manner as TPP–PNA. All internalization occurred by endocytosis and no evidence of endosomal release was noted after 24 h. Interestingly, different relative rates of internalization were noted for the different classes of copolymers. Compared to the nontelechelic HPMA–FITC polymer control, the TPP semitelechelic polymers appeared to internalize significantly more quickly. This may simply be a function of their positive charge producing higher binding affinity to the plasma membrane. It is possible that the TPP moiety enhanced the amount of adsorption of the polymers and, thereby, greatly increased the rate of adsorptive endocytosis. Also, the BODIPY FL-labeled polymers were internalized more rapidly than the FITC polymers. It can be hypothesized that the lack of negative charges on the BODIPY FL polymers was the source of this difference.
The lack of plasma membrane penetration may simply be a consequence of some unknown physical requirement that is possessed by PNA but is lacking in the HPMA copolymers. Membrane transduction may require some parameters of chemical makeup or molecular shape that have yet to be described. Another possibility is that TPP does not actually act to affect direct plasma membrane transduction by PNA but rather enhances the uptake mechanism that occurs for unmodified PNA. Recent work describing the uptake of naked PNA has suggested that internalization occurs mainly by fluid-phase endocytosis followed by endosomal/lysosomal release to the cytosol.19 The role of TPP on the mechanism of cellular uptake of TPP–PNA may, therefore, be analogous to that proposed more recently for cell penetrating peptides, such as TAT, in high molecular weight conjugates.48 It is possible that TPP increases the rate by instead enhancing the rate of adsorptive endocytosis by increasing plasma membrane binding. TPP may also greatly increase the rate of endosomal release by disrupting vesicle structure after endocytosis. A combination of these effects is also possible.
More surprising were the results after polymer microinjection into the cytosol. None of the TPP polymers exhibited colocalization with mitochondria. Regardless of molecular weight distributions or fluorophore type, all types of semitelechelic polymer were found to diffuse evenly throughout the cytosol and nuclei of the cells and to remain in that state after 24 h. These results are consistent, with respect to polymer distribution and time scale, with previous work where HPMA copolymers were microinjected into Hep G2 cells.49 Similar to the results described here, FITC-labeled HPMA copolymers with molecular weights of 23–25 kDa were found to enter the nuclei within 15 min of microinjection. However, in this study, it was found that the copolymers partitioned largely into the nuclear compartment after 60 min. Here, the amount of LMW (<20 kDa) control HPMA–FITC and TPP–HPMA copolymers of weights in the cytosol and nucleus remained roughly equivalent for up to 24 h. Meanwhile, the high molecular weight (170 kDa) HPMA–FITC control copolymer remained completely excluded from the nuclei. The similar results for semitelechelic and nontelechelic polymers demonstrated that the presence of the cationic TPP moiety had no significant effect on nuclear entry or nuclear accumulation of the copolymers.
One possibility for the absence of mitochondrial localization is that the movement restriction of HPMA polymers is much lower than that of PNA in cytoplasm. In the former case, the energetics of the electrostatic attraction of the TPP cation to the mitochondrial transmembrane potential may be insufficient to affect the free diffusion of the synthetic polymer in cytoplasm. Since PNA is a nucleic acid analogue, its diffusion in cytoplasm may be restricted and guided by interactions with other nucleic acids and various proteins that are present in the cytosol. The formation of hybrid RNA:PNA duplexes, for example, may influence the intracellular fate of PNA in a manner not available to synthetic polymers in the cytosol.50 It may be significant that the localization of TPP–HPMA copolymers was dependent on the type of fluorophore used. TPP–HPMA copolymers labeled with BODIPY FL adsorbed readily to isolated mitochondria in vitro whereas FITC-labeled copolymers showed insignificant adsorption. It is possible that the presence of the single negative charge on FITC was enough to significantly counteract the electrostatic force between the mitochondria and the TPP copolymers. This suggests that driving force created by the lipophilic cation may be easily overwhelmed by other forces acting upon the polymeric carriers.
Acknowledgments
We thank Dr. Pavla Kopečková for valuable discussions. This research was supported in part by NIH Grant CA51578 from the National Cancer Institute.
Abbreviations
- AIBN
2,2′-azobis-isobutyronitrile
- BB
4-bromo-1-butene
- BBTA
4-bromobutylthiolacetate
- BODIPY FL
4,4-difluoro-5,7-dimethyl-4-bora-3a,4a-diaza-s-indacene
- BODIPY FL EDA
4,4-difluoro-5,7-dimethyl-4-bora-3a,4a-diaza-s-indacene-3-propionyl ethylenediamine, hydrochloride
- BSA
bovine serum albumin
- CTA
chain-transfer agent (see TBTP)
- DIPEA
N,N-diisopropylethylamine
- DMSO
dimethyl sulfoxide
- EDTA
ethylenediaminetetraacetic acid
- EGTA
ethylene glycol bis(β-aminoethyl ether)-N,N′-tetraacetic acid
- ESI MS
electrospray ionization mass spectrometry
- FCCP
carbonyl cyanide p-trifluoromethoxyphenylhydra-zone
- FITC
fluorescein isothiocyanate
- FPLC
fast protein liquid chromatography
- HEPES
4-(2-hydroxyethyl)-1-piperazineethanesulfonic acid
- HPMA
N-(2-hydroxypropyl)methacrylamide
- MA-FITC
N-methacrylolyaminopropyl fluorescein thiourea
- MA-GG-BODIPY FL
N-methacryloylglycylglycyl-4,4-difluoro-5,7-dimethyl-4-bora-3a,4a-diaza-s-indacene
- MA-GG-ONp
N-methacryloylglycylglycyl p-nitrophenyl ester
- MALDI-TOF MS
matrix-assisted laser desorption/ionization time-of-flight mass spectrometry
- MWCO
molecular weight cutoff
- NMR
nuclear magnetic resonance
- PNA
peptide nucleic acid
- SEC
size-exclusion chromatography
- TBTP
thiobutyltriphenylphosphonium (bromide)
- TLC
thin-layer chromatography
- TPP
triphenylphosphine, triphenylphosphium
- TPP–BODIPY FL
conjugate of TBTP and BODIPY FL N-(2-aminoethyl)malemide
- TPP–HPMA-BODIPY FL
semitelechelic (CTA=TBTP) copolymer of HPMA and MA-GG-BODIPY FL
- TPP–HPMA-FITC
semitelechelic (CTA=TBTP) copolymer of HPMA and MA-FITC
References and Notes
- 1.Seymour LW, Duncan R, Strohalm J, Kopeček J. J Biomed Mater Res. 1987;21:1341–1358. doi: 10.1002/jbm.820211106. [DOI] [PubMed] [Google Scholar]
- 2.Říhová B, Ulbrich K, Kopeček J, Mančal P. Folia Microbiol (Praha) 1983;28:217–227. doi: 10.1007/BF02884085. [DOI] [PubMed] [Google Scholar]
- 3.Lu ZR, Gao SQ, Kopečková P, Kopeček J. Bioconjug Chem. 2000;11:3–7. doi: 10.1021/bc990098a. [DOI] [PubMed] [Google Scholar]
- 4.Omelyanenko V, Kopečková P, Gentry C, Kopeček J. J Controlled Release. 1998;53:25–37. doi: 10.1016/s0168-3659(97)00235-6. [DOI] [PubMed] [Google Scholar]
- 5.Omelyanenko V, Gentry C, Kopečková P, Kopeček J. J Cancer. 1998;75:600–608. doi: 10.1002/(sici)1097-0215(19980209)75:4<600::aid-ijc18>3.0.co;2-c. [DOI] [PubMed] [Google Scholar]
- 6.Kopeček J. Ann N Y Acad Sci. 1991;618:335–344. doi: 10.1111/j.1749-6632.1991.tb27253.x. [DOI] [PubMed] [Google Scholar]
- 7.Xu JP, Ji J, Chen WD, Shen JC. J Controlled Release. 2005;107:502–512. doi: 10.1016/j.jconrel.2005.06.013. [DOI] [PubMed] [Google Scholar]
- 8.Nori A, Jensen KD, Tijerina M, Kopečková P, Kopeček J. J Controlled Release. 2003;91:53–59. doi: 10.1016/s0168-3659(03)00213-x. [DOI] [PubMed] [Google Scholar]
- 9.Nori A, Jensen KD, Tijerina M, Kopečková P, Kopeček J. Bioconjugate Chem. 2003;14:44–50. doi: 10.1021/bc0255900. [DOI] [PubMed] [Google Scholar]
- 10.Astriab-Fisher A, Sergueev D, Fisher M, Shaw BR, Juliano RL. Pharm Res. 2002;19:744–754. doi: 10.1023/a:1016136328329. [DOI] [PubMed] [Google Scholar]
- 11.Astriab-Fisher A, Sergueev DS, Fisher M, Shaw BR, Juliano RL. Biochem Pharmacol. 2000;60:83–90. doi: 10.1016/s0006-2952(00)00310-5. [DOI] [PubMed] [Google Scholar]
- 12.Aronov O, Horowitz AT, Gabizon A, Fuertes MA, Perez JM, Gibson D. Bioconjugate Chem. 2004;15:814–823. doi: 10.1021/bc0499331. [DOI] [PubMed] [Google Scholar]
- 13.Braun K, Peschke P, Pipkorn R, Lampel S, Wachsmuth M, Waldeck W, Friedrich E, Debus J. J Mol Biol. 2002;318:237–243. doi: 10.1016/S0022-2836(02)00031-1. [DOI] [PubMed] [Google Scholar]
- 14.Frederickson R. Nat Biotechnol. 1999;17:739. doi: 10.1038/11650. [DOI] [PubMed] [Google Scholar]
- 15.Nori A, Jensen KD, Tijerina M, Kopečková P, Kopeček J. J Controlled Release. 2003;91:53–59. doi: 10.1016/s0168-3659(03)00213-x. [DOI] [PubMed] [Google Scholar]
- 16.Kaihatsu K, Huffman KE, Corey DR. Biochemistry. 2004;43:14340–14347. doi: 10.1021/bi048519l. [DOI] [PubMed] [Google Scholar]
- 17.van der Aa M, Koning G, van der Gugten J, d'Oliveira C, Oosting R, Hennink WE, Crommelin DJ. J Controlled Release. 2005;101:395–397. [PubMed] [Google Scholar]
- 18.van der Aa MA, Koning GA, d'Oliveira C, Oosting RS, Wilschut KJ, Hennink WE, Crommelin DJ. J Gene Med. 2005;7:208–217. doi: 10.1002/jgm.643. [DOI] [PubMed] [Google Scholar]
- 19.Chinnery PF, Taylor RW, Diekert K, Lill R, Turnbull DM, Lightowlers RN. Gene Ther. 1999;6:1919–1928. doi: 10.1038/sj.gt.3301061. [DOI] [PubMed] [Google Scholar]
- 20.Chinnery PF, Taylor RW, Diekert K, Lill R, Turnbull DM, Lightowlers RN. Gene Ther. 2000;7:813. doi: 10.1038/sj.gt.3301200. [DOI] [PubMed] [Google Scholar]
- 21.Szeto HH, Schiller PW, Zhao K, Luo G. FASEB J. 2005;19:118–120. doi: 10.1096/fj.04-1982fje. [DOI] [PubMed] [Google Scholar]
- 22.Teicher BA, Holden SA, Jacobs JL, Abrams MJ, Jones AG. Biochem Pharmacol. 1986;35:3365–3369. doi: 10.1016/0006-2952(86)90437-5. [DOI] [PubMed] [Google Scholar]
- 23.Teicher BA, Varshney A, Khandekar V, Herman TS. Int J Hypertherm. 1991;7:857–868. doi: 10.3109/02656739109056454. [DOI] [PubMed] [Google Scholar]
- 24.Fernandez-Carneado J, Van Gool M, Martos V, Castel S, Prados P, de Mendoza J, Giralt E. J Am Chem Soc. 2005;127:869–874. doi: 10.1021/ja044006q. [DOI] [PubMed] [Google Scholar]
- 25.Smith RA, Porteous CM, Coulter CV, Murphy MP. Eur J Biochem. 1999;263:709–716. doi: 10.1046/j.1432-1327.1999.00543.x. [DOI] [PubMed] [Google Scholar]
- 26.Smith RA, Kelso GF, James AM, Murphy MP. Methods Enzymol. 2004;382:45–67. doi: 10.1016/S0076-6879(04)82003-2. [DOI] [PubMed] [Google Scholar]
- 27.Kelso GF, Porteous CM, Hughes G, Ledgerwood EC, Gane AM, Smith RA, Murphy MP. Ann N Y Acad Sci. 2002;959:263–274. doi: 10.1111/j.1749-6632.2002.tb02098.x. [DOI] [PubMed] [Google Scholar]
- 28.Coulter CV, Kelso GF, Lin TK, Smith RA, Murphy MP. Free Radic Biol Med. 2000;28:1547–1554. doi: 10.1016/s0891-5849(00)00255-0. [DOI] [PubMed] [Google Scholar]
- 29.Filipovska A, Eccles MR, Smith RA, Murphy MP. FEBS Lett. 2004;556:180–186. doi: 10.1016/s0014-5793(03)01403-0. [DOI] [PubMed] [Google Scholar]
- 30.Muratovska A, Lightowlers RN, Taylor RW, Turnbull DM, Smith RA, Wilce JA, Martin SW, Murphy MP. Nucleic Acids Res. 2001;29:1852–1863. doi: 10.1093/nar/29.9.1852. [DOI] [PMC free article] [PubMed] [Google Scholar]
- 31.Kamei S, Kopeček J. Pharm Res. 1995;12:663–668. doi: 10.1023/a:1016247206531. [DOI] [PubMed] [Google Scholar]
- 32.Erbacher P, Bettinger T, Brion E, Coll JL, Plank C, Behr JP, Remy JS. Drug Target. 2004;12:223–236. doi: 10.1080/10611860410001723487. [DOI] [PubMed] [Google Scholar]
- 33.Singh KK. Ann NY Acad Sci. 2004;1019:260–264. doi: 10.1196/annals.1297.043. [DOI] [PubMed] [Google Scholar]
- 34.Minko T, Kopečková P, Kopeček J. Int J Cancer. 2000;86:108–117. doi: 10.1002/(sici)1097-0215(20000401)86:1<108::aid-ijc17>3.0.co;2-8. [DOI] [PubMed] [Google Scholar]
- 35.Burns RJ, Smith RA, Murphy MP. Arch Biochem Biophys. 1995;322:60–68. doi: 10.1006/abbi.1995.1436. [DOI] [PubMed] [Google Scholar]
- 36.Rejmanová P, Labský J, Kopeček J. Makromol Chem. 1977;178:2159–2168. [Google Scholar]
- 37.Oupický D, Kočák Č, Ulbrich K. J Biomater Sci Polym Ed. 1999;10:573–590. doi: 10.1163/156856299x00496. [DOI] [PubMed] [Google Scholar]
- 38.Burns RJ, Murphy MP. Arch Biochem Biophys. 1997;339:33–39. doi: 10.1006/abbi.1996.9861. [DOI] [PubMed] [Google Scholar]
- 39.Omelyanenko V, Kopečková P, Gentry C, Shiah JG, Kopeček J. J Drug Target. 1996;3:357–373. doi: 10.3109/10611869608996827. [DOI] [PubMed] [Google Scholar]
- 40.Torchilin VP, Khaw BA, Weissig V. Somat Cell Mol Genet. 2002;27:49–64. doi: 10.1023/a:1022936024061. [DOI] [PubMed] [Google Scholar]
- 41.Davey GP, Tipton KF, Murphy MP. J Neural Transm Suppl. 1993;40:47–55. [PubMed] [Google Scholar]
- 42.Heitz W. Telechelics by radical polymerization reactions. CRC Press; Boca Raton, FL: 1989. [Google Scholar]
- 43.Lu ZR, Kopečková P, Wu Z, Kopeček J. Bioconjugate Chem. 1998;9:793–804. doi: 10.1021/bc980058r. [DOI] [PubMed] [Google Scholar]
- 44.Ardhammar M, Norden B, Nielsen PE, Malmstrom BG, Wittung-Stafshede P. J Biomol Struct Dyn. 1999;17:33–40. doi: 10.1080/07391102.1999.10508338. [DOI] [PubMed] [Google Scholar]
- 45.Chen H, He M. Am Soc Mass Spectrom. 2005;16:100–106. doi: 10.1016/j.jasms.2004.09.024. [DOI] [PubMed] [Google Scholar]
- 46.Zhang LK, Rempel D, Pramanik BN, Gross ML. Mass Spectrom Rev. 2005;24:286–309. [Google Scholar]
- 47.Makrigiorgos GM. J Biochem Biophys Methods. 1997;35:23–35. doi: 10.1016/s0165-022x(97)00020-1. [DOI] [PubMed] [Google Scholar]
- 48.Brooks H, Lebleu B, Vives E. Adv Drug Delivery Rev. 2005;57:559–577. doi: 10.1016/j.addr.2004.12.001. [DOI] [PubMed] [Google Scholar]
- 49.Jensen KD, Kopečková P, Bridge JH, Kopeček J. AAPS Pharm Sci. 2001;3:E32. doi: 10.1208/ps030432. [DOI] [PMC free article] [PubMed] [Google Scholar]
- 50.Abibi A, Protozanova E, Demidov VV, Frank-Kamenetskii MD. Biophys J. 2004;86:3070–3078. doi: 10.1016/S0006-3495(04)74356-8. [DOI] [PMC free article] [PubMed] [Google Scholar]