

Abstract
Purpose
To quantitate and predict colon-specific 9-aminocamptothecin (9-AC) release from the N-(2-hydroxypropyl)methacrylamide (HPMA) copolymer–9-AC conjugate and its absorption behavior after oral administration in rats.
Methods
Drug distribution in the gastrointestinal (GI) tract and the plasma concentration-time profile of 9-AC released from the HPMA copolymer conjugate were predicted using the degradation, transit, and absorption rate constants in cecum. The fate of 9-AC in cecum and liver was measured by in-situ cecum absorption and liver perfusion.
Results
Following oral administration of the conjugate, 9-AC was released rapidly in cecum. Based on the pharmacokinetic model, up to 60% of the dose was in the cecum at ∼6 h, and 7% of the dose still remained there at 24 h. The predicted plasma concentration curve for released 9-AC after an oral dose of 3 mg/kg of 9-AC equivalent increased gradually and reached a peak of 98 nM at 7 h, then started decreasing slowly to 16 nM at 24 h. The bioavailability value was estimated as 0.31 after the first-pass elimination.
Conclusions
A pharmacokinetic model delineated the impact of GI transit, drug absorption rate, and first-pass metabolism on drug disposition following oral administration of HPMA copolymer–9-AC conjugate in rats.
Keywords: absorption prediction, colon-specific drug delivery, HPMA copolymer–9-aminocamptothecin conjugate, oral dosing, pharmacokinetic modeling
Introduction
A topoisomerase I inhibitor, 9-aminocamptothecin (9-AC), is a cell cycle dependent anticancer drug. Topoisomerase I, a nuclear enzyme, covalently binds to double-stranded DNA through a reversible transesterification reaction to form a cleavable complex that facilitates the relaxation of torsional strain in supercoiled DNA (1–3). 9-AC inhibits topoisomerase I by binding to and stabilizing the normally transient DNA-topoisomerase I cleavable complex (2). The collision of the DNA replication fork with the ternary drug-enzyme-DNA complex results in an irreversible double-strand break that finally leads to cell death (3,4). Because ongoing DNA synthesis is required to produce cytotoxicity, 9-AC is an S phase-specific drug. Generally, prolonged tumor exposure to drug concentrations exceeding a minimum threshold is necessary to optimize therapeutic efficacy of S phase-specific cytotoxic drugs (5).
9-AC demonstrates outstanding preclinical activity against a wide spectrum of solid tumors, however, clinical trials have been disappointing. Consequently, further development has been limited (6–10). However, the differences in the results of preclinical compared to clinical trials are explicable. Kirsten et al. logically explained the failure of 9-AC to demonstrate notable antitumor activity in humans by carefully comparing 9-AC pharmacokinetics in preclinical animal efficacy experiments to early clinical trials (11). The MEDOR (minimum effective dose of objective response) is defined by the pharmacokinetic parameter, AUC (area under the concentration time curve), ranged from 690 to 1,580 ng/ml·h in mice. However, due to the greater myelosupressive sensitivity of humans compared with mice, the maximum tolerated 9-AC systemic exposure in humans was limited to 126 to 493 ng/ml·h (10,12). Because the systemic exposure required for antitumor effect exceeded that attainable in humans, it is not surprising that few antitumor responses have been observed with 9-AC. These facts stress the importance of pharmacokinetic data in evaluating both preclinical experiments and early clinical development as well as the utility of alternative drug delivery systems designed to avoid systemic toxicity.
To improve local therapy of colon cancer, maximize the therapeutic response, and minimize toxic effects, a drug delivery system for oral colon-specific delivery of 9-AC was designed, with 9-AC attached to an HPMA copolymer carrier via a spacer containing an aromatic azo bond and a self-eliminating 4-aminobenzylcarbamate group (13,14). When the HPMA copolymer–9-AC conjugate reaches the colon, unmodified 9-AC is released from the polymer by the cleavage of the azo bond by the azo-reductase activities of colonic microflora, followed by 1,6-elimination. This design permits a high local concentration to be achieved. Furthermore, due to slow transit and drug absorption in colon (15), it is expected that colon tumors may be exposed to high 9-AC concentrations for prolonged time with low systemic toxicity. Previously, the biodistribution and pharmacokinetics of this conjugate were studied in mice (14). After oral administration of the HPMA copolymer–9-AC conjugate, a vast majority of 9-AC was released in cecum. The Cmax of 9-AC released from the polymer group in plasma was about 3-fold lower than that from the orally dosed free drug group.
In this study, we report the development of a pharmacokinetic animal model to predict drug release and absorption after oral administration of the polymer conjugate in rats. This model successfully predicts the plasma concentration-time profiles of released 9-AC from the HPMA copolymer conjugate by analyzing GI transit and absorption behavior.
Materials and Methods
Materials
9-AC was a generous gift from the National Cancer Institute, NIH. HPMA copolymer–9-AC conjugate was prepared as previously described (13). Briefly, the polymer conjugate (Fig. 1) was prepared by radical copolymerization of HPMA (6.5 mmol) with 9-AC containing monomer, 9-N-{4-[4-(N-methacryloyl-N′-oxymethylcarbonyl-propyldiamino)-3-chlorophenyl-azo] benzylmethoxycarbonyl}aminocamptothecin (0.1 mmol), in the presence of 2,2′-azobisisobutyronitrile (0.43 mmol) as the initiator at 50°C for 24 h. The molecular weight (Mn = 24 kDa) was estimated by size exclusion chromatography (Pharmacia AKTA system). The content of 9-AC (2.2 wt.%) was determined by UV spectroscopy at 360 nm using ε = 30,200 M−1cm−1. All other chemicals were from VWR (West Chester, PA). The organic solvents used for assay were of HPLC grade.
Fig. 1.

The structure of the HPMA copolymer–9-AC conjugate.
Animals
Male Wistar rats, 300–350 g bodyweight, were purchased from Charles River (Wilmington, MA) and kept in a typical laboratory environment: two rats per cage with an air filter cover under light (12 h light/dark cycle) and temperature-control (22± 1°C). The rats were fasted for 16 h prior to and during the experiments, and allowed free access to water. All animals were cared for in compliance with the “Principles of Laboratory Animal Care” and “Guide for the Care and Use of Laboratory Animals.” Experiments followed an approved protocol from the University of Utah Institutional Animal Care and Use Committee.
Determination of Degradation Rate Constant
The degradation rate constant was determined from the release rate of 9-AC from HPMA copolymer conjugates in rat cecal contents. The HPMA copolymer–9-AC conjugate was incubated in a suspension of cecal contents under a nitrogen atmosphere at 37°C (16,17). The final concentrations in this suspension were 15% (w/v) of cecal contents in phosphate buffer (pH 7.3), 2% (w/v) of α-D-glucose, and 1.8 μM of 9-AC equivalent in HPMA copolymer–9-AC conjugate. At each scheduled time point, 1 ml sample was withdrawn, and 200 μl of 85% phosphoric acid was added to stop the degradation reaction. All samples were centrifuged at 1,500 g for 5 min, and the supernatants were analyzed by an HPLC fluorescence assay.
Determination of Absorption Rate Constant
The absorption experiments were performed in cecum using an in-situ closed loop method (18,19). Initial concentration of 9-AC was 72.9 μM. The first-order absorption rate constant was estimated from the rate of the drug disappearance in cecum.
Administration of Free and HPMA Copolymer–Bound 9-AC
The HPMA copolymer–9-AC conjugate was dissolved in DI water at a concentration of 10 mg/ml, equivalent to 0.15 mg/ml of 9-AC. The free 9-AC was prepared in a vehicle containing 6% of dimethyl acetamide (DMA) in 0.01 M phosphoric acid: PEG 400 (49:51, v/v) at a concentration of 0.27 mg/ml (20). For oral administration, the polymer conjugates were given to the rats by oral gavage using feeding needles at a dose of 3 mg/kg of 9-AC equivalent. For intravenous administration, free 9-AC was injected into the left femoral vein at a dose of 1 mg/kg of 9-AC. Blood samples were taken at scheduled time points from the cannulated right femoral artery and centrifuged at 1,500 g for 5 min to obtain plasma.
In-situ Cecum Absorption Study
A closed loop method was used in the in-situ cecum absorption study to estimate the availability of 9-AC through the cecum and liver (Fc,h) after absorption from the cecum (18,19,21). The blood samples were collected from the right femoral artery after 72.9 μM of 9-AC in 4 ml of isotonic phosphate-buffered solution (pH 6.8) was administrated into the rat cecum. To determine the amount of 9-AC remaining in the cecum 8 h after administration, the contents were collected, the cecum was washed with saline, and the combined contents and washings were analyzed using an HPLC assay. The fraction of absorbed dose was calculated from the remaining amount of 9-AC in the cecum. The bioavailability (F8h) was determined using AUC values from this study and the intravenous administration study. The following equations were used to calculate Fc,h and Fc (21):
| (1) |
| (2) |
where Fc and Fh are cecal and hepatic availability, respectively.
Protein Binding Study
To determine protein binding in plasma, 10 μl of 9-AC in phosphate-buffered isotonic solution was mixed with 1 ml of rat plasma to obtain a concentration of 2.43 μM. After incubation for 30 min at 37°C, 50 μl of the plasma was removed to measure the total plasma concentration, and the remainder was transferred to an Amicon ultrafiltration tube (10 kDa cutoff). The tube was centrifuged for 20 min at 3,000 g, and 9-AC concentration in the filtrate was determined as the unbound plasma concentration (22).
Heparinized whole rat blood was used to determine the Rb (blood-to-plasma concentration ratio). To prepare final concentrations of 0.36, 0.73, and 1.45 μM, 10-μl aliquots of 9-AC in phosphate-buffered isotonic solution were added to 490-μl aliquots of rat blood pre-incubated at 37°C. After 5 min of incubation at 37°C, the blood samples were centrifuged at 1,500 g for 5 min to obtain plasma, and 9-AC concentration in plasma were determined by HPLC. The Rb value was calculated using the hematocrit value of 0.46 (n =4).
Liver Perfusion Study
To estimate the availability of 9-AC through liver after cecal absorption, the liver noncyclical perfusion was performed using the techniques described in the literature (23,24). Noncyclical perfusions were used to increase sensitivity in detecting small changes and avoid recycling of liver metabolites. Briefly, the rats were anesthetized with pentobarbital intraperitoneally. The bile duct was first cannulated, followed by cannulation of the portal vein, ligation of the inferior vena cava just above the right renal vein, cannulation of the inferior vena cava through the right atrium, and ligation of the hepatic artery. The liver was perfused in situ at 37°C using an infusion pump. The perfusate consisted of 20% washed bovine erythrocytes, 3% dextran, 2% bovine serum albumin (Fraction V), and 0.2% D-glucose in Krebs–Ringer bicarbonate buffer (pH, 7.4). The perfusion flow rate was 12 ml/min, and the input drug concentration was 1.458 μM of 9-AC. The outflow from the liver was collected within the last 10 min of each steady-state period (25–30 min). The mean outflow concentration in four consecutive 3-min samples was taken as the steady-state drug concentration.
The data analysis of liver perfusion was based on the flow rate and drug concentration. The extraction ratio was calculated using Eq. 3:
| (3) |
where Cin and Cout express input and outflow drug concentration in “plasma,” respectively.
The hepatic intrinsic clearance was calculated using Eq. 4:
| (4) |
where Q and E express hepatic blood flow rate and extraction ratio. fb,out is the ratio of unbound drug concentration in “plasma” to the whole “blood” drug concentration leaving the liver (25,26).
Hepatic availability (Fh) was calculated using Eq. 5:
| (5) |
where Q, fp, Rb, and CLh,int express the hepatic blood flow rate, unbound fraction in plasma, the blood-to-plasma concentration ratio, and the hepatic intrinsic clearance, respectively (21,25,26).
Lidocaine Extraction
Lidocaine (2-(diethylamino)-N-(2,6-dimethylphenyl) acetamide) extraction ratio across the liver was employed to measure the viability for the efficiency of hepatic metabolism (25,27). Lidocaine (4 mg) was first dissolved in 1 ml ethanol, and then diluted to 3.53 mg/l with perfusate. The perfusate containing 3.53 mg/l of lidocaine was constantly introduced into the liver at a flow rate of 10 ml/min. The outflow was collected at different time intervals and centrifuged. The “plasma” was stored at −80°C until analyzed by HPLC.
Pharmacokinetic Modeling
Pharmacokinetic parameters after intravenous (IV) injection of 9-AC were calculated using a two-compartment model (WinNonlin Standard Edition Version 2.1; Pharsight, Cary, NC) based on plasma concentration vs. time profiles. GraphPad Prism Version 4.02, (GraphPad Software, Inc., San Diego, CA) was used to calculate Pearson's correlation (r).
HPLC Analysis of 9-AC and Lidocaine
For 9-AC concentration determinations, all samples were acidified to convert 9-AC carboxylate to 9-AC lactone. The conversion of the carboxylate to lactone form is reversible and pH-dependent; the active lactone form predominates at acidic pH, and the inactive open-ring carboxylate form is favored at neutral and alkaline pH (28). Frozen plasma samples were thawed, mixed with 8.5% phosphoric acid and an internal standard, camptothecin (CPT) in DMSO, and kept at room temperature (r.t.) for 1 h. The mixture was loaded onto a preconditioned C18 solid-phase extraction cartridge (Waters, Milford, MA), washed with 2 ml DI water, and eluted with 0.3 ml methanol. The eluent was combined with 0.2 ml of 1% of phosphoric acid (to prevent lactone ring opening) and then filtered through a 0.45 μm nylon membrane filter before HPLC analysis.
Although 9-AC has a relatively poorer fluorescence compared to the parent compound CPT, acidification prior to analysis readily converts 9-AC to a fluorescent species. The 9-AC concentrations in all samples were determined using an HPLC-fluorescence assay based on a method developed by Takimoto et al. (29). Briefly, an acidic chromatographic mobile phase was used to enhance 9-AC fluorescence resulting in an increased sensitivity compared to post-column acidification methods. The sample was injected onto a C18 silica gel column (250 mm × 4.6 mm, 5 μm mean particle size Ultrasphere ODS, Beckman Instruments, San Ramon, CA) at r.t. The samples were eluted with a mobile phase consisting of methanol/KH2PO4 aqueous solution (25 mM; pH 2.55; 4/6, v/v) at a flow rate of 1.0 ml/min. The excitation and emission wavelengths for fluorescence detection were 365 and 440 nm, respectively.
Lidocaine in “plasma” was extracted by C18 column before HPLC analysis. The “plasma” sample (1 ml) was thawed, loaded onto a preconditioned C18 solid-phase extraction cartridge (Waters, Milford, MA) and eluted with 0.25 ml methanol. The eluent was combined with 0.25 ml of HPLC mobile phase solution and filtered through a 0.45 μm nylon membrane filter before HPLC analysis. After sample injection, lidocaine was separated by a C18 reserved-phase column with a mobile phase of 0.05 M KH2PO4-acetonitrile (86:14, v/v, pH 4.0) at a flow rate of 1 ml/min and r.t, and detected at 205 nm (30).
Statistical Analysis
The results were expressed as mean ± standard error. Pearson's method was used to determine statistical significance between observed and predicted data. The p < 0.05 was considered significant.
Results
Degradation and Absorption Rate Constant
Incubation of HPMA copolymer–9-AC conjugate with cecal contents (15 wt.% suspension) led to the cleavage of the aromatic azo bond in the side chains of the polymer conjugate and release of unmodified 9-AC. As shown in Fig. 2, 9-AC was continuously released from the conjugate over time and approximately 90% of 9-AC was released within the first 30 min of incubation. The degradation constant kdeg calculated for in vitro experimental conditions (diluted cecal contents) was 4.5±0.7 h−1. Consequently, the degradation rate constant for in vivo conditions (undiluted cecum contents) was estimated to be 4.5 × 100/15 = 30 h−1. This value was used in our model.
Fig. 2.
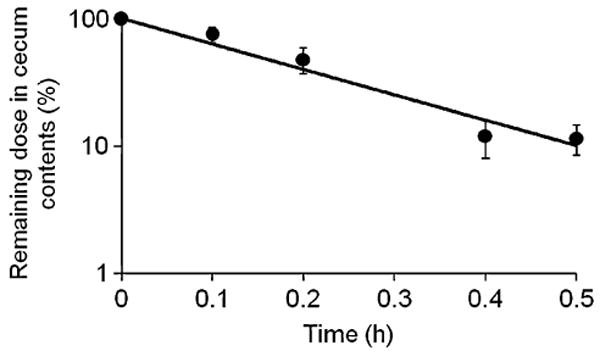
Degradation of HPMA copolymer–9-AC conjugate in rat cecal contents.
In the cecum, 9-AC was absorbed through the cecal wall and reached the systemic circulation. As a result of absorption, 9-AC concentrations in the cecum decreased over time (Fig. 3); the loss of 9-AC followed first-order kinetics. The absorption rate constant was estimated as 0.13±0.04 h−1, as calculated from the rate of 9-AC concentration decrease.
Fig. 3.
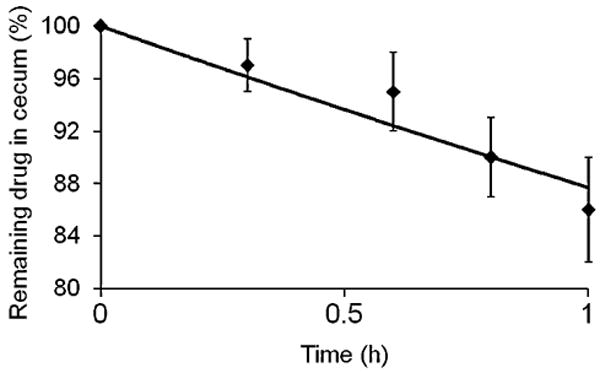
Absorption curve for the calculation of the absorption rate constant, ka. Remaining 9-AC concentration in the cecum during in situ absorption study.
Liver Metabolism and Availability
Previously, we reported the metabolism of 9-AC in liver of mice and identified one liver metabolite produced by hydroxylation of the amino group of 9-AC (14). To quantitatively determine the drug hepatic availability (Fh) in rats (n = 4), liver perfusion was performed. According to Eq. 5, parameters Q, fp, Rb and CLh,int are required to calculate Fh. CLh,int was calculated as 8.18±1.5 ml/min/liver based on Eq. 4, from a well-stirred model (25) using Q, E and fb,out from liver perfusion where Q = 12±0.3 ml/min, E = 0.12±0.02, and fb,out = 0.18±0.035. Therefore, Fh of 9-AC was obtained as 0.88±0.17 using Rb 0.84±0.15, fp 0.13±0.02 for rat blood, CLh,int 8.18±1.4 ml/min/liver, and assuming portal blood flow in rats as 9.8 ml/min (31).
Liver Viability
Lidocaine extraction ratios across the rat livers are presented in Fig. 4. When lidocaine (3.53 mg/l) was constantly perfused through rat liver, the hepatic extraction ratio reached a constant value (0.996) 7 min after perfusion initiation. Lidocaine is a highly extracted compound by liver when operating under linear conditions where input concentrations are less than 5 mg/l (25). Otherwise, a low extraction ratio accounts for an impaired liver metabolism in hypoxic conditions. Our experiments indicate that a high extraction ratio was achieved within a short period, and remained stable for at least 3 h. These observations suggest that rat livers were stable and viable during the period of liver perfusion.
Fig. 4.
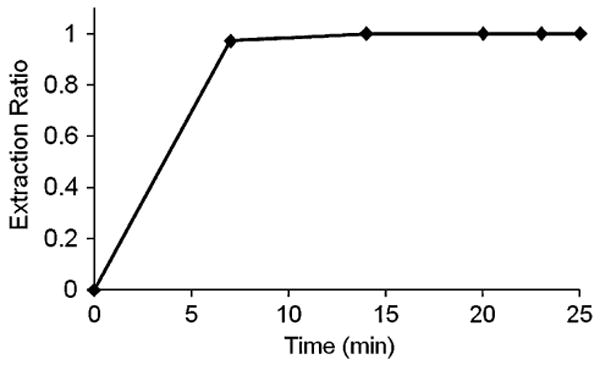
Lidocaine extraction ratio through rat liver at a constant-input lidocaine concentration of 3.53 mg/l and flow rate of 10 ml/min.
Cecum Metabolism and Availability
The free 9-AC absorbed through cecum may be metabolized via the cecal wall and liver before reaching systemic circulation. This first-pass elimination of 9-AC was estimated using an in-situ cecum absorption study. The availability (Fc,h) of 9-AC absorbed through cecum and liver was determined as 0.31±0.11 by F8h and , according to Eq. 1. The bioavailability (F8h) was calculated as 0.20±0.05 using AUC8h (248±61 nM·h) from drug absorption in the cecum at a dose of 1.1 mg/kg and AUC (1,102±200 nM·h) from IV injection (n = 6) at a dose of 1 mg/kg. The absorbed fraction of 9-AC was calculated as 0.63±0.14 based on the difference between the starting and remaining concentration in the cecum. It was reported that 9-AC was metabolized via the cecal wall after absorption from the cecum (14). The cecal availability (Fc) of 9-AC was calculated as 0.35±0.12 according to Eq. 2, using Fch and Fh obtained as above.
PK Parameters Estimated from Drug Concentration-time Profile after Intravenous Administration of 9-AC
A 2-compartment model was used to fit plasma drug concentration-time profile after IV bolus injection of 9-AC at a dose of 1 mg/kg. The associated model-predicted and observed drug concentrations are compared in Fig. 5. The model described the observed data well with Pearson's r2 = 0.97, p< 0.001. The plasma concentrations of 9-AC were expressed as Cp = 1855 exp(−3.12t) + 493 exp(−0.544t). The parameter values from this fitting were presented in Table I and applied as weight functions to predict the plasma concentration-time profiles of 9-AC released from the polymer conjugates.
Fig. 5.
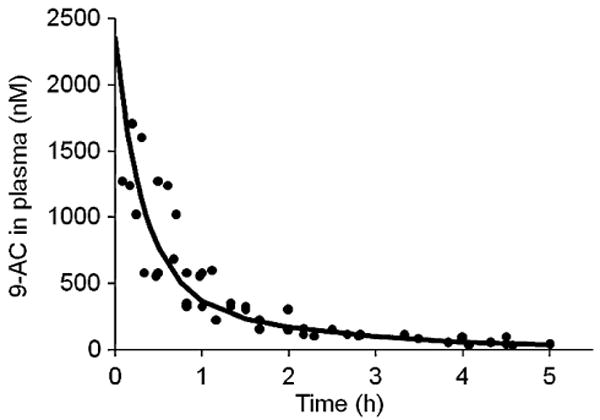
Observed (dots) and predicted (curve) 9-AC plasma concentration-time profiles after intravenous administration of 9-AC to rats.
Table I. Pharmacokinetics Parameters Estimated from Model Fitting of IV Injected 9-AC in Rats.
| Parameters | k12 (h−1) | k21 (h−1) | k10 (h−1) |
|---|---|---|---|
| Values | 1.02±0.52 | 1.09±0.76 | 1.56±0.35 |
Data represent mean values ± SE
Prediction of Plasma Drug Concentration-time Profile for Released 9-AC
Based on GI-transit and absorption of released 9-AC in the cecum, a multi-compartment model was developed to predict plasma concentrations of released 9-AC after oral administration of the polymer conjugate at a dose of 3 mg/kg of 9-AC equivalent. The model is depicted in Fig. 6. Based on our previous data, less than 3% of the HPMA copolymer-9-AC conjugate was degraded in the small intestine (SI). We assumed that 97% of the polymer conjugate reached the cecum (13,14). Orally administered polymer conjugate is transited from the stomach and SI into the cecum, where it is degraded to release free 9-AC. Released 9-AC is absorbed into the systemic circulation, and partly transited out of the cecum. The rate constants of GI-transit, absorption, and deposition were used as modeling parameters. The transit rate constants of the lower ileum, ktr,1 (0.46 h−1), and cecum, ktr,ce (0.00001 h−1), were obtained from literature for male Wistar rats (32). The average rate constants of degradation, kdeg (30 h−1) and absorption, ka (0.13 h−1), were determined by experiments described above. The rate constants for deposition, k12 (1.02 h−1), k21 (1.09 h−1), and k10 (1.56 h−1), were estimated from model fitting for IV injected 9-AC. The model-predicted and observed drug concentrations in plasma are presented in Fig. 7, where a lag time of 1.5 h, an estimate of minimal time needed for a drug to reach the cecum after oral dosing, was applied. The pharmacokinetic parameters for the HPMA copolymer 9-AC conjugate after oral administration are presented in Table II. As described in Fig. 7, using availability of 0.31 after first-pass elimination, this model successfully described the observed data with Pearson's r = 0.985, p < 0.001.
Fig. 6.
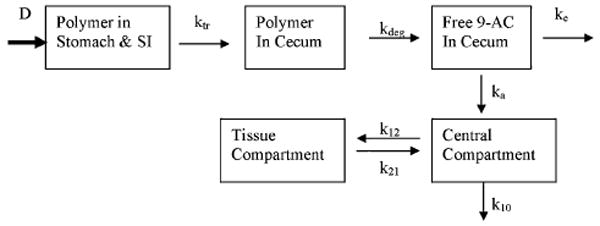
Pharmacokinetic model describing GI transit and absorption after oral administration of HPMA copolymer–9-AC conjugate.
Fig. 7.
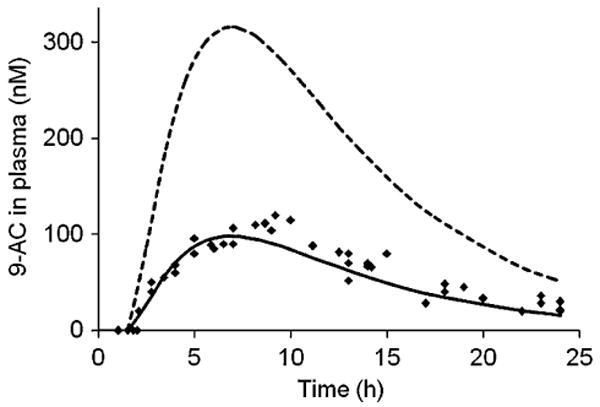
Model-predicted plasma concentration-time profile and observed data (dots) after oral administration of HPMA copolymer–9-AC conjugate to rats. Broken line represents predicted curve without metabolism, solid line represents predicted curve after metabolism.
Table II. Pharmacokinetic Parameters for 9-AC After Oral Administration of HPMA Copolymer 9-AC Conjugates at a Dose of 3 mg/kg of 9-AC Equivalent in Rats.
| Cmax (nM) | tmax (h) | AUC (nM·h) | MRT (h) | |
|---|---|---|---|---|
| Predicted | 98 | 7 | 1,235 | 11 |
| Observed | 114±11 | 8.6±0.45 | 1,386±157 | 11.2±0.43 |
Data represent mean values ± SE
Predicted Drug Transit in Stomach, Small Intestine, and Cecum
The profiles of remaining (undegraded) HPMA copolymer–9-AC conjugate in stomach, SI, and cecum, and released 9-AC in cecum after oral administration of the polymer conjugate, were predicted based on the GI-transit and drug absorption using the corresponding parameters. The predicted curves are shown in Fig. 8.
Fig. 8.
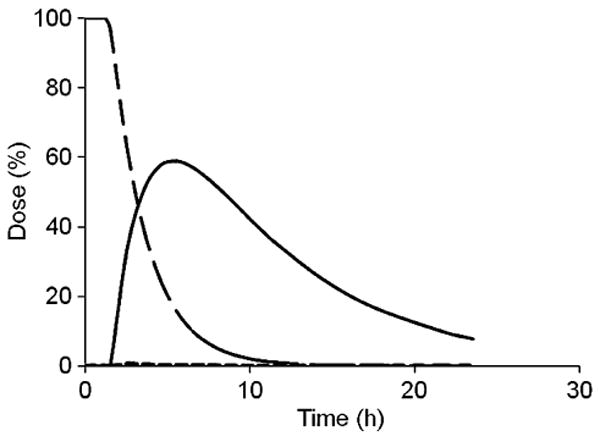
GI-transit dose-time profile for the HPMA copolymer–9AC conjugate and released 9-AC after oral administration of the conjugate to rats; solid line represents released 9-AC from the polymer conjugate in cecum; dashed line represents HPMA copolymer–9-AC-conjugate in stomach and SI; broken line represents HPMA copolymer–9-AC-conjugate in cecum.
Discussion
The colon is an attractive region for local therapy and drug absorption. Colon-specific drug release ensures an increased local drug concentration enabling direct tumor treatment and reduced systemic adverse effects. Colonic diseases range in severity from irritable bowel syndrome and inflammatory bowel disease (IBD), such as ulcerative colitis and Crohn's disease, to colon cancer. Compared with the stomach and small intestine, the colon contains lower levels of luminal and mucosal digestive enzymes (16,33,34). Molecules, such as peptides and proteins that are degraded in the harsh hydrolytic environment of the upper gut, can therefore be absorbed via the less proteolytically active colon (35). Moreover, colonic drug residence time is relatively long due to a decreased transit rate. These characteristics reduce systemic drug absorption from the colon and the associated adverse effects and improve local therapy due to longer drug exposure at the disease site.
There have been numerous attempts to use the above-described physiological rationale to design delivery systems for the colon-specific drug delivery. The enzymatic activity of colonic bacteria is one of the major targets in the tailor-made synthesis of low molecular weight as well as polymeric colon-specific prodrugs. Dexamethasone- and prednisolone-β-D-glucosides have been evaluated as prodrugs capable of releasing the active agent due to high glucosidase activity in the colon (36). Dextranase activity in the colon has been utilized for the release of naproxen from dextran carriers (37). Due to the high level of relevant enzymatic activity in the colon, natural polysaccharides are being used in the development of solid dosage forms for colon-specific delivery (38). The potential of the azoreductase activity for colon-specific drug delivery has been also evaluated (13,14,29,30,35,39). Prodrugs, e.g., 5-[4-(2-pyridylaminosulfonyl)phenylazo]-salicylic acid (29) and 5,5′-azodisalicylic acid (30) are used clinically. The use of water-soluble copolymers for the colon-specific oral delivery of 5-ASA has been proposed by Brown et al. (39), and crosslinked (branched) copolymers for the colonic delivery of proteins were introduced by Saffran et al. (35).
Targeted colon-specific drug delivery systems have been developed based on the observation that cancerous colonic tissue expresses altered glycoproteins. The Thomsen–Friedenreich (TF) antigen (galactose-β1,3-N-acetylgalactosamine) is masked in healthy tissue by oligosaccharide extension and/or sialylation. During colonic disease states (IBD or cancer) alterations in cell surface carbohydrate expression occur resulting in TF antigen exposure. Lectins, proteins that bind with specificity to carbohydrate moieties, may distinguish healthy and diseased tissue. Peanut agglutinin (PNA) was shown to bind well to the TF antigen and to diseased colon tissue both in free and HPMA copolymer-bound forms (40). Detailed evaluations of HPMA copolymer-lectin-drug conjugates indicates that they may improve safety and efficacy of therapy for IBD and Barrett's esophagus (40–43).
The HPMA copolymer–9-AC conjugate evaluated in this study (Fig. 1) contains an aromatic azo bond combined with a 1,6-elimination 4-aminobenzylcarbamate group. The synthetic chemistry used in the design of this delivery system permits for binding of lectins as targeting moieties (42). However, in this study we evaluated the nontargeted derivative. Due to the presence of the aromatic azo bond, it is colon specific, and cleavage experiments have verified conjugate stability in simulated upper GI tract conditions (13).
There have been several attempts to predict the absorption behavior of colon-specific prodrugs. Using the gastrointestinal-transit-absorption (GITA) model (44), Yokoe et al. correctly predicted the absorption behavior of salicylazosulfanilic acid, a prodrug of 5-ASA (21). We have previously evaluated the biodistribution and pharmacokinetics of the HPMA copolymer–9-AC conjugate in mice (14). Colon-specific release produced high local concentrations (14); which may result in enhanced therapeutic efficacy (45).
In this work a pharmacokinetic model (Fig. 6) was developed to quantitatively describe drug release and disposition in rats after oral administration of the colon-specific HPMA copolymer 9-AC conjugate (Fig. 1). Various pharmacokinetic parameters were applied to mathematically simulate the processes of drug transit, degradation, absorption, distribution, and elimination. The transit and elimination rate constants were assumed to be the same as those of phenol red, a non-absorbable marker, in male Wistar rats (32). The degradation and absorption rate constants were experimentally determined. As described previously (14), the degradation rate of the HPMA copolymer 9-AC conjugate was similar to that of small molecules, such as methyl orange. This finding was attributed to the fact that only one or two drugs were attached to a polymer chain, which facilitates side chain cleavage without formation of micelles (46). The fact that a similar degradation rate constant as for salicylazosulfanilic acid (SASA; 34.5 h−1) (21) was observed supports this conclusion. We assumed that the degradation rate was proportional to the amount of cecal contents in the incubation mixture. Therefore, the degradation rate constant for in vivo conditions was obtained by multiplying the in vitro degradation constant, obtained using diluted cecum contents (Fig. 2), with 6.7 (100/15). A similar approach was used by Yokoe et al. (21). The value of the absorption rate constant of 9-AC in the cecum was approximately two-fold higher than that of 5-ASA (0.061 h−1), because 9-AC is more lipophilic than 5-ASA, and may diffuse more easily across lipid bilayers. The distribution difference between the tissue compartment (peripheral compartment) and central compartment (systemic circulation) is reflected in the k12/k21 ratio. According to our experimental data, the k12/k21 ratio is almost equal to one, which means that the drug deposition in tissue compartment is the same as in the blood. In other words, no drug accumulation occurred in tissue compartment, because the elimination of the drug from the tissue compartment was equal to that of the central compartment.
Pharmacokinetic profiles were notably improved by the oral dosing of colon-specific HPMA copolymer 9-AC compared to free 9-AC (14). In the polymer group, the expected and observed release of 9-AC in rats were similar to those in mice. Previously, we reported that the Cmax was lower, and mean residence time (MRT) was longer in the polymer group in mice when compared to free drug group (14). The lower Cmax, attributed to a reduced absorption rate for released 9-AC in the cecum and slow transport into systemic circulation may provide a potential safety benefit, since high 9-AC plasma levels have been correlated with increased side effects in clinical trials (47). The prolonged MRT caused by a long absorption time in the cecum and a slower transit time may result in enhanced antitumor effects. These properties are particularly advantageous, since 9-AC has a cell cycle dependent mechanism.
Colon-specific drug delivery increased the local drug concentration in cecum. As shown in Fig. 8, the predicted amount of 9-AC released in the cecum increased gradually, reached a peak point at approximately 6 h after oral administration (about 60% of total oral dose released), and then decreased. Even 24 h after oral dosing, 7% of the total 9-AC dose was retained in the cecum. Because of the higher transit rate (0.46 h−1) from SI to cecum, higher degradation rate (30 h−1) compared to absorption rate (0.13 h−1); and, miniscule elimination rate (0.00001 h−1), released 9-AC accumulated in the cecum before reaching its peak concentration. When approaching the peak 9-AC concentration, almost all of the polymer conjugate had reached the cecum and degraded there. With no further conjugate supply, the (released) 9-AC in the cecum was absorbed and continuously eliminated, resulting in a gradual reduction in 9-AC concentration. These results agree well with our previous data (14), where we reported that in mice the released 9-AC concentration in cecal contents and tissues reached its peak point about 5 h after oral dosing. The mean peak concentrations of released 9-AC in cecal contents and tissues were, respectively, 3.2-fold and 2.2-fold higher than those from oral dosed free 9-AC. These data on site-specific drug accumulation are of importance for local therapy of GI diseases.
Following oral administration of HPMA copolymer 9-AC conjugate, the released 9-AC was metabolized by the cecum and liver prior to reaching the general circulation. The first-pass effects of released 9-AC were quantitatively determined by liver perfusion and in-situ absorption studies. The following assumptions were used to analyze liver metabolism. It was assumed that the liver is a single well-stirred compartment and that the concentration of unbound drug in the emergent blood is in equilibrium with the unbound drug within the liver. Additionally, due to assumed passive diffusion with rapid equilibrium, the concentrations of unbound drug in venous blood (COut,u) and in liver (CL,u) were considered equal. Furthermore, it was assumed that only unbound drug could traverse membranes, and the rate of drug elimination would be a function of the concentration of unbound drug. Based on the well-stirred model assumptions, the hepatic intrinsic clearance (CLh,int) was calculated at steady state of liver perfusion. The hepatic and cecal availabilities were calculated using experimentally determined CLh,int and assuming a rat portal blood flow of 9.8 ml/min. The hepatic extraction ratio was smaller than the fraction of unbound drugs, which was attributed to the liver's restrictive clearance allowing only unbound drug to be metabolized at the site of oxidative enzymes and exclusion of protein-bound drug, which does not diffuse through cell membranes of hepatocytes (48,49).
The pharmacokinetic model developed here may both quantitate drug disposition in animals, and additionally predict drug concentrations in humans. Drug disposition information in the colon and systemic circulation are important for understanding not only drug transport, but elucidation of pharmacokinetic-pharmacodynamic relationships that might aid in drug development process. This pharmacokinetic model may provide an assessment of drug exposure in colon tumors where the local drug concentration is most relevant to therapy. By setting a minimum effective 9-AC concentration in colon tumors, in this case 10 nM of 9-AC in active lactone form, the duration of effective tumor concentration can be determined after a single dose. A reliance on pharmacokinetic properties in colon tumors, and preferably, colon tumor-based pharmacokinetic–pharmacodynamic relationships should provide rational means to select the most efficacious drug-dosing regimen. This pharmacokinetic model established for 9-AC disposition in rats can be scaled to predict drug concentrations in humans to aid drug development process and to foster the rational design of drug administration regimens in humans. The human scaling procedure can be accomplished by substitution of a human forcing function that describes the plasma drug concentration-time profile, or by using the human GI transit data monitored by a gamma scintigraphic technique. It has been reported for three drugs, carboplatin, topotecan, and temozolomide, that the hybrid models, originally derived from preclinical data and then scaled to humans, agreed well with the observed data through the use of human forcing functions (50).
Conclusions
A pharmacokinetic model was developed to predict drug absorption behavior after oral administration of colon-specific HPMA copolymer–9-AC conjugate in rats. This model delineated the impact of GI transit, drug absorption rates, and first-pass metabolism via the cecum and liver on drug disposition. Colon-specific drug release from the polymer conjugate with slow colon transit may prolong colonic tumor exposure to high local drug concentrations, which may enhance antitumor efficacy and substantially reduce systemic toxicity. By quantitating drug disposition in the colon and systemic circulation, this modeling strategy can be used to select drug-dosing regimens for optimal therapeutic responses in both preclinical antitumor efficacy studies and in clinical trials.
Acknowledgments
The research was supported in part by NIH grants GM50839 and CA51578. 9-Aminocamptothecin was kindly provided by National Cancer Institute, Division of Cancer Treatment and Diagnosis.
References
- 1.Champoux JJ. Mechanism of the reaction catalyzed by the DNA untwisting enzyme: attachment of the enzyme to 3′-terminus of the nicked DNA. J Mol Biol. 1978;118:441–446. doi: 10.1016/0022-2836(78)90238-3. [DOI] [PubMed] [Google Scholar]
- 2.Hsiang YH, Liu LF. Identification of mammalian DNA topoisomerase I as an intracellular target of the anticancer drug camptothecin. Cancer Res. 1988;48:1722–1726. [PubMed] [Google Scholar]
- 3.Tsao YP, Russo A, Nyamuswa G, Silber R, Liu LF. Interaction between replication forks and topoisomerase I-DNA cleavable complexes: studies in a cell-free SV40 DNA replication system. Cancer Res. 1993;53:5908–5914. [PubMed] [Google Scholar]
- 4.Tsao YP, D'Arpa P, Liu LF. The involvement of active DNA synthesis in camptothecin-induced G2 arrest: altered regulation of p34cdc2/cyclin B. Cancer Res. 1992;52:1823–1829. [PubMed] [Google Scholar]
- 5.Gerrits CJ, de Jonge MJ, Schellens JH, Stoter G, Verweij J. Topoisomerase I inhibitors: the relevance of prolonged exposure for present clinical development. Brit J Cancer. 1997;76:952–962. doi: 10.1038/bjc.1997.491. [DOI] [PMC free article] [PubMed] [Google Scholar]
- 6.Pantazis P, Hinz HR, Mendoza JT, Kozielski AJ, Williams LJ, Stehlin JS, Giovanella BC. Complete inhibition of growth followed by death of human malignant melanoma cells in vitro and regression of human melanoma xenografts in immunodeficient mice induced by camptothecins. Cancer Res. 1992;52:3980–3987. [PubMed] [Google Scholar]
- 7.Pantazis P, Kozielski AJ, Mendoza JT, Early JA, Hinz HR, Giovanella BC. Camptothecin derivatives induce regression of human ovarian carcinomas grown in nude mice and distinguish between non-tumorigenic and tumorigenic cells in vitro. Int J Cancer. 1993;53:863–871. doi: 10.1002/ijc.2910530526. [DOI] [PubMed] [Google Scholar]
- 8.McLeod HL, Douglas F, Oates M, Symonds RP, Prakash D, van der Zee AG, Kaye SB, Brown R, Keith WN. Topoisomerase I and II activity in human breast, cervix, lung and colon cancer. Int J Cancer. 1994;59:607–611. doi: 10.1002/ijc.2910590506. [DOI] [PubMed] [Google Scholar]
- 9.Giovanella BC, Stehlin JS, Wall ME, Wani MC, Nicholas AW, Liu LF, Silber R, Potmesil M. DNA topoisomerase I-targeted chemotherapy of human colon cancer in xenografts. Science. 1989;246:1046–1048. doi: 10.1126/science.2555920. [DOI] [PubMed] [Google Scholar]
- 10.Takimoto CH. Why drugs fail: of mice and men revisited. Clin Cancer Res. 2001;7:229–230. [PubMed] [Google Scholar]
- 11.Kirstein MN, Houghton PJ, Cheshire PJ, Richmond LB, Smith AK, Hanna SK, Stewart CF. Relation between 9-aminocamptothecin systemic exposure and tumor response in human solid tumor xenografts. Clin Cancer Res. 2001;7:358–366. [PubMed] [Google Scholar]
- 12.Erickson-Miller CL, May RD, Tomaszewski J, Osborn B, Murphy MJ, Page JG, Parchment RE. Differential toxicity of camptothecin, topotecan and 9-aminocamptothecin to human, canine, and murine myeloid progenitors (CFU-GM) in vitro. Cancer Chemother Pharmacol. 1997;39:467–472. doi: 10.1007/s002800050600. [DOI] [PubMed] [Google Scholar]
- 13.Gao SQ, Lu ZR, Petri B, Kopečková P, Kopeček J. Colon-specific 9-aminocamptothecin-HPMA copolymer conjugates containing a 1,6-elimination spacer. J Control Release. 2006;110:323–331. doi: 10.1016/j.jconrel.2005.10.004. [DOI] [PubMed] [Google Scholar]
- 14.Gao SQ, Lu ZR, Kopečková P, Kopeček J. Biodistribution and pharmacokinetics of colon-specific HPMA copolymer-9-aminocamptothecin conjugate in mice. J Control Release. 2007;117:179–185. doi: 10.1016/j.jconrel.2006.10.024. [DOI] [PMC free article] [PubMed] [Google Scholar]
- 15.Haupt S, Rubinstein A. The colon as a possible target for orally administered peptide and protein drugs. Crit Rev Ther Drug Carrier Syst. 2002;19:499–551. doi: 10.1615/critrevtherdrugcarriersyst.v19.i6.10. [DOI] [PubMed] [Google Scholar]
- 16.Sakuma S, Lu ZR, Kopečková P, Kopeček J. Biorecognizable HPMA copolymer-drug conjugates for colon-specific delivery of 9-aminocamptothecin. J Control Release. 2001;75:365–379. doi: 10.1016/s0168-3659(01)00405-9. [DOI] [PubMed] [Google Scholar]
- 17.Kopečková P, Rathi R, Takada S, Říhová B, Berenson MM, Kopeček J. Bioadhesive N-(2-hydroxypropyl)methacrylamide copolymers for colon-specific drug delivery. J Control Release. 1994;28:211–222. [Google Scholar]
- 18.Kakemi K, Sezaki H, Konishi R, Kimura T, Okita A. Effect of bile salts on the gastrointestinal absorption of drugs. II. Mechanism of the enhancement of the intestinal absorption of sulfaguanidine by bile salts. Chem Pharm Bull. 1970;18:1034–1039. doi: 10.1248/cpb.18.1034. [DOI] [PubMed] [Google Scholar]
- 19.Schanker LS, Shore PA, Brodie BB, Hogben CA. Absorption of drugs from the stomach. I. The rat. J Pharmacol Exp Ther. 1957;120:528–539. [PubMed] [Google Scholar]
- 20.Mani S, Iyer L, Janisch L, Wang X, Fleming GF, Schilsky RL, Ratain MJ. Phase I clinical and pharmacokinetic study of oral 9-aminocamptothecin (NSC-603071) Cancer Chemother Pharmacol. 1998;42:84–87. doi: 10.1007/s002800050789. [DOI] [PubMed] [Google Scholar]
- 21.Yokoe J, Iwasaki N, Haruta S, Kadono K, Ogawara K, Higaki K, Kimura T. Analysis and prediction of absorption behavior of colon-targeted prodrug in rats by GI-transit-absorption model. J Control Release. 2003;86:305–313. doi: 10.1016/s0168-3659(02)00424-8. [DOI] [PubMed] [Google Scholar]
- 22.Kimura T, Iwasaki N, Yokoe JI, Haruta S, Yokoo Y, Ogawara KI, Hidaki K. Analysis and prediction of absorption profile including hepatic first-pass metabolism of N-methyltyramine, a potent stimulant of gastrin release present in beer, after oral ingestion in rats by gastrointestinal-transit-absorption model. Drug Metab Dispos. 2000;28:577–581. [PubMed] [Google Scholar]
- 23.Terris S, Steiner DF. Retention and degradation of 125I-insulin by perfused livers from diabetic rats. J Clin Inv. 1976;57:885–896. doi: 10.1172/JCI108365. [DOI] [PMC free article] [PubMed] [Google Scholar]
- 24.Higaki K, Nakano M. Stereoselective disposition of S-8666, a novel uricosuric antihypertensive diuretic, and its N-monodemethylated metabolite in a perfused rat liver preparation. Effect of protein binding on the kinetics of S-8666. Drug Metabol Disp. 1992;20:350–355. [PubMed] [Google Scholar]
- 25.Pang KS, Rowland M. Hepatic clearance of drugs. I. Theoretical considerations of a “well-stirred” model and a “parallel tube” model. Influence of hepatic blood flow, plasma and blood cell binding, and the hepatocellular enzymatic activity on hepatic drug clearance. J Pharmacokin Biopharm. 1977;5:625–653. doi: 10.1007/BF01059688. [DOI] [PubMed] [Google Scholar]
- 26.Pang KS, Rowland M. Hepatic clearance of drugs. II. Experimental evidence for acceptance of the “well-stirred” model over the “parallel tube” model using lidocaine in the perfused rat liver in situ preparation. J Pharmacokin Biopharm. 1977;5:655–680. doi: 10.1007/BF01059689. [DOI] [PubMed] [Google Scholar]
- 27.Cheung K, Hickman PE, Potter JM, Walker NI, Jericho M, Haslam R, Roberts MS. An optimized model for rat liver perfusion studies. J Surg Res. 1966;66:81–89. doi: 10.1006/jsre.1996.0376. [DOI] [PubMed] [Google Scholar]
- 28.Fassberg J, Stella VJ. A kinetic and mechanistic study of the hydrolysis of camptothecin and some analogues. J Pharm Sci. 1992;81:676–684. doi: 10.1002/jps.2600810718. [DOI] [PubMed] [Google Scholar]
- 29.Takimoto CH, Klecker RW, Dahut WL, Yee LK, Strong JM, Allegra CJ, Grem JL. Analysis of the active lactone form of 9-aminocamptothecin in plasma using solid-phase extraction and high-performance liquid chromatography. J Chromatogr B Biomed Appl. 1994;655:97–104. doi: 10.1016/0378-4347(94)00051-4. [DOI] [PubMed] [Google Scholar]
- 30.Nagashima A, Tanaka E, Inomata S, Honda K, Misawa S. A study of the in vitro interaction between lidocaine and premedications using human liver microsomes. J Clin Pharm Ther. 2005;30:185–188. doi: 10.1111/j.1365-2710.2004.00617.x. [DOI] [PubMed] [Google Scholar]
- 31.Davies B, Morris T. Physiological parameters in laboratory animals and humans. Pharm Res. 1993;10:1093–1095. doi: 10.1023/a:1018943613122. [DOI] [PubMed] [Google Scholar]
- 32.Sawamoto T, Haruta S, Kurosaki Y, Higaki K, Kimura T. Prediction of the plasma concentration profiles of orally administered drugs in rats on the basis of gastrointestinal transit kinetics and absorbability. J Pharm Pharmacol. 1997;49:450–457. doi: 10.1111/j.2042-7158.1997.tb06823.x. [DOI] [PubMed] [Google Scholar]
- 33.Rubinstein A. Approaches and opportunities in colon-specific drug delivery. Crit Rev Ther Drug Carrier Syst. 1995;12:101–149. doi: 10.1615/critrevtherdrugcarriersyst.v12.i2-3.10. [DOI] [PubMed] [Google Scholar]
- 34.Ikesue K, Kopečková P, Kopeček J. Degradation of proteins by guinea pig intestinal enzymes. Int J Pharm. 1993;95:171–179. [Google Scholar]
- 35.Saffran M, Kumar GS, Savariar C, Burnham JC, Williams F, Neckers DC. A new approach to the oral administration of insulin and other peptide drugs. Science. 1986;233:1081–1084. doi: 10.1126/science.3526553. [DOI] [PubMed] [Google Scholar]
- 36.Friend DR, Phillips S, Tozer TN. Colon-specific drug delivery from a glucoside in the guinea pig. Efficacy study. J Control Release. 1991;15:47–54. [Google Scholar]
- 37.Larsen C, Harboe E, Johansen M, Oleson HP. Macromolecular prodrugs. XV. Colon-targeted delivery—comparison of the rate of release of naproxen from dextran ester prodrugs in homogenates of various segments of the pig gastrointestinal tract. Pharm Res. 1989;6:995–999. doi: 10.1023/a:1015914101233. [DOI] [PubMed] [Google Scholar]
- 38.Minko T. Drug targeting to the colon with lectins and neoglycoconjugates. Adv Drug Delivery Rev. 2004;56:491–509. doi: 10.1016/j.addr.2003.10.017. [DOI] [PubMed] [Google Scholar]
- 39.Brown JP, McGarraugh GV, Parkinson TM, Wingard RE, Jr, Oderdonk AB. A polymeric drug for treatment of inflammatory bowel disease. J Med Chem. 1983;26:1300–1307. doi: 10.1021/jm00363a015. [DOI] [PubMed] [Google Scholar]
- 40.Wróblewski S, Berenson M, Kopečková P, Kopeček J. Biorecognition of HPMA copolymer–lectin conjugates as an indicator of differentiation of cell-surface glycoproteins in development, maturation, and diseases of human and rodent gastrointestinal tract. J Biomed Mater Res. 2000;51:329–342. doi: 10.1002/1097-4636(20000905)51:3<329::aid-jbm6>3.0.co;2-0. [DOI] [PubMed] [Google Scholar]
- 41.Wróblewski S, Kopečková P, Říhová B, Kopeček J. Lectin–HPMA copolymer conjugates: potential oral drug carriers for targeting diseased tissues. Macromol Chem Phys. 1998;199:2601–2608. [Google Scholar]
- 42.Lu ZR, Gao S, Kopečková P, Kopeček J. Synthesis of bioadhesive lectin–HPMA copolymer–cyclosporin conjugates. Bioconjugate Chem. 2000;11:3–7. doi: 10.1021/bc990098a. [DOI] [PubMed] [Google Scholar]
- 43.Wróblewski S, Říhová B, Rossmann P, Hudcovicz T, Řeháková Z, Kopečková P, Říhová B, Kopeček J. The influence of colonic microbiota on HPMA copolymer–lectin conjugates binding in rodent intestine. J Drug Targeting. 2001;9:85–94. doi: 10.3109/10611860108997920. [DOI] [PubMed] [Google Scholar]
- 44.Kimura T, Higaki K. Gastrointestinal transit and drug absorption. Biol Pharm Bull. 2002;25:149–164. doi: 10.1248/bpb.25.149. [DOI] [PubMed] [Google Scholar]
- 45.Haupt S, Zioni T, Gati I, Kleinstern J, Rubinstein A. Luminal delivery and dosing consideration to colorectal cancer. Eur J Pharm Sci. 2006;28:204–211. doi: 10.1016/j.ejps.2006.02.001. [DOI] [PubMed] [Google Scholar]
- 46.Chirico G, Collini M, Olivini F, Zamai M, Frigerio E, Caiolfa VR. Aggregation properties of a HPMA-camptothecin copolymer in isotonic solutions. Biophys Chem. 2004;110:281–295. doi: 10.1016/j.bpc.2004.03.004. [DOI] [PubMed] [Google Scholar]
- 47.Gupta E, Vyas V, Ahmed F, Sinko P, Cook T, Rubin E. Pharmacokinetics of orally administered camptothecins. Ann New York Acad Sci. 2000;922:195–204. doi: 10.1111/j.1749-6632.2000.tb07038.x. [DOI] [PubMed] [Google Scholar]
- 48.Gillette JR. Overview of drug-protein binding. Ann New York Acad Sci. 1973;226:6–17. doi: 10.1111/j.1749-6632.1973.tb20464.x. [DOI] [PubMed] [Google Scholar]
- 49.Shargel L, Yu A. Appl Biopharm Pharmacokin. McGraw-Hill: 1999. pp. 383–393. [Google Scholar]
- 50.Gallo JM, Vicini P, Orlansky A, Li S, Zhou F, Ma J, Pulfer S, Bookman MA, Guo P. Pharmacokinetic model-predicted anticancer drug concentrations in human tumors. Clin Cancer Res. 2004;10:8048–8058. doi: 10.1158/1078-0432.CCR-04-0822. [DOI] [PubMed] [Google Scholar]