

Abstract
Improvements to current small animal PET scanners can be made by improving the sensitivity and the spatial resolution of the scanner. In the past, efforts have been made to minimize the crystal dimensions in the axial and transaxial directions to improve the spatial resolution and to increase the crystal length to improve the sensitivity of the scanner. We have designed tapered PET detectors with the purpose of reducing the gaps between detector modules and optimizing the sensitivity of a future generation small animal PET scanner. In this work, we investigate spatial resolution and sensitivity of a scanner based on tapered detector elements using Monte Carlo simulations. For tapered detector elements more scintillation material is used per detector resulting in a higher sensitivity of the scanner. However, since the detector elements are not uniform in size, degradation in spatial resolution is also expected. To investigate characteristics of tapered PET detectors the spatial resolution and sensitivity of a one-ring scanner were simulated for a system based on traditional cuboid detectors and a scanner based on tapered detectors. Additionally, the effect of depth of interaction (DOI) resolution on the spatial resolution for the traditional and tapered detectors was evaluated.
All simulations were performed using the Monte Carlo simulation package GATE. Using the tapered arrays a 64 % improvement in the sensitivity across the field of view was found compared with traditional detectors for the same ring diameter. The level of DOI encoding was found to be the dominating factor in determining the radial spatial resolution and not the detector shape. For all levels of DOI encoding, no significant difference was found for the spatial resolution when comparing the tapered and the cuboid detectors. Detectors employing the tapered crystal design along with excellent DOI resolution will lead to PET scanners with higher sensitivity and uniform spatial resolution across the field of view.
1. INTRODUCTION
For small animal PET, like human imaging, improving the sensitivity of the PET scanner may allow for the duration of the scan to decrease or the injected amount of radionuclide to be reduced without sacrificing image quality. When the same subject is used for multiple studies, minimizing the injected activity is particularly important. Previous studies have shown that the average whole body dose to a mouse is in the range of 6–17 cGy for an imaging study using 9.6 MBq of 18FDG (Funk et al., 2004). In addition to the dose to the organs, the tumour was found to receive a dose of 22.3 cGy for an imaging study using 7.4 MBq of 18FDG (Taschereau and Chatziioannou, 2007).
For a given detector material, the sensitivity of a scanner may be increased by using longer detector elements, by increasing the amount of material in which the 511 keV photons may interact, or by increasing the solid angle coverage by decreasing the ring diameter. With increasing crystal length and a decreasing detector ring diameter parallax errors will be larger, resulting in the degradation of spatial resolution away from the center of the field of view. One way to correct for this parallax error without compromising sensitivity of the scanner is to use depth of interaction (DOI) encoding detectors. Previous experiments have shown that continuous DOI resolution of 2 mm or better can be achieved using dual ended read out detectors, in which the array of scintillation crystals are read out by a position sensitive avalanche photodiode (PSAPD) at the front and back ends of the detectors (Yang et al., 2006). The depth of interaction is determined by taking the ratio of the signals from the two PSAPDs, and a continuous measure of depth of interaction is determined for each recorded event. Other groups have focused on phoswich DOI detectors (Saoudi et al., 1999; Tsuda et al., 2004; Ziemons et al., 2005) or discrete DOI detectors with offset crystals (Zhang et al., 2002).
In addition, the sensitivity of the scanner may be increased by decreasing the gaps between the detectors in the ring geometry. In small diameter animal scanners, based on a ring geometry, these gaps can be a significant factor in limiting the sensitivity. Other groups have explored, through simulation, novel system geometries that reduce the gaps between detector blocks (Habte et al., 2007). Another way to improve the sensitivity of the scanner through minimizing crystal gaps may be to move towards monolithic detectors (van der Laan et al., 2007; Maas et al., 2009), however all such detectors to date have been cuboid in shape and thus have not eliminated the large gaps between detector modules, only the smaller gaps due to reflector material between individual detector elements in an array.
In the past, efforts have been made to decrease the scintillation crystal element size in the axial and transaxial directions to improve the spatial resolution of the scanner (Stickel et al., 2007). This is not without its challenges, as common scintillator crystals are brittle and often difficult to cut. Other detector designs may be employed to improve spatial resolution. One example is the use of semiconductor detectors that may be finely pixelated or read out in strips. Recently, both human (Shiga et al., 2009) and small animal (Cesca et al., 2007; Ishii et al., 2007) PET scanners using semiconductor detectors have been introduced. However, semiconductor detectors do not have the same potential to improve the sensitivity of the scanner because of the low stopping power of materials such as CdTe compared with common PET scintillators like LSO and BGO.
In this work we take a different approach and propose the use of LSO scintillator arrays in which each element, instead of being cuboid, is tapered in the transverse direction. The resulting scintillator array is wedge-shaped, allowing tight packing of detector modules in a ring geometry. Because the PSAPDs used in our prior work (Shah et al., 2004) can be manufactured in any desired size, it will still be possible to read out these arrays at both ends for DOI encoding. By significantly reducing the gaps between detector modules, we hypothesize that there will be a large increase in system sensitivity with this design. We also hypothesize that although the detector elements are tapered, leading to some loss of spatial resolution for events occurring towards the back of the detector, that this effect will be negligible for a realistic field of view and DOI resolution. The aim of this work therefore is to characterize through Monte Carlo simulation the sensitivity and spatial resolution of a small animal PET scanner based on tapered depth of interaction (DOI) detectors and compare the results to a scanner based on traditional cuboid detectors. The small inner ring diameter (60 mm) proposed presents the possibility that these scanner designs may be employed in a future generation PET-MR insert or as a stand-alone small animal PET scanner.
2. MATERIALS AND METHODS
2.1 Monte Carlo Simulation of the Evaluated Scanner Geometries
All of the simulations were performed using GATE (Jan et al., 2004), a Monte Carlo simulation package based upon the well validated, multipurpose Monte Carlo package Geant4.
The simulated small animal PET scanner has an inner diameter of 6 cm and an outer diameter of 10 cm, and is composed of 20 detectors in a ring. This is a design that could be used for a small animal PET scanner or as a PET insert for a small animal MRI scanner. The two simulated scanners are shown in Figure 1, illustrating the tapered geometry of the novel PET detectors compared with the traditional cuboid detectors used to date.
Figure 1.

Left: Scanner based on cuboid LSO elements. Right: Scanner based on tapered LSO elements.
The simulated detectors are based on continuous depth of interaction (DOI) detectors developed in our laboratory that are read out at both ends of the crystal array by position sensitive avalanche photodiodes (PSAPDs) (Yang et al., 2006; Yang et al., 2008). The depth of interaction is determined by the ratio of the summed signals from the two PSAPDs. The traditional cuboid detector simulated was a 14 X 14 array of 0.5 X 0.5 X 20 mm3 LSO crystals with a crystal pitch of 0.57 mm allowing for reflectors between the individual crystals. This traditional detector design is similar to detectors that have been previously characterized experimentally (St. James et al., 2009). The novel detectors had a 14 X 14 array of crystals, with the crystal elements uniform in the axial direction and tapered in the transaxial dimension. The crystal pitch and crystal dimensions at the entrance face of the detector were identical for the traditional and tapered arrays. The dimension of the crystals at the far end of the tapered arrays in the simulation studies was set to 0.5 X 0.875 mm2 with the pitch being 0.57 mm in the axial direction and 0.945 mm in the transverse direction. The angle of taper was chosen to reduce the gaps as much as possible while still accounting for the small dead space (1 mm) surrounding the PSAPD photodetectors. Though this is a simulation study, tapered arrays have been manufactured to ensure that it is possible to fabricate LSO arrays in this geometry. These arrays are currently being evaluated in our lab. A photograph of a tapered array of LSO crystals next to a cuboid array of LSO crystals is shown in Figure 2, along with an illustration of the crystal dimensions. The tapered arrays are easily manufactured using minor modifications to the technology used for fabricating cuboid arrays (Stickel et al., 2007).
Figure 2.

A photograph of a tapered LSO array next to a cuboid LSO array (left) and an illustration of the dimensions of the simulated tapered LSO array.
2.2 Sensitivity of the Scanner
A point source with activity 1.11 MBq was simulated in the center of the field of view (FOV) emitting mono-energetic back-to-back 511 keV photons. In the simulation, the coincidence window was set to 20 ns, the energy resolution was set to 25 % and the energy window was 250 keV– 650 keV. The simulated energy resolution was based on the reported energy resolution for similar detectors (St. James et al., 2009; Yang et al., 2008). The timing window was chosen to be twice the reported timing resolution of similar detectors (Yang et al., 2008), with the PSAPDs being the dominating factor in the timing resolution of these detectors (Wu et al., 2009). The sensitivity was taken to be the percentage of total events that were recorded as coincidence events. The duration of the simulation was 15 seconds, resulting in more than 16 million simulated back-to-back photon pairs. To compare the simulated sensitivity results to that of a known scanner the same simulation was performed for the microPET II scanner (Tai et al., 2003). The reported sensitivity of microPET II is 2.3 % at the center of the field of view for a 10 ns timing window and a lower level discriminator setting of 250 keV.
The sensitivity across the field of view was evaluated by simulating a line source extending from a radial offset of −16 mm to a radial offset of + 16 mm - the approximate width of a mouse. The integrated sensitivity (weighted by radial offset) was then computed for the two simulated scanners to evaluate the sensitivity gain over the entire field of view.
Additionally, to evaluate the effect of scatter, the sensitivity for the scanner designs was also evaluated at the center of the field of view for varying lower level discriminator (LLD) settings from 250 keV to 425 keV in increments of 25 keV.
2.3 Spatial Resolution
A small (1 μm) point source emitting mono-energetic back-to-back 511 keV photons with activity 1.11 MBq was simulated for 15 seconds, resulting in more than 16 million simulated pairs of back-to-back 511 keV photons. These simulations were repeated, varying the radial offset of the point source to demonstrate the spatial resolution at different locations across the field of view.
From the simulations, the center of mass location of the interaction of the annihilation photons in the scintillator detector was recorded. To model the effect of finite depth of interaction (DOI) resolution, the depth of interaction of the events was blurred by adding a Gaussian random variable to the depth of interaction. The use of a Gaussian function is justified based on measurements of DOI distributions from experimental detectors (St. James et al., 2009; Yang et al., 2006). For an actual depth of interaction Z in the crystal, the blurred depth Z″ is given by:
| (1) |
where ΔZ is taken from a normal distribution of mean 0 and standard deviation σ, where
| (2) |
The resulting estimated depth in the detector, Z′, is limited to the physical length of the scintillation crystals (20 mm), thus events that after DOI blurring would be located outside of the crystal, are placed at 0 or 20 mm depth as appropriate. For the tapered arrays, the crystals are not perpendicular to the face of the detector. The DOI blurring was performed along the individual crystal axes accounting for the crystal orientations. The physical scintillator arrays are not continuous detectors, and the location of interaction in a physical detector can only be localized to the crystal element in which the interaction occurred. To model the discrete nature of the crystal elements, yet also produce lines of response with relatively uniform efficiencies, the events were randomly positioned across the transverse width of the crystal. To improve the quality of the sinograms, a bootstrapping method was used whereby this random blurring of the position of interaction with respect to the crystal length and width was repeated 10 times per event. Sinograms were created using the blurred positions of the coincident events in the detectors for DOI resolutions of 10 mm, 5 mm, 2 mm and 1 mm. Events were binned into 300 angles and 1400 radial positions, with a radial sampling distance of 0.04 mm.
Normalization sinograms were created by simulating more than 5 million detected events for the scanners based on tapered and cuboid scintillator arrays. The source for the normalization sinograms was a non-attenuating cylinder of diameter 5.0 cm, emitting back-to-back 511 keV photons. A path-length correction was applied to account for the differences in the intersection of a line of response with the cylinder. Normalization sinograms were formed for each DOI resolution by binning the data according to the DOI resolution, in the same manner described above. To ensure that no significant additional noise is added to the sinograms through the normalization process, it is desirable to simulate many more events for the normalization sinograms than for the emission sinograms. To increase counting statistics, we used twenty-fold rotational symmetry arguments to give a total of ~100 million detected events in the normalization sinograms. All of the sinograms were normalized by dividing the raw sinogram by the normalization sinogram and the images were then reconstructed using filtered backprojection (FBP) with a Shepp-Logan filter with a frequency cutoff at the Nyquist frequency. The spatial resolution was taken to be the full-width at half maximum (FWHM) of the profile of the point source, following the NEMA protocol for small animal PET scanners (NEMA, 2008). The tangential and radial spatial resolutions were calculated from the reconstructed images. The error on the FWHM measurement was taken to be a measurement error of one pixel (0.04 mm). The average reconstructed resolution across a mouse-sized field of view (32 mm diameter) was also computed.
3. RESULTS
3.1 Sensitivity of the Scanner
The sensitivity at the center of the field of view for the scanner with the cuboid arrays was found to be 3.0 %. For the scanner based on the tapered arrays, the sensitivity at the center of the field of view was found to be 4.2 %. Both of these values are for lower level discriminator settings of 250 keV. The simulated sensitivity of the microPET II scanner was 2.2 %, comparable with the experimentally measured value of 2.3 %. This suggests that the simulations are a good guide to the sensitivity that would be realized in a real scanner.
When varying the lower level discriminator settings, the sensitivity of the scanner based on the tapered arrays was always greater than for the scanner based on cuboid detector arrays. This is shown in Figure 3. The sensitivity profiles across the field of view are shown in Figure 4. The comparison of the sensitivity profiles shows that the sensitivity of the scanner based on tapered arrays is greater than the sensitivity of the scanner based on cuboid arrays, across the entire field of view. Additionally, it shows that for the scanner based on cuboid scintillator arrays the sensitivity at the center of the field of view is peaked. At the center of the field of view of the scanner with the cuboid detectors, all of the gaps between the scintillators align and the maximum number of back-to-back photon pairs will be detected. For a solid detector ring (annulus) the sensitivity profile across the field of view would be a cusp with the maximum number of photon pairs detected being for sources at the periphery of the field of view. The estimated sensitivity profile for the scanner based on the tapered arrays is closer to the ideal case of the solid annulus of scintillator material. The true gain in sensitivity achieved by developing scanners with tapered arrays is greater than a sensitivity comparison made solely at the center of the field of view would suggest. Integrating across the entire field of view, a sensitivity gain of 64 % is achieved with tapered arrays for the same axial field of view and ring diameter.
Figure 3.

The sensitivity of both scanner designs as a function of changing lower level discriminator settings.
Figure 4.

The number of coincidence counts for a line source positioned across the transverse field of view.
3.2 Spatial Resolution
The spatial resolution for the two scanner designs, across the field of view and for varying DOI resolutions, are shown in Figure 5. As would be expected, the tangential spatial resolution does not change significantly with source position and DOI resolution. The radial spatial resolution does however depend largely on the source position and DOI resolution. To demonstrate the effect of DOI binning, reconstructed images of the point source located at a radial offset of 10 mm from the center of the field of view are shown. The reconstructed images from the two scanner designs, employing the four different DOI resolutions are shown in Figure 6. The spatial resolution for all reconstructions and source locations is reported in Table 1. The average spatial resolution across a mouse-sized field of view (32 mm diameter) is also given. To compare the spatial resolution of the cuboid and tapered detectors (of the same DOI resolution) a paired t-test was performed. For all of the DOI resolutions examined the differences in the spatial resolution measurements between the cuboid and tapered detectors for the same DOI resolution are not statistically significant (p<0.05).
Figure 5.
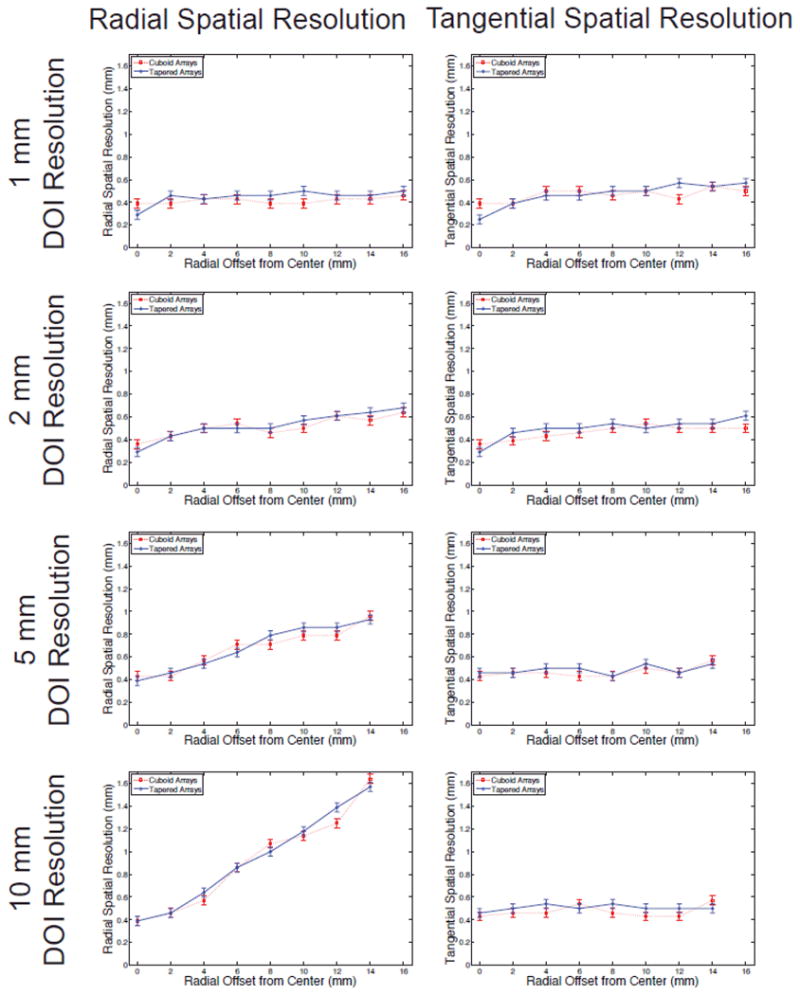
The radial and tangential spatial resolution as a function of source position for varying DOI resolutions.
Figure 6.
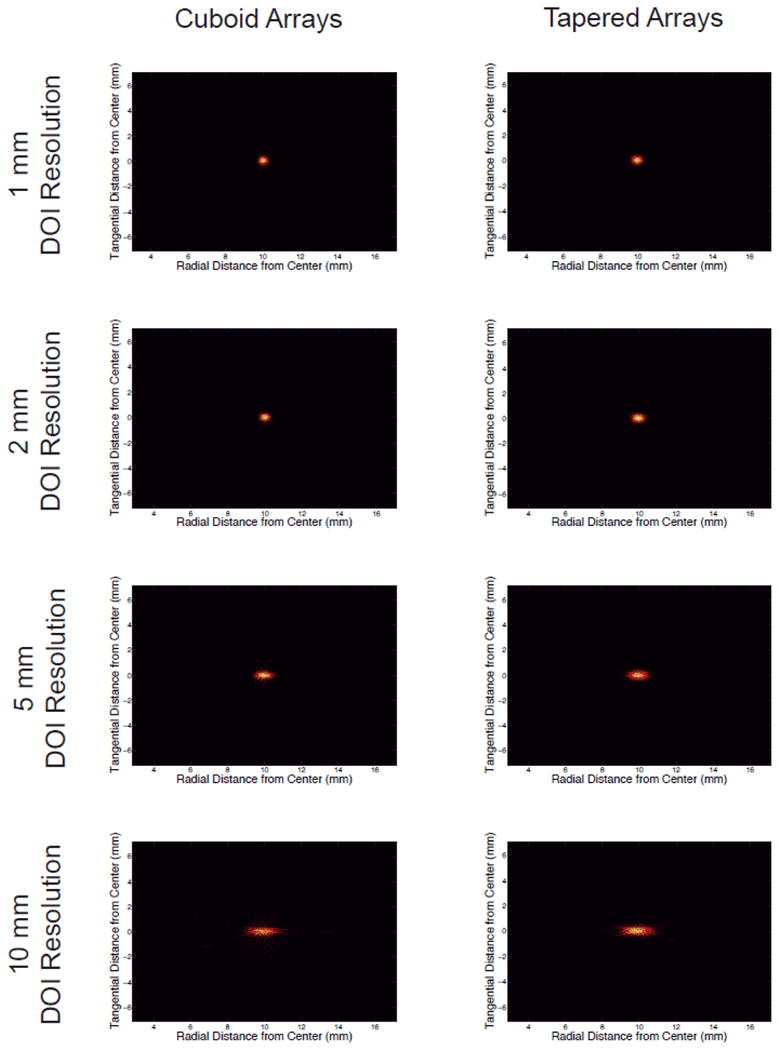
Reconstructed images of the point source at a radial offset of 10 mm for the cuboid arrays (left), the tapered arrays (right) and varying DOI resolutions.
Table 1.
The radial and tangential spatial resolution across the field of view for different DOI resolutions and the two evaluated detector designs. Estimated error on these measurements is +/− 0.04 mm. The average spatial resolution from 0 mm to 16 mm is also reported. For DOI resolution of 5 mm and 10 mm the spatial resolution was not reported for source offsets past 14 mm, as the fits to the reconstructed images were poor. This is also reflected in the average spatial resolution.
| DOI Resolution (mm) | 1 mm | 2 mm | 5 mm | 10 mm | |||||
|---|---|---|---|---|---|---|---|---|---|
| Source Position (mm) | Radial | Tangential | Radial | Tangential | Radial | Tangential | Radial | Tangential | |
| Tapered Arrays | 0 | 0.29 | 0.25 | 0.29 | 0.29 | 0.39 | 0.46 | 0.39 | 0.46 |
| 2 | 0.46 | 0.39 | 0.43 | 0.46 | 0.46 | 0.46 | 0.46 | 0.50 | |
| 4 | 0.43 | 0.46 | 0.50 | 0.50 | 0.54 | 0.50 | 0.64 | 0.54 | |
| 6 | 0.46 | 0.46 | 0.50 | 0.50 | 0.64 | 0.50 | 0.86 | 0.50 | |
| 8 | 0.46 | 0.50 | 0.50 | 0.54 | 0.79 | 0.43 | 1.00 | 0.54 | |
| 10 | 0.50 | 0.50 | 0.57 | 0.50 | 0.86 | 0.54 | 1.18 | 0.50 | |
| 12 | 0.46 | 0.54 | 0.61 | 0.54 | 0.86 | 0.46 | 1.39 | 0.50 | |
| 14 | 0.46 | 0.54 | 0.64 | 0.54 | 0.90 | 0.54 | 1.57 | 0.50 | |
| 16 | 0.50 | 0.57 | 0.68 | 0.61 | - | - | - | - | |
| Average | 0.45 | 0.47 | 0.52 | 0.50 | 0.68 | 0.49 | 0.94 | 0.50 | |
| Cuboid Arrays | 0 | 0.39 | 0.39 | 0.36 | 0.36 | 0.43 | 0.43 | 0.39 | 0.43 |
| 2 | 0.39 | 0.39 | 0.46 | 0.39 | 0.43 | 0.46 | 0.46 | 0.46 | |
| 4 | 0.43 | 0.50 | 0.50 | 0.43 | 0.57 | 0.46 | 0.57 | 0.46 | |
| 6 | 0.43 | 0.50 | 0.54 | 0.46 | 0.71 | 0.43 | 0.86 | 0.54 | |
| 8 | 0.39 | 0.46 | 0.46 | 0.50 | 0.71 | 0.43 | 1.07 | 0.46 | |
| 10 | 0.09 | 0.50 | 0.50 | 0.54 | 0.79 | 0.50 | 1.14 | 0.40 | |
| 12 | 0.43 | 0.43 | 0.61 | 0.50 | 0.79 | 0.46 | 1.25 | 0.43 | |
| 14 | 0.43 | 0.54 | 0.57 | 0.50 | 0.96 | 0.57 | 1.64 | 0.57 | |
| 16 | 0.46 | 0.50 | 0.64 | 0.50 | |||||
| Average | 0.42 | 0.47 | 0.51 | 0.46 | 0.68 | 0.47 | 0.93 | 0.48 | |
4. DISCUSSION AND CONCLUSIONS
The simulation results show the sensitivity gain achieved by designing small animal PET scanners using tapered arrays is significant. Using 37.5 % more LSO and the same number of electronics channels results in a gain in sensitivity of 64 % for a mouse-sized object. However, the most interesting result is that by changing to tapered detector arrays the spatial resolution is not significantly degraded for any given level of DOI encoding. As expected radial resolution improves rapidly with improving DOI resolution.
With iterative reconstruction techniques differences in spatial resolution between cuboid and tapered detectors may become more apparent, however much will depend on the accuracy of the system model. We decided to use an analytic reconstruction technique such as filtered backprojection to ensure that any differences seen in the reconstructed spatial resolution are due to the crystal shape rather than differences or approximations in the system model.
Overall, these results show that the accuracy of the DOI encoding, and not the proposed crystal geometry, is the most important factor in determining the spatial resolution across the appropriate field of view for mouse imaging. However, for detectors with a larger taper than those evaluated here, the influence of the shape of the detector may be more significant. The Monte Carlo simulations and the framework presented here for evaluating the spatial resolution achieved with DOI detectors could be used for other novel detector geometries. These same techniques can also be used to evaluate future generation scanners based on discrete DOI detectors (such as the phoswich detectors).
Factors that were not included in these Monte Carlo simulations include the non-collinearity of the two annihilation photons, the positron range, additional components of the scanners that may introduce scatter and optical light transport in the scintillation crystals. These factors will additionally blur the resulting images. These effects were intentionally left out of the study to evaluate the effect of continuous DOI resolution and the differences between tapered and cuboid detectors without additional blurring factors that might mask the geometrical effects of interest.
The results of this simulation study shows that images acquired with a small animal PET scanner with a diameter of 60 mm and 20 mm long scintillator crystals will be quite uniform across the FOV providing that the DOI resolution of the detectors is better than 2 mm. Combining the tapered crystal design with excellent DOI resolution provides a pathway to PET scanners that exhibit very high sensitivity and spatial resolution.
Acknowledgments
Funding for this work was provided by NIH grants R01EB006109, R44 NS055377 and by DOE grant DE-FG02-08ER64677.
Contributor Information
Sara St. James, Email: sara.stjames@gmail.com.
Simon R. Cherry, Email: srcherry@ucdavis.edu.
References
- Cesca N, Auricchio N, Di Domenico G, Zavattini G, Malaguti R, Andritschke R, Kanbach G, Schopper F. SiliPET: Design of an ultra-high resolution small animal PET scanner based on stacks of semi-conductor detectors. Nuclear Instruments and Methods in Physics Research Section A: Accelerators, Spectrometers, Detectors and Associated Equipment. 2007;572:225–7. [Google Scholar]
- Funk T, Sun M, Hasegawa BH. Radiation dose estimate in small animal SPECT and PET. Med Phys. 2004;31:2680–6. doi: 10.1118/1.1781553. [DOI] [PubMed] [Google Scholar]
- Habte F, Foudray AM, Olcott PD, Levin CS. Effects of system geometry and other physical factors on photon sensitivity of high-resolution positron emission tomography. Phys Med Biol. 2007;52:3753–72. doi: 10.1088/0031-9155/52/13/007. [DOI] [PMC free article] [PubMed] [Google Scholar]
- Ishii K, Kikuchi Y, Matsuyama S, Kanai Y, Kotani K, Ito T, Yamazaki H, Funaki Y, Iwata R, Itoh M, Yanai K, Hatazawa J, Itoh N, Tanizaki N, Amano D, Yamada M, Yamaguchi T. First achievement of less than 1 mm FWHM resolution in practical semiconductor animal PET scanner. Nuclear Instruments and Methods in Physics Research Section A: Accelerators, Spectrometers, Detectors and Associated Equipment. 2007;576:435–40. [Google Scholar]
- Jan S, Santin G, Strul D, Staelens S. GATE: a simulation toolkit for PET and SPECT. Phys Med Biol. 2004;49:4543–61. doi: 10.1088/0031-9155/49/19/007. [DOI] [PMC free article] [PubMed] [Google Scholar]
- Maas MC, Schaart DR, van der Laan DJ, Bruyndonckx P, Lemaitre C, Beekman FJ, van Eijk CW. Monolithic scintillator PET detectors with intrinsic depth-of-interaction correction. Phys Med Biol. 2009;54:1893–908. doi: 10.1088/0031-9155/54/7/003. [DOI] [PubMed] [Google Scholar]
- NEMA. NEMA NU-4, Perfomance Measurements of Small Animal Positron Emission Tomographs. Rosslyn, Va: National Electrical Manufacturers Association; 2008. [Google Scholar]
- Saoudi A, Pepin CM, Dion F, Bentourkia M, Lecomte R, Andreaco M, Casey M, Nutt R, Dautet H. Investigation of depth-of-interaction by pulse shape discrimination in multicrystal detectors read out by avalanche photodiodes. IEEE Trans Nucl Sci. 1999;46:462–7. [Google Scholar]
- Shah KS, Grazioso R, Farrell R, Glodo J, McClish M, Entine G, Dokhale P, Cherry SR. Position sensitive APDs for small animal PET imaging. IEEE Trans Nucl Sci. 2004;51:91–5. [Google Scholar]
- Shiga T, Morimoto Y, Kubo N, Katoh N, Katoh C, Takeuchi W, Usui R, Hirata K, Kojima S, Umegaki K, Shirato H, Tamaki N. A new PET scanner with semiconductor detectors enables better identification of intratumoral inhomogeneity. J Nucl Med. 2009;50:148–55. doi: 10.2967/jnumed.108.054833. [DOI] [PubMed] [Google Scholar]
- St James S, Yang Y, Wu Y, Farrell R, Dokhale P, Shah KS, Cherry SR. Experimental characterization and system simulations of depth of interaction PET detectors using 0.5 mm and 0.7 mm LSO arrays. Phys Med Biol. 2009;54:4605–19. doi: 10.1088/0031-9155/54/14/015. [DOI] [PMC free article] [PubMed] [Google Scholar]
- Stickel JR, Qi J, Cherry SR. Fabrication and characterization of a 0.5-mm lutetium oxyorthosilicate detector array for high-resolution PET applications. J Nucl Med. 2007;48:115–21. [PubMed] [Google Scholar]
- Tai YC, Chatziioannou AF, Yang Y, Silverman RW, Meadors K, Siegel S, Newport DF, Stickel JR, Cherry SR. MicroPET II: design, development and initial performance of an improved microPET scanner for small-animal imaging. Phys Med Biol. 2003;48:1519–37. doi: 10.1088/0031-9155/48/11/303. [DOI] [PubMed] [Google Scholar]
- Taschereau R, Chatziioannou AF. Monte Carlo simulations of absorbed dose in a mouse phantom from 18-fluorine compounds. Med Phys. 2007;34:1026–36. doi: 10.1118/1.2558115. [DOI] [PMC free article] [PubMed] [Google Scholar]
- Tsuda T, Murayama H, Kitamura K, Yamaya T, Yoshida E, Omura T, Kawai H, Inadama N, Orita N. A four-layer depth of interaction detector block for small animal PET. IEEE Trans Nucl Sci. 2004;51:2537–42. [Google Scholar]
- van der Laan DJ, Maas MC, de Jong HWAM, Schaart DR, Bruyndonckx P, Lemaître C, van Eijk CWE. Simulated performance of a small-animal PET scanner based on monolithic scintillation detectors. Nuclear Instruments and Methods in Physics Research Section A: Accelerators, Spectrometers, Detectors and Associated Equipment. 2007;571:227–30. [Google Scholar]
- Wu Y, Ng TS, Yang Y, Shah K, Farrell R, Cherry SR. A study of the timing properties of position-sensitive avalanche photodiodes. Phys Med Biol. 2009;54:5155–72. doi: 10.1088/0031-9155/54/17/006. [DOI] [PMC free article] [PubMed] [Google Scholar]
- Yang Y, Dokhale PA, Silverman RW, Shah KS, McClish MA, Farrell R, Entine G, Cherry SR. Depth of interaction resolution measurements for a high resolution PET detector using position sensitive avalanche photodiodes. Phys Med Biol. 2006;51:2131–42. doi: 10.1088/0031-9155/51/9/001. [DOI] [PubMed] [Google Scholar]
- Yang Y, Wu Y, Qi J, St James S, Du H, Dokhale PA, Shah KS, Farrell R, Cherry SR. A Prototype PET Scanner with DOI-Encoding Detectors. J Nucl Med. 2008;49:1132–40. doi: 10.2967/jnumed.107.049791. [DOI] [PMC free article] [PubMed] [Google Scholar]
- Zhang N, Thompson CJ, Togane D, Cayouette F, Nguyen KQ. Anode position and last dynode timing circuits for dual-layer BGO scintillator with PS-PMT based modular PET detectors. IEEE Trans Nucl Sci. 2002;49:2203–7. [Google Scholar]
- Ziemons K, Auffray E, Barbier R, Brandenburg G, Bruyndonckx P, Choi Y, Christ D, Costes N, Declais Y, Devroede O, Dujardin C, Fedorovd A, Heinrichs U, Korjik M, Krieguer M, Kuntner C, Largeron G, Lartizien C, Larue H, Lecoq P, Leonard S, Marteau J, Morel C, Mosset JB, Parl C, Pedrini C, Petrosyan AG, Pietrzyk U, Rey M, Saladino S, Sappey-Marinier D, Simon L, Streun M, Tavernier S, Vieira JM. The ClearPET(TM) project: development of a 2nd generation high-performance small animal PET scanner. Nuclear Instruments and Methods in Physics Research Section A: Accelerators, Spectrometers, Detectors and Associated Equipment. 2005;537:307–11. [Google Scholar]