Abstract
We have employed matrix deposition by sublimation for protein image analysis on tissue sections using a hydration/recrystallization process that produces high quality MALDI mass spectra and high spatial resolution ion images. We systematically investigated different washing protocols, the effect of tissue section thickness, the amount of sublimated matrix per unit area and different recrystallization conditions. The results show that an organic solvent rinse followed by ethanol/water rinses substantially increased sensitivity for the detection of proteins. Both the thickness of tissue section and amount of sinapinic acid sublimated per unit area have optimal ranges for maximal protein signal intensity. Ion images of mouse and rat brain sections at 50, 20 and 10 µm spatial resolution are presented and are correlated with H&E stained optical images. For targeted analysis, histology directed imaging can be performed using this protocol where MS analysis and H&E staining are performed on the same section.
Keywords: Imaging MS, tissue, sublimation, recrystallization, high spatial resolution, Matrix application methods
MALDI imaging mass spectrometry (IMS) of tissue sections provides spatial information for a wide variety of compounds in a given section and plays an important role in discovery because it does not require target specific reagents such as antibodies.1 The imaging process involves sequential steps of tissue sectioning, matrix deposition, data acquisition and image construction.1a, 2 For protein analysis, matrix is usually deposited on the surface of a tissue section by spraying or microspotting. With spraying techniques, the spreading of liquid on the surface can be minimized by not allowing the tissue to become overly wet and this is typically accomplished by applying the matrix in cycles with drying between cycles. With microspotting techniques, potential delocalization is limited to the diameter of the matrix spot. Each protocol has particular attributes: spraying is capable of producing higher spatial resolution to about 10–20 µm,3 but is less sensitive because of limited protein extraction. Microspotting provides increased sensitivity through higher extraction efficiency but is generally limited to a spatial resolution of the size of the spot, or about 100–200 µm with current spotters. It has been reported that matrix application using a modified desktop inkjet printer can obtain 3 pL droplet volumes. However, the size of matrix spot on the surface is tens of microns due to diffusion, giving a spatial resolution of 20 µm or greater.4
In order to image at cellular and subcellular levels, both smaller laser spot sizes (1–5 µm) and suitable sample preparation methods must be developed that provide minimal delocalization and achieve crystal sizes smaller than the diameter of the laser beam on target. MALDI profiling and imaging of peptides has been reported at the “cellular length scale”, with matrix applied by spray coating giving crystal sizes generally ranging from 10–50 µm diameter.5 However, more efficient sample preparation protocols are needed for routine protein imaging at cellular and subcellular levels.
Sublimation of matrix was introduced for lipid imaging at a spatial resolution up to 5 µm by Hankin et al.,6 but this has not been effective for protein imaging due to poor analyte extraction. A recrystallization step after sublimation has been reported where MALDI MS was used for the analysis of a structured silica target for analytes less than m/z 2000.7 However, sublimation for imaging analytes larger than m/z 2000 from thin tissue sections has not been demonstrated.
We describe here a sample preparation method for protein imaging using sublimation for analytes up to m/z 30,000 at high spatial resolution. The sample preparation protocol consists of two phases: first, washing (fixing) of the tissue to optimize sensitivity, and, second, matrix deposition and recrystallization. We systematically investigated each step of the protocol with thin tissue sections with respect to washing conditions, section thickness, amount of sublimated matrix per unit area, and recrystallization parameters. With the optimized protocol, ion images of mouse and rat brain at high spatial resolution were acquired with high sensitivity up to m/z 30,000. We further developed a histology directed imaging method on tissue for targeted high spatial resolution imaging.
Material and methods
Ethanol, methanol, acetonitrile (ACN), and acetic acid were purchased from Fisher Scientific (Suwanee, GA), trifluoroacetic acid (TFA) and xylene from Acros (Morris Plains, NJ), chloroform, isopropanol, n-butanol and tert-butanol (t-BuOH) from Sigma-Aldrich (Milwaukee, WI). Sinapinic acid (SA) was purchased from Oakwood Products, Inc (SC) and recrystallized twice with 70% ACN. Conductive indium tin oxide (ITO) coated microscope glass slides were purchased from Delta Technologies (Stillwater, MN) and stainless steel plates from Applied Biosystems (Carlsbad, CA).
Carnoy’s fluid was prepared from of 60 mL of ethanol, 30 mL of chloroform, and 10 mL of acetic acid. Fresh frozen mouse brain, rat brain and chicken liver were purchased from Pel-Freez Biologicals (Rogers, AZ) and were sectioned at 12 µm thickness unless otherwise noted using a Leica CM3050 cryostat (Leica Microsystems GmbH, Wetzlar, Germany). Frozen tissue sections were thaw mounted on cold ITO coated microscope slides and stored in a desiccator until needed.
Rinsing procedure
Rinsing of the tissue section on the slide is important in order to obtain optimal sensitivity and high quality ion images. Several protocols were tested and are listed below. All rinse steps were carried out for 30 seconds except for the step with Carnoy’s solution which was for 2 minutes. A ‘no rinse’ control was used for comparison.
(Rinse Protocol A): no rinsing (control)
(Rinse Protocol B): 2 step rinse: 70% ethanol, 100% ethanol
(Rinse Protocol C): 4 step rinse: H2O, 70% ethanol, 100% ethanol, Carnoy’s fluid
(Rinse Protocol D): 6 step rinse: 70% ethanol, 100% ethanol, Carnoy’s fluid, 100% ethanol, H2O, 100% ethanol
Matrix sublimation procedure
The sublimation apparatus was purchased from Chemglass Life Sciences and fits a plate diameter of 70 mm. The apparatus was coupled to a rough pump and a digital thermocouple vacuum gauge controller and was placed on a sand bath heated by a hot plate (Corning 6795-200). The temperature was monitored by a digital thermometer.
Indium tin oxide (ITO) coated glass slide were used as target mounts for instruments having high voltage sources. For tissue sections mounted on shortened ITO microscope glass slides (2.5 × 6 cm), sublimation was performed using 300 mg of sinapinic acid at 145°C and 25 mtorr vacuum. The amount of matrix coating per unit area with these conditions was controlled by time to obtain a coating at 0.2 mg/cm2, assessed by weight. In terms of time, a shorten microscope slide takes 18 min to coat using this procedure.
Matrix recrystallization conditions
Recrystallization conditions tested are listed in Table 1. An inexpensive recrystallization chamber was fashioned using a normal glass Petri dish (100 mm diameter × 15 mm deep, Fisher, 3160101). The slide with sublimated matrix was attached to a stainless steel plate (used as a heat sink), and the plate was attached to the underside of the top part of the Petri dish using a heat conductive copper tape (Electron Microscopy Sciences, 77801). This was placed into a pre-heated oven (set at a temperature noted in Table 1) for 2 min. A piece of filter paper was placed in the bottom part of the Petri dish, and one of several solutions (Table 1) was pipetted onto the paper to subsequently create a vapor for the recrystallization process. The Petri dish was reassembled so as to form a hydration chamber, sealed using a tape (Fisher, 35901R) and left in the oven for the time indicated in Table 1. The Petri dish was then opened to allow the slide to dry in the oven.
Table 1.
Recrystallization conditions of sublimated sections
| Water based recrystallization (85°C, 3.5 min) | High organic content recrystallization (2 min) |
|---|---|
| (1) 1 mL H2O | (5) 163 µL H2O, 837 µL ACN, 76.5°C |
| (2) 1 mL H2O, 50 µL methanol | (6) 121 µL H2O, 879 µL isopropanol, 80.4°C |
| (3) 1 mL H2O, 50 µL acetic acid | (7) 445 µL H2O, 555 µL n-BuOH, 92.4°C |
| (4) 1 mL H2O, 50 µL TFA | (8) 120 µL H2O, 880 µL t-BuOH, 79.9°C |
Analysis of a standard protein solution
The standard protein stock solution contained a mixture of following proteins: bovine pancreas insulin (0.5 pmol/µL), equine heart cytochrome c (2 pmol/µL), equine apomyoglobin (4 pmol/µL), and bovine pancreas trypsinogen (8 pmol/µL).
One microliter of the standard protein solution (5 µL of stock solution was diluted in 25 µL of H2O) was pipetted onto four clean glass slides. The slides were sublimated with SA to form a coating containing 0.2 mg/cm2. Recrystallization was carried out with conditions 1–4 in Table 1.
Tissue analysis
Serial sections of chicken liver sectioned at 1, 2, 3, 4, 6, 8, 10, 12 and 16 µm thickness were placed on a ITO-coated microscope slide, rinsed with Rinse Protocol (D), sublimated with sinapinic acid at 0.2 mg sinapinic acid/cm2, and recrystallized with Recrystallization Condition (3) in Table 1.
Amount of matrix deposited per unit area
Serial sections of chicken liver of 12 µm thickness were subjected with Rinse Protocol (D) and then sublimated with SA for different amounts of time: 8, 12, 18, 20, 24, 30, 36, 40, and 45 min. The weight of the slide before and after sublimation was measured with a Toledo analytical balance to obtain the average amount of matrix per cm2 that was deposited. The slides were then treated with Recrystallization Condition (3).
Matrix coating thickness measurement
A slide with sublimated matrix at 0.214 mg/cm2 was irradiated by the laser of an Autoflex MALDI Speed mass spectrometer to produce an array of 100–120 µm diameter holes in the surface (60 holes were placed, center to center 2 mm, within a 10 × 28 mm size area on the slide). The thickness of the matrix coating was measured using the 3D stack function of an Olympus BX50 microscope (Olympus America Inc., Center Valley, PA) by focusing at the surface near the holes and the bottom of holes.
Hematoxylin and eosin stain for imaged sections
After MALDI imaging, slides were rinsed with ethanol and acetone to remove the matrix. The tissue sections were then subjected to a standard hematoxylin and eosin (H&E) staining procedure.8 H&E stained sections were scanned with a Mirax slide scanner from Zeiss or photographed with an Olympus BX50 microscope equipped with a Micropublisher 3.3 RTV digital camera (Q Imaging, Surrey, BC, Canada).
Histology guided MS imaging
An ITO-coated slide containing a rat brain section was first stained with H&E and scanned with the Mirax slide scanner. The slide was immersed in xylene for 20 minutes and the cover slip of the slide removed. The H&E stain was removed by incubating the slide in 2 × 12 mL of 95% ethanol with 3% HCl for 10 minutes each on a LAB-LINE® Multipurpose Rotator platform. The slide was then subjected to the optimized sublimation preparation and recrystallization procedure described above.
Mass Spectrometry and Data Analysis
MALDI MS analyses of proteins were performed on a Bruker Autoflex MALDI Speed mass spectrometer in the positive ion linear mode using FlexControl 3.3 software. Approximately 100 shots/spot were acquired with a 1 kHz repetition rate Smartbeam II Nd:YAG laser. Image acquisition was carried out using FlexImaging 2.1 and spectral analysis was performed with FlexAnalysis 3.3 and ClinProTools software programs (Bruker).
Results and discussion
Characterization of the sublimated matrix layer
A glass slide with a matrix coating at 0.214 mg/cm2 covering an area of 10 × 28 mm was measured for thickness using ablated 100–120 µm diameter holes at 2 mm steps. The average thickness of the matrix coating was measured at 2.09±0.14 µm using the 3D stack function of the microscope. A total of 60 ablated spots evenly distributed across the entire slide were measured in this evaluation and each spot was measured 4 times.
Optimization of tissue washing
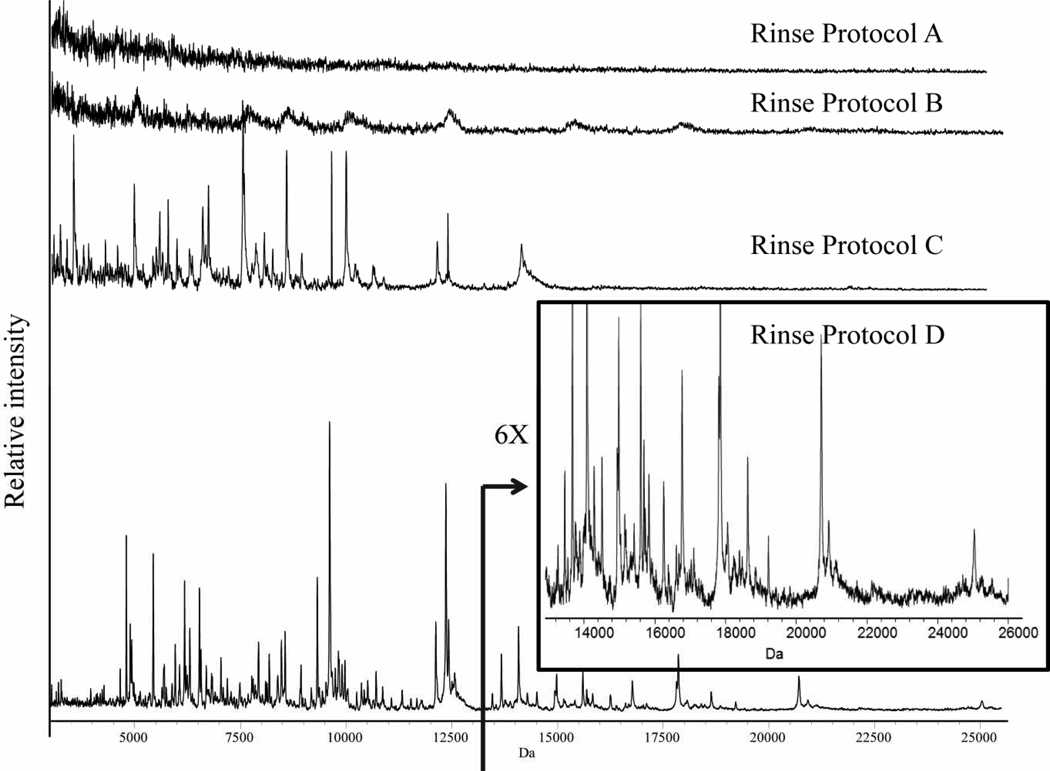
To optimize tissue washing conditions prior to sublimation, we employed serial sections of a rat brain and a series of different washing conditions. Commonly used tissue washing (fixing) protocols,9 e.g., rinsing the tissue section first with 70% ethanol for 30 seconds and then 95 or 100% ethanol for 30 seconds, did not significantly improve sensitivity for protein analysis using matrix deposition by sublimation (Figure 1 B). Two new protocols were tested that gave high quality mass spectra as shown in Figure 1 (C and D). All the spectra were acquired from the same location on each serial section with 100 laser shots at the same laser intensity.
Figure 1.
The results of different rinsing protocols on protein profiles obtained from serial rat brain sections of 12 µm thickness. (See methods section for details)
Rinse protocol D gave the best results where the tissue was rinsed with 70% ethanol followed by 100% ethanol in order to fix the section, a standard protocol used in classical histology. Carnoy’s fluid then efficiently removed most of the lipids from the section, followed by washing with 100% ethanol to remove the remaining chloroform from Carnoy’s fluid (this step can be replaced by placing the slide under a vacuum for 2 min). Next, a water rinse removed salts and a final step of 100% ethanol removed excess water. The mass spectrum obtained using this procedure (Rinse Protocol D) shows a robust protein profile and mass range over 25kDa.
Optimization of matrix recrystallization conditions
The process of incorporation of analytes into the sublimated matrix using water vapor has been previously reported for species less than m/z 3000 with DHB as the matrix,7, 10 however, none of these methods was developed for imaging analytes on thin tissue sections. In the current work, we have developed a recrystallization procedure with sinapinic acid suitable for imaging proteins on thin tissue sections that can be accomplished quickly (<10 min) using simple laboratory glassware, i.e., a Petri dish, a stainless steel plate as a heat sink and a constant temperature (85°C) oven. In this process, the microscope slide is fixed to a stainless steel plate in order to introduce a thermally conductive substrate to allow a temperature gradient for vapor condensation. This is a key element for recrystallization so that it can be accomplished in a short time. The optimal recrystallization time was found to be 3–4 minutes at 85°C for water based solutions. With exposure to solvent vapor much longer than 4 minutes, excessive water condensation was found on the surface, with the formation of non-homogenous areas of matrix that potentially could lead to analyte delocalization.
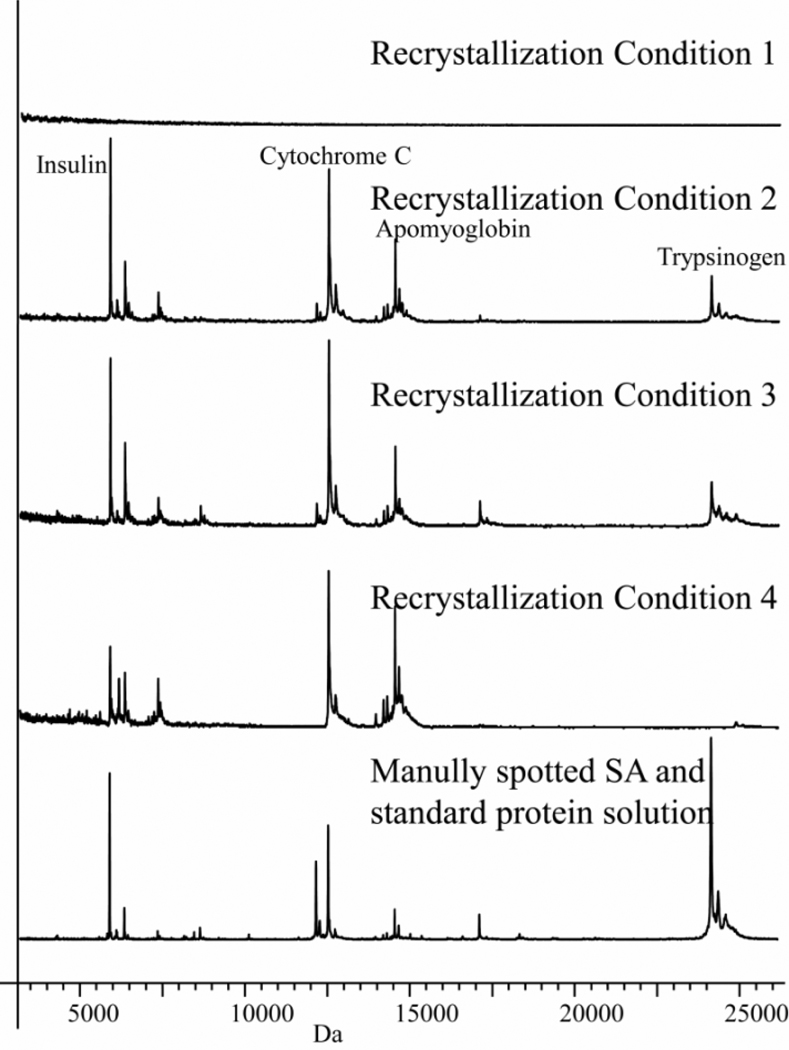
Four slides spotted with a standard protein solution were coated with sinapinic acid by sublimation and recrystallization process corresponding to conditions 1–4. As shown in Figure 2, there was no detectable signal from the slide recrystallized with water alone (Figure 2, Panel 1) while slides recrystallized with H2O/acetic acid and H2O/methanol gave spectra similar to those spotted manually (Figure 2, panel 2 and 3). The spectrum shown in panel 4 employed a recrystallization process that used TFA and this was found to produce lower intensity high mass signals.
Figure 2.
Spectra from sublimated slides spotted with a standard protein mixture using different recrystallization conditions. (Panel 1), H2O; (Panel 2), H2O/methanol; (Panel 3), H2O/acetic acid; (Panel 4), H2O/TFA; (Panel 5), control, manually spotted mixture of SA (20 mg in 1:1 ACN:H2O) and standard proteins solution
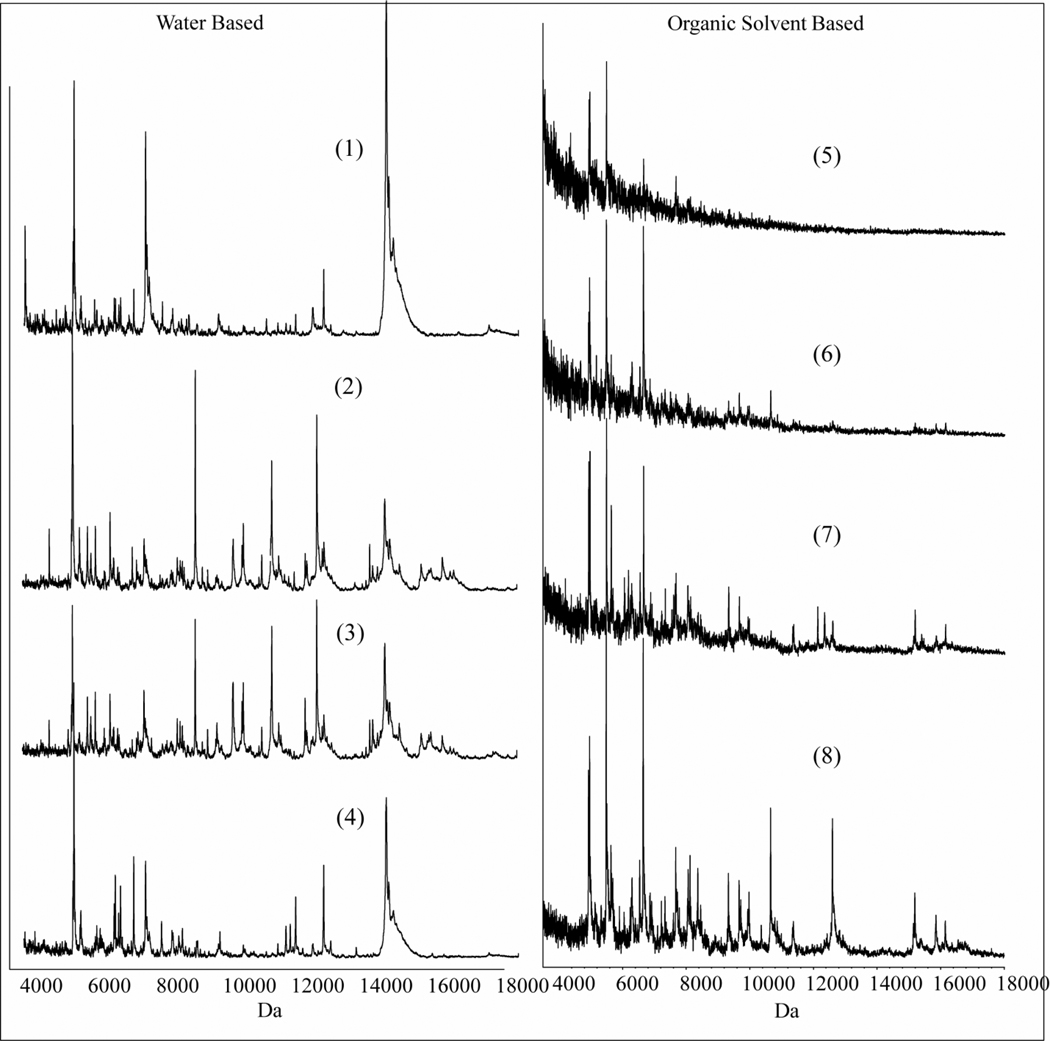
We performed the same recrystallization condition procedures on chicken liver sections to determine the optimal recrystallization condition for this more complex sample. Again, as in the case of the standard protein mixture, both H2O/acetic acid and H2O/methanol gave excellent protein profiles with the greatest number of peaks in the spectrum and the highest peak intensities (Figure 3, 1–4).
Figure 3.
Impact of different recrystallization procedures on the protein profiles obtained from serial sections of chicken liver of 12 µm thickness (1–8, see the recrystallization conditions in the methods section).
Since sinapinic acid has a low solubility in water, we investigated methods to condense a layer of higher organic content on the surface of the matrix. Conditions were employed based on known azeotropic mixtures.11 For initial experiments, n-butanol, t-butanol, isopropanol and acetonitrile were chosen for their high ratio of solvent to water at the azeotropic point. A total of 1 mL of each azeotropic solution (see Table 1) was used to recrystallize the sublimated serial sections of chicken liver. The oven was set up at the temperature of the azeotropic point for each solution. We found that 2 minutes of recrystallization with these solutions gave a satisfactory coating of solution on the surface. The water/t-butanol mixture was optimal for the organic based vapors in that it produced the highest number of peaks in the spectra and the highest S/N ratio compared to the other preparations (Figure 3, 5–8).
Effect of tissue thickness and amount of matrix
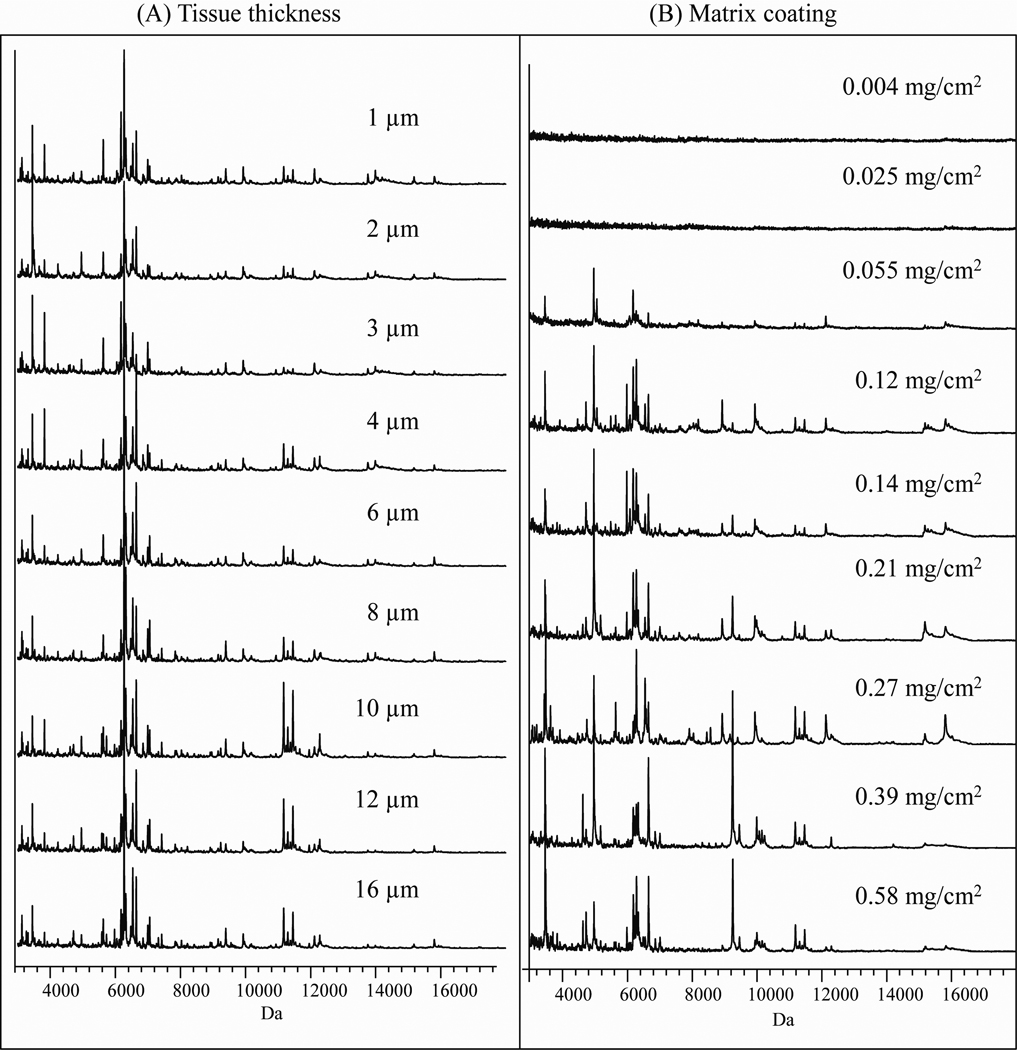
Chicken liver serial sections at 1, 2, 3, 4, 6, 8, 10, 12 and 16 µm thick were prepared with optimized Rinsing Protocol (D) and Recrystallization Condition (3) to investigate the impact of tissue thickness on protein profiles. The results showed that tissue sections of 4–15 µm thick gave essentially identical protein profiles (Figure 4 (A)). Routinely, we utilize 12 µm sections for ease of handling.
Figure 4.
Effect of tissue thickness and amount of matrix on the protein profile of serial sections of a chicken liver. (A) Spectra from tissue sections with different thickness; (B) Spectra of tissue sections at 12 µm thick coated with different amounts of matrix per cm2
The amount of matrix per unit area was determined by weighing the slide before and after sublimation. By keeping the temperature and vacuum constant (145°C, 25 mtorr) in the sublimation apparatus, the amount of sinapinic acid coating per unit area was controlled by the length of the sublimation time. It was observed that the protein profiles were essentially identical with a coating of sinapinic acid from 0.12 to 0.27 mg/cm2 (Figure 4 (B)). Below 0.055 mg/cm2, the signal intensity was poorer. A matrix coating thicker than 0.38 mg/cm2 resulted in an elevated baseline and poorer sensitivity.
Recommended protocol
A slide containing a 12 µm thick tissue section was rinsed with Rinsing Protocol (D), subsequently sublimated with sinapinic acid at 0.20 mg/cm2 and finally treated with 1 mL of 5% acetic acid at 85°C for 3.5 min (Recrystallization Conditions (3)).
This recommended protocol for imaging proteins produced high quality spectra for sections of mouse kidney, rat kidney, mouse heart, rat heart, rat pancreases, mouse embryo and rabbit testis (data not shown). By modifying some parameters of this recommended protocol (solvents ratio, temperature etc.), it can be optimized for any type of tissue.
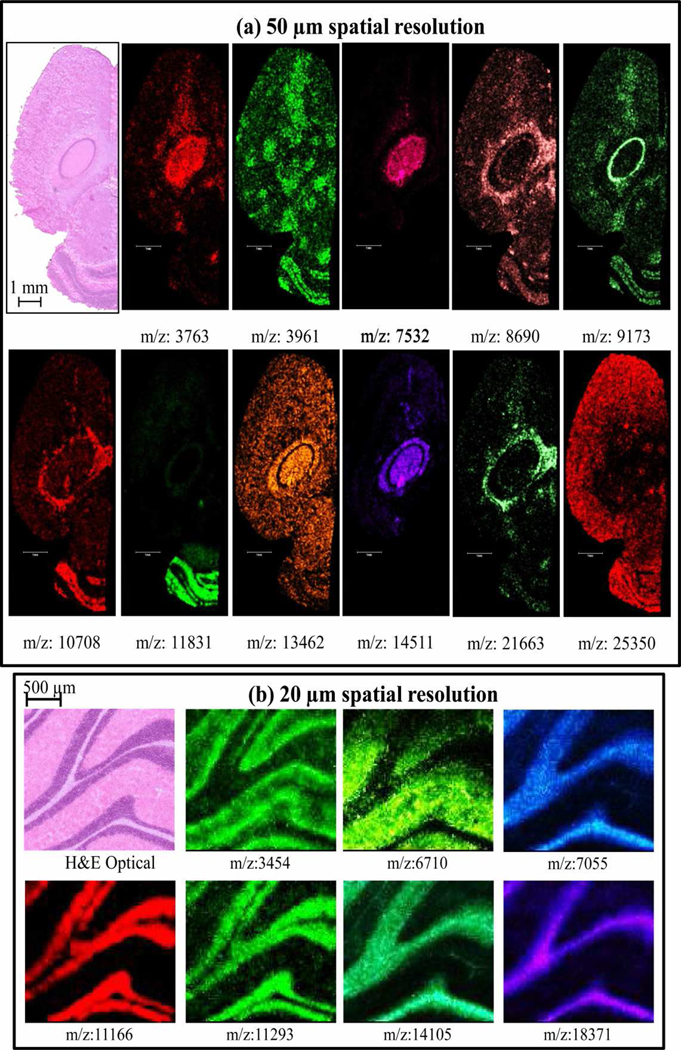
To test image quality using the optimized method, we imaged a 12 µm thick coronal section of a mouse brain with a raster of 50 µm steps using a laser spot diameter of about 40 µm on target. Representative ion images are shown in Figure 5 (a). The H&E stained optical image of the same section obtained after MALDI imaging is shown in the top left of Figure 5 (a).
Figure 5.
(A) Ion images from a 12 µm thick mouse brain section at 50 µm spatial resolution; (B) Ion images from a 12 µm thick rat brain section at 20 µm spatial resolution.
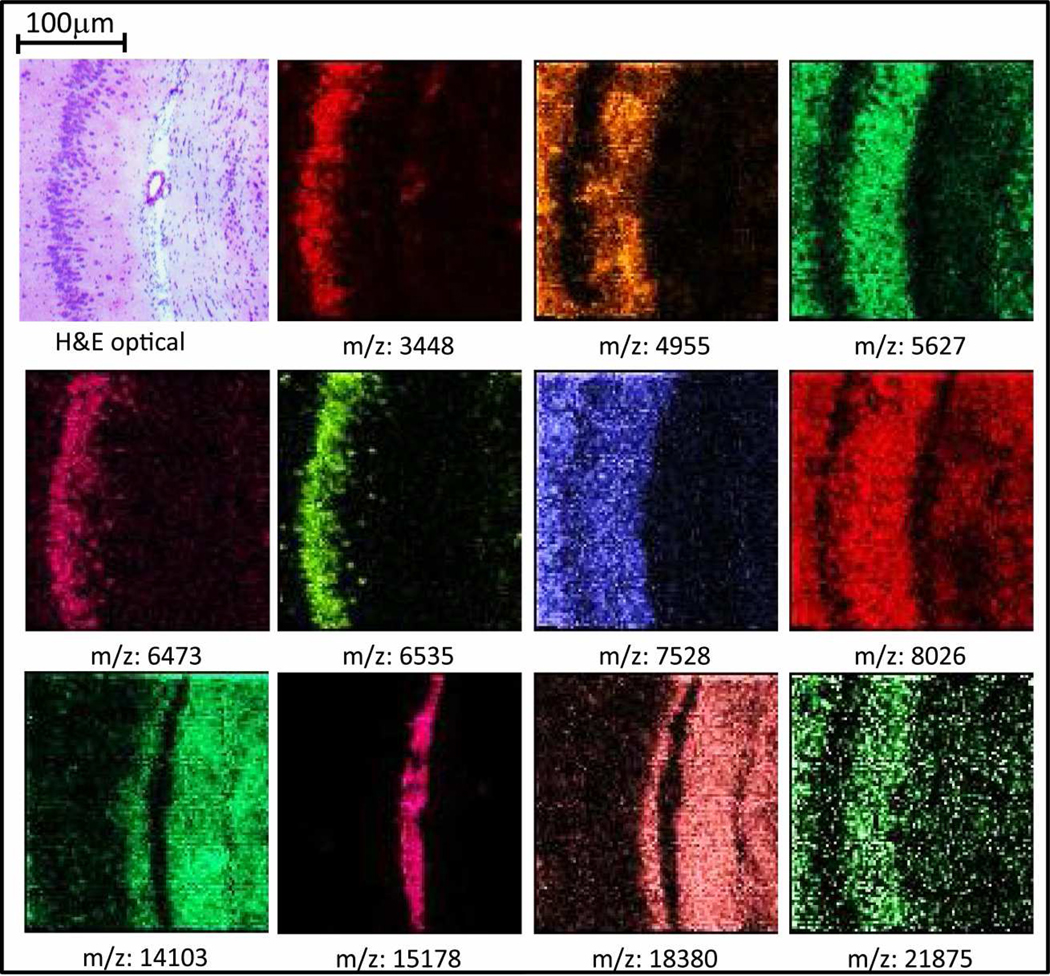
As a further illustration of the capability for high spatial resolution using this sample preparation protocol, first, a 20 µm raster was performed on a rostral section across cerebellum of rat brain (Figure 5 (b)) using a laser spot size on target of 25 µm. Excellent correlation of the H&E stained optical image with ion images was observed. Next, an image having a spatial resolution of 10 µm was performed where the stage was moved at 10 µm steps so that only a 10 × 10 µm area of the tissue was ablated per pixel. The ions of thymosin b-4 (m/z 4955), neurogranin (m/z 7528), and two isoforms of myelin basic protein (m/z 14103, 18380) that were previously identified in our laboratory were localized on a section of rat brain (Figure 6).
Figure 6.
Ion images from a 12 µm thick section of rat brain at 10 µm spatial resolution.
Performing histology prior to MALDI imaging
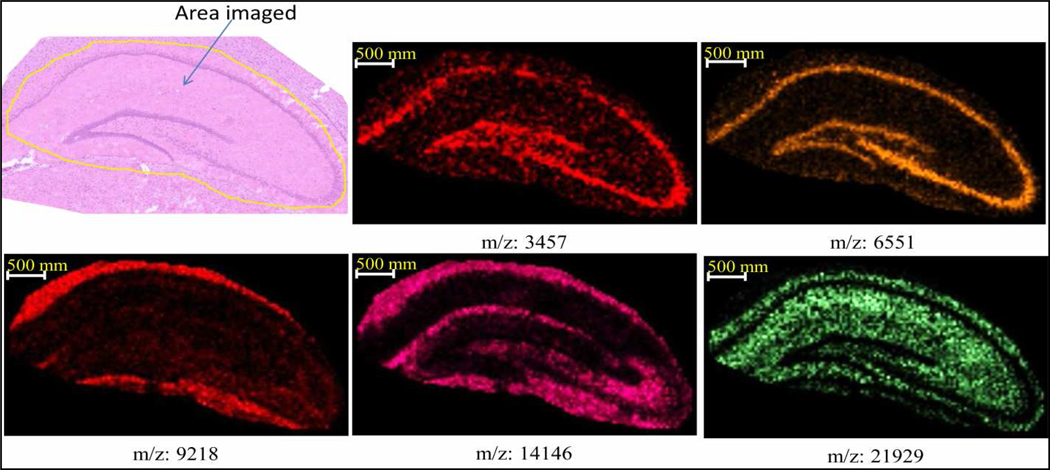
In cases where classical histology staining must be used to help define the MS imaging, we have modified our procedure. This is similar to histology directed profiling,12 although in this case a defined area was imaged instead of cell clusters. At high spatial resolution of 10–35 µm, adjacent tissue sections may not necessarily register or align well. Thus we have employed a protocol whereby H&E staining and MALDI imaging are conducted on the same section. Briefly, the section is stained by standard H&E and an optical image of this section is annotated with the area of interest. The section is then destained and prepared with the optimized sublimation protocol for MALDI imaging. The optical image of stained section is then aligned with the image of destained/matrix coated section. Representative ion images of the hippocampus in a rat brain section are presented in Figure 7, showing an excellent correlation between the optical image and ion images. The value of this procedure is that only the area of interest is imaged, allowing faster acquisition time and avoiding unnecessarily large data files.
Figure 7.
Representative ion images of the hippocampus in a 12 µm thick rat brain section where histology was used guide the area to be imaged. The spatial resolution was 35 µm.
Conclusion
A procedure is described for imaging proteins between 3–30 kDa using a sublimation-based sample preparation protocol that allows a spatial resolution of 10 µm. With histology directed profiling, high resolution molecular analysis was carried out in a targeted manner for high-throughput analysis. Sublimation is a solvent-free coating approach that produces matrix crystals generally less than 1 µm in diameter.13 We obtained matrix crystals of 0.5–3 µm in size measured by SEM, therefore this protocol is amenable for higher spatial resolution imaging. More importantly, the sublimated surface is homogenous under properly controlled conditions. These characteristics make sublimation suitable for cellular level imaging and preferred over other solvent free coating methods. Chemical bias may exist for high molecular weight species due to poor extraction efficiency using water based solvents. Further studies of different rehydration systems could be potentially beneficial in this regard. Sublimation-coated tissue sections are amenable to high spatial resolution imaging and recrystallization protocols that allow high sensitivity and high mass analysis to be achieved.
Acknowledgement
The authors acknowledge funding from the National Institutes of Health (grant # 5RO1 GM058008-11 and 1P41 RR031461-01).
References
- 1.(a) Stoeckli M, Chaurand P, Hallahan DE, Caprioli RM. Nat. Med. 2001;(7):493–496. doi: 10.1038/86573. [DOI] [PubMed] [Google Scholar]; (b) Franck J, Arafah K, Elayed M, Bonnel D, Vergara D, Jacquet A, Vinatier D, Wisztorski M, Day R, Fournier I, Salzet M. Mol. Cell. Proteomics. 2009;8(9):2023–2033. doi: 10.1074/mcp.R800016-MCP200. [DOI] [PMC free article] [PubMed] [Google Scholar]
- 2.(a) Chaurand P, Norris JL, Cornett DS, Mobley JA, Caprioli RM. J. Proteome Res. 2006;5(11):2889–2900. doi: 10.1021/pr060346u. [DOI] [PubMed] [Google Scholar]; (b) Chaurand P, Schwartz SA, Caprioli RM. Anal. Chem. 2004;76(5):86 A–93 A. [PubMed] [Google Scholar]
- 3.Lagarrigue M, Becker M, Lavigne R, Deininger S-O, Walch A, Aubry F, Suckau D, Pineau C. Molecular & Cellular Proteomics. doi: 10.1074/mcp.M110.005991. [DOI] [PMC free article] [PubMed] [Google Scholar]
- 4.Baluya DL, Garrett TJ, Yost RA. Anal. Chem. 2007;79(17):6862–6867. doi: 10.1021/ac070958d. [DOI] [PubMed] [Google Scholar]
- 5.(a) Li L, Garden RW, Sweedler JV. Trends Biotechnol. 2000;18(4):151–160. doi: 10.1016/s0167-7799(00)01427-x. [DOI] [PubMed] [Google Scholar]; (b) Altelaar AFM, Taban IM, McDonnell LA, Verhaert PDEM, de Lange RPJ, Adan RAH, Mooi WJ, Heeren RMA, Piersma SR. Int. J. Mass Spectrom. 2007;260(2–3):203–211. [Google Scholar]
- 6.(a) Hankin JA, Barkley RM, Murphy RC. J. Am. Soc. Mass Spectrom. 2007;18(9):1646–1652. doi: 10.1016/j.jasms.2007.06.010. [DOI] [PMC free article] [PubMed] [Google Scholar]; (b) Chaurand P, Cornett DS, Angel PM, Caprioli RM. Mol. Cell. Proteomics. 2010 doi: 10.1074/mcp.O110.004259. [DOI] [PMC free article] [PubMed] [Google Scholar]
- 7.Bouschen W, Schulz O, Eikel D, Spengler B. Rapid Commun. Mass Spectrom. 2010;24(3):355–364. doi: 10.1002/rcm.4401. [DOI] [PubMed] [Google Scholar]
- 8.Prophet EB Armed Forces Institute of, P. Laboratory methods in histotechnology. Washington, D.C.: American Registry of Pathology; 1992. [Google Scholar]
- 9.Seeley EH, Oppenheimer SR, Mi D, Chaurand P, Caprioli RM. J. Am. Soc. Mass Spectrom. 2008;19(8):1069–1077. doi: 10.1016/j.jasms.2008.03.016. [DOI] [PMC free article] [PubMed] [Google Scholar]
- 10.(a) Monroe EB, Koszczuk BA, Losh JL, Jurchen JC, Sweedler JV. Int. J. Mass Spectrom. 2007;260(2–3):237–242. [Google Scholar]; (b) Dekker LJM, van Kampen JJA, Reedijk ML, Burgers PC, Gruters RA, Osterhaus ADME, Luider TM. Rapid Commun. Mass Spectrom. 2009;23(8):1183–1188. doi: 10.1002/rcm.3981. [DOI] [PubMed] [Google Scholar]
- 11.Speight JG. Lange's Handbook of Chemistry (16th Edition) McGraw-Hill; 2005. [Google Scholar]
- 12.Cornett DS, Mobley JA, Dias EC, Andersson M, Arteaga CL, Sanders ME, Caprioli RM. Mol. Cell. Proteomics. 2006;5(10):1975–1983. doi: 10.1074/mcp.M600119-MCP200. [DOI] [PubMed] [Google Scholar]
- 13.Ansgar Poetsch, Daniela Schlüsener, Christine Florizone, Lindsay Eltis, Christoph Menzel, Matthias Rögner, Kerstin Steinert, Roth U. The Journal of Biomolecular Techniques. 2008;19(2):129–138. [PMC free article] [PubMed] [Google Scholar]


