Abstract
Localization of the modification sites on peptides is challenging, particularly when multiple modifications or mixtures of localization isomers (variants) are involved. Such variants commonly coelute in liquid chromatography and may be undistinguishable in tandem mass spectrometry (MS/MS) for lack of unique fragments. Here, we have resolved the variants of singly and doubly phosphorylated peptides employing drift tube ion mobility spectrometry (IMS) coupled to time-of-flight mass spectrometry. Even with a moderate IMS resolving power of ~80, substantial separation was achieved for both 2+ and 3+ ions normally generated by electrospray ionization, including for the variant indistinguishable by MS/MS. Variants often exhibit a distribution of 3-D conformers, which can be adjusted for optimum IMS separation by prior field heating of ions in a funnel trap. The peak assignments were confirmed using MS/MS after IMS separation, but known species could be identified using just the ion mobility ‘tag”. Avoiding the MS/MS step lowers the detection limit of localization variants to <100 attomoles, an order of magnitude better than that provided by electron transfer dissociation in an Orbitrap MS.
Introduction
The focus of proteomics is increasingly shifting to post-translational modifications (PTM) of proteins and their biological roles.1 Arguably, the most important and extensively studied PTM is phosphorylation.2 A phosphate group may add at many acidic and basic amino acids, but in eukaryotes only at hydroxyamino acids - serine (S), threonine (T), and tyrosine (Y) with approximately 84%, 14%, and 2.4% of all instances, respectively.4 Those three sum to 16% of residues in the proteins and phosphorylation is ubiquitous, with ~1/3 of cellular proteins phosphorylated at least once.1,3 Phosphorylation processes are crucial to cell signaling and protein regulation.5-7 Phosphorylation is substoichiometric: typically, only a (small) fraction of proteins is modified at any given site. Hence phosphorylated peptides tend to be low-abundant compared to others in protein digests, and their detection and quantification is a challenge that normally requires enrichment for effective LC-MS/MS analyses.8,9
Many if not most phosphoproteins feature more than one phosphate and thus may yield multiply phosphorylated peptides. In proteolytic digests of benchmark human and bacterial whole-cell proteomes, ~40 - 70% of sequenced phosphopeptides are phosphorylated more than once1,4 and some feature four or five suitable sites.10,11 However, not every potential site is modified, and most that are modified undergo incomplete phosphorylation as discussed above. This results in ubiquitous variant phosphorylation, where proteins or peptides include the same total number of phosphate groups, but in different locations.10-13 Such isomers may co-exist in cells and have distinct properties and biological function; site-directed mutagenesis to deduce the modification purpose requires knowing the attachment site.14 Hence localization of phosphorylations (or other PTMs) is an important analytical objective.
The standard approach to localization of PTMs on peptides is tandem MS, employing collision-induced dissociation (CID)1,3,12,15 and/or electron capture/transfer dissociation (EC/TD).3,4,11-13,15-20 As an ergodic process, CID would much rather abstract relatively weakly bound PTMs than sever the peptide backbone but retain PTMs, while EC/TD has a modest efficiency and, indiscriminately cleaving the N-Cα backbone bonds, distributes the fragments into numerous channels. Hence the intensity of diagnostic fragments (and thus sensitivity) with either method is much lower than that for fragments of unmodified peptides used for sequencing, and typically lower than that of parent ions by ~102 - 103 times (depending on the number of residues). The ion activation needed for CID can also shift PTMs along the backbone or lead to other rearrangements, potentially causing incorrect assignments.3,21,22 The number of distinguishing fragment pairs with either CID or ETD equals the number of residues between the alternative modified sites plus one, and the variants involving adjacent sites differ in just one fragment pair. Typical MS/MS spectra miss some fragments. In conjunction with activation-induced rearrangements, that may make localization to a single site in a group of nearby options exceedingly difficult and the PTM is instead assigned to a region.3
Peptides comprising three or more possible attachment sites present further problem:11,18,20 at least one variant is, in principle, indistinguishable by MS/MS from the mixture of two others yielding the same fragment set. Indeed, a mixture of X1mZX2ZX3ZX4 (A), X1ZX2mZX3ZX4 (B), and X1ZX2ZX3mZX4 (C) (where X1-4 and Z are arbitrary residues and m is a modification of Z) produces fragments unique for A and C, but not B. (For example, the c2 fragment of A is unique, but those of B and C are identical; the z2 fragment of C is unique, but those of A and B are identical.)23 Similarly for doubly modified species, X1mZX2ZX3mZX4 has same fragments as a mixture of X1mZX2mZX3ZX4 and X1ZX2mZX3mZX4. This situation is not rare: ~5 - 10% of phosphopeptides carry three or more phosphates,1,4 and many more have at least three addition sites. Such variants can possibly be distinguished3,10 by MS3 using CID, at the cost of signal loss by another order of magnitude and often more. For ETD, the second step is normally precluded by charge reduction, as well as low fragment intensity, after the first step.
The above difficulties of applying MS/MS to localization of PTMs make separating and identifying the variants based on the original peptide properties (i.e., without fragmentation) appealing. However, conventional reverse-phase liquid chromatography (LC) is usually unable to separate isomeric phosphopeptides, as the weak interaction between a polar phosphate and hydrophobic stationary phase leads to a negligible differential effect for localization isomers that thus co-elute. A derivative of normal-phase LC called hydrophilic interaction chromatography (HILIC)24 using a hydroxyl or amino-based stationary phase can work better, and some variant singly and multiply phosphorylated peptides can be eluted and separated upon optimization of the stationary and mobile phases.25 Still, only some isomers could be resolved even under the best conditions,25 and large variation of absolute LC elution times (especially between columns) impedes the assignment based on those times. As liquid-phase methods, LC separations also take a substantial time10,25 that limits the instrumental throughput.
An increasingly common alternative to LC is separations in gases utilizing ion mobility spectrometry (IMS), including conventional IMS26 based on the absolute ion mobility (K) in electric fields of moderate strength (E) and differential or field asymmetric waveform IMS (FAIMS)27,28 relying on the increment of K as a function of E. As the gas-phase transport of ions and their affinity to stationary or mobile LC phases are physically unrelated, both conventional and differential IMS separations are substantially orthogonal to LC methods.29 Transposition of a PTM on a peptide must affect its conformation and thus transport properties, hence IMS methods should separate localization isomers at least to some extent. The utility of FAIMS to separate phosphopeptides was evaluated for the variants of singly and doubly modified synthetic peptide APLS1FRGS2LPKS3YVK: namely pS1 (1), pS2 (2), pS3 (3), pS1pS2 (4), and pS1pS3 (5), for which ESI generates 2+ and 3+ ions.30 Some of the species 1, 2, and 3 could be separated in part using a commercial FAIMS stage with a curved gap,23 while a custom unit of planar geometry provided baseline resolution of (1, 2, 3) and (4, 5) sets.30,31 However, use of FAIMS in real-world analyses of modified peptides is complicated by sensitivity issues: (i) as a scanning technique, FAIMS has a fundamental duty cycle constraint that is significant when covering a wide separation range,27 and (ii) the ion transmission through and from present high-resolution FAIMS devices is ~1% or less.30
Conventional IMS may be engineered as drift tube (DT) IMS that employs a static uniform field26 or traveling-wave (TW) IMS where ions are separated while “surfing” a periodic potential wave propagated along a tube.32 Both are dispersion methods that can acquire the mobility spectrum at once, with theoretically excellent ion utilization and speed that allows “nesting” between normally operated LC and time-of-flight (TOF) MS stages.33 However, current TWIMS implementations have a limited and often insufficient resolving power, at most R ~ 40 in the Synapt G2 TWIMS/TOF instrument. For the above phosphopeptides, 3 could be marginally separated from 1 exploiting a minor conformer, but not vice versa.34
An advantage of DTIMS is the resolving power (R) higher than that for TWIMS (and comparable to that for FAIMS),35,36 and direct measurement of the absolute K and thus the ion-molecule collision integral Ω that can be related to ion geometries via mobility calculations.26,37 Since the 1970-s, DTIMS has been extensively deployed for separation and structural elucidation of the isomers of simple organic molecules, atomic and molecular clusters, and later, peptides, proteins, metabolites, carbohydrates, glycans, and supramolecular complexes.26,38-44 The major deficiency of ESI/DTIMS/MS platforms has been low sensitivity due to inefficient conversion of continuous ion beams generated by ESI into short packets required for injection into DTIMS and poor ion transmission at the DTIMS/MS interface.45 These problems have recently been overcome by using ion funnels and ion funnel traps (IFT) at both drift tube termini46,47 and/or multiplexing the IMS process,48-50 which has dramatically raised sensitivity. Here we demonstrate that DTIMS with R ~ 100 can effectively separate localization isomers of singly and multiply modified peptides, and identify them with sensitivity superior to MS/MS methods.
Experimental procedure
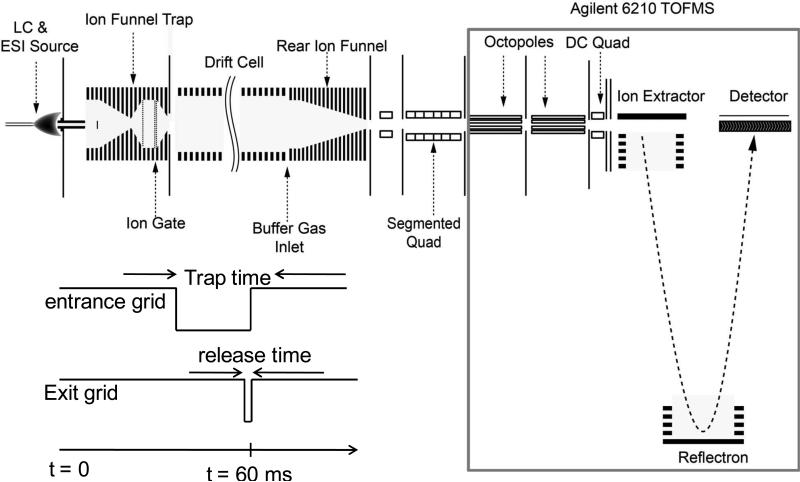
Experiments employed a previously described ESI/DTIMS/TOF MS system47,50 using a commercial TOF platform (model 6224, Agilent, Santa Clara, CA), with slight modifications. A schematic diagram of the platform is shown in Fig. 1. As the focus here is on characterization of pure phosphopeptides (or their simple equimolar mixtures) at low concentrations where the IFT charge capacity is saturated only after accumulation for tac ~50 ms vs. 60 ms for the DTIMS cycle, DTIMS has been operated in the signal averaging rather than multiplexing mode. In real analyses involving complex peptide mixtures with a wide dynamic range, multiplexing would be of benefit.48,49 Briefly, ions generated by ESI are desolvated in a capillary heated to 155 °C and stored in an IFT51 until injection into DTIMS in 0.2 ms pulses. Timing sequence for trapping and releasing of ions in the trap is shown in Fig.1. the Ions in an IFT oscillate in an rf field and are collisionally heated, which may cause isomerization (unfolding) of proteins and peptides.52 To explore the utility of such “annealing” for the separation of localization variants, tac was varied from 1 to 60 ms. A modular 98-cm long drift tube features axial E up to 18 V/cm and contains N2 at 4 Torr and 28 °C. Ions re-focused by the rear 2-in funnel exit the drift tube, pass a quadrupole of 3.5 cm length at a pressure of 0.2 Torr, a 7-cm long six-segment quadrupole at 0.1 Torr, and the front octopole of the TOF MS instrument. In the second quadrupole, ions can be subjected to CID at the energy defined by voltage drop between the segments 4 and 5, here 20 V. The addition of first quadrupole is an improvement over the previous system,50 implemented to reduce the pressure in segmented quadrupole for faster ion transit. With the TOF pusher rate of 10 kHz, 600 mass spectra fit within one IMS drift time distribution. The mobilities of various species were deduced from the IMS spectra by best linear fit to the peak centroids measured at E = 13, 15, 17, 19, 21 V/cm, and converted into the collision cross sections (Ω) using the Mason-Schamp equation.26 We have studied the peptides 1 - 5 above, synthesized by AltaBiosciences (Birmingham, UK). The samples were dissolved in 50/49/1 water/methanol/acetic acid in the concentrations of 0.5, 2, 5, 20, and 1000 nM, and infused into positive-mode ESI at 0.3 μL/min.
Fig. 1.
Schematic diagram of the IMS-TOF instrument. The inset shows the timing for the trap accumulation and release.
To benchmark the sensitivity of DTIMS/TOF, the peptides (1 - 3) were identified by ETD of 3+ ions on an Orbitrap Velos (ThermoFisher, Bremen, Germany). The fragment spectra were acquired in the high-resolution (FTMS) data-dependent mode, using the injection time of 100 ms and parent mass isolation window of 2 Da.
Results and discussion
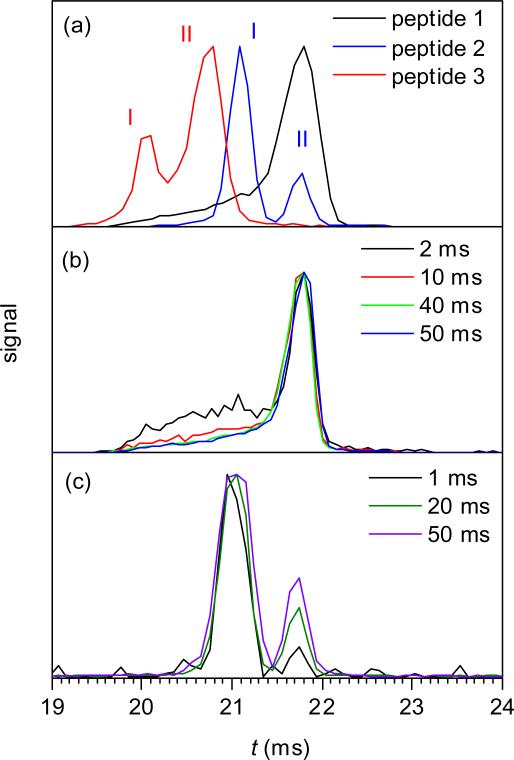
First, we have obtained the IMS spectra for 3+ ions of monophosphorylated peptides (1 - 3) using a sample concentration of 20 nM and maximum tac = 60 ms (Fig. 2a). All three exhibit at least two peaks, merged for 1 but resolved for 2 and 3, with the smaller Ω value belonging to the major conformer (for 2) or the minor one (for 1 or 3). The measured IMS resolving powers for major conformers are 46 (1), 79 (2), and 51 (3). To compare, the calculated values for 3+ ions under present conditions, accounting for the initial temporal packet width of 0.2 ms,52 are 81 - 83. Hence the major peak of 2 may represent a single species, while the major peaks of 1 and 3 contain multiple unresolved conformers. The major conformers of 1, 2, and 3 clearly differ, but the spectra overlap to some extent because of finite peak width and minor conformers.
Fig. 2.
IMS spectra for 3+ ions of monophosphorylated peptides (concentration of 20 nM): data for 1, 2, and 3 with the IFT storage time of 60 ms (a) and for 1 (b) and 2 (c), depending on the IFT storage time (as labeled).
The fraction of minor conformers in IMS spectra of peptides and proteins is often reduced upon heating prior to separation.53 Here, those conformers for 1 and 2 are suppressed by 3 - 4 times when tac is increased from 1 to 50 ms (Fig. 2 b, c) while the spectrum for 3 does not change, and maximizing the annealing time minimizes the overlaps between all three spectra. Each variant, at its major peak apex, can be separated from others to ~90% purity (Fig. 2a), and one can filter 1 from 3 or 3 from 2 (using the conformer I of 3) essentially in full. With any tac, some ions enter the IFT just before a packet release into IMS and thus are heated only briefly. Those “late” ions are likely a major reason why the minor peaks for 1 and 2 persist at the longest tac. Then “cooking” ions in the IFT for some time after stopping the arrival of new ones would probably reduce the interfering minor peaks, and thus improve the separation quality further.
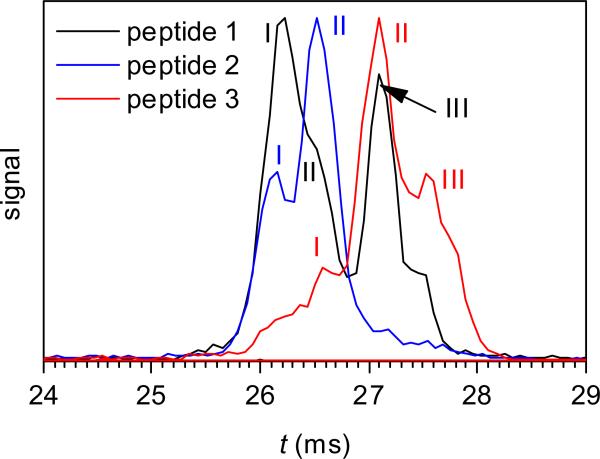
The IMS spectra for 2+ ions of same variants also differ, with at least three conformers seen for each (Fig. 3). As with FAIMS, the overall separation is worse than that for 3+ ions: one can filter, to ~90% purity, 3 from 2 or 1 from 3 (at the major peak apexes) and 1 from 2 or 2 from 3 (at the apexes of secondary but quite intense peaks), but cannot well separate 2 from 1 or 3 from 1. The order of mobilities for the major conformers of 1, 2 and 3 is opposite for 2+ and 3+ ions. In particular, 3 is more compact than 1 and 2 for 3+ ions but more unfolded than those for 2+ ions. Thus changing the charge distribution along the peptide backbone may invert the relative cross sections of different variants.
Fig. 3.
IMS spectra for 2+ ions of 1, 2, and 3 (concentration of 1 μM), using tac = 20 ms.
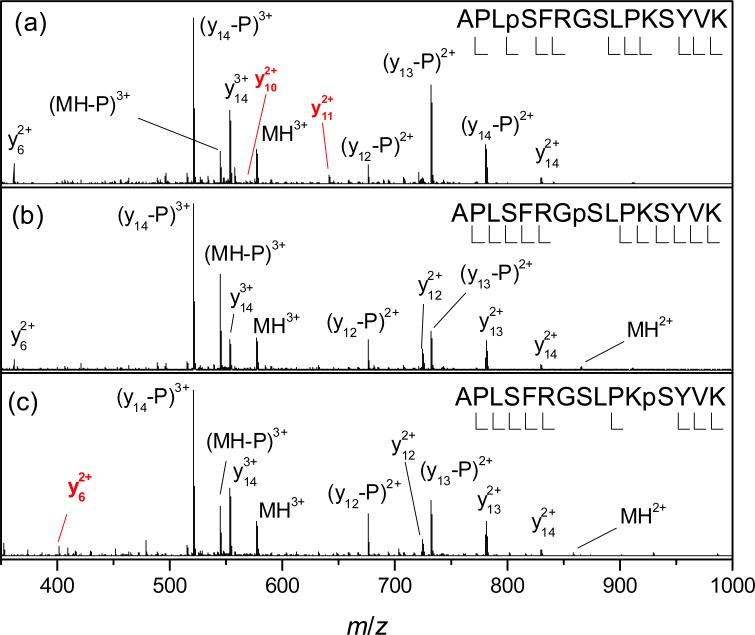
As has been noted in FAIMS spectra,30 one variant may feature a minor peak at same Ω as the major peak of another variant. The more prominent of such coincidences are peak II of 2 and the peak apex of 1 (for 3+ ions, Fig. 2a) and peak III of 1 and peak II of 3 (for 2+ ions, Fig. 3). The possible explanations are that (i) the two variants have abundant conformers with near-equal mobility, perhaps reflecting similar geometries or (ii) this is an artifact: the coincident peaks are due to identical species, as one variant contains an impurity of the other either initially, because of imperfections during synthesis (iia), PTM shift in solution or during ESI (iib) and/or ion heating in the IFT (iic). The hypotheses (iia) and (iib) are ruled out by the ratio of conformers I and II for 2 depending on tac (Fig. 2c). The supposition (iic) is inconsistent with the CID spectra of 2 containing no fragments y11 or y10 observed for 1 (Fig. 4). Hence the effect must be real, i.e., different variants frequently assume similar 3-D geometries. This paints a picture of several folds closely competing for the ion conformation, with the winner controlled by phosphate position. The effect of phosphorylation on folding is apparently subtle, as the cross sections of all 3+ ion conformers deviate from that for the unmodified peptide by just −2 to +5% (Table 1).
Fig. 4.
CID spectra for 3+ ions of (a) 1, (b) 2, and (c) 3 (concentration of 1 μM). For clarity, only selected fragments are labeled (in red for unique fragments)..
Table 1.
Cross sections for the features resolved in IMS spectra for 3+ ions of APLSFRGSLPKSYVK and its phosphorylated versions. The value for the major peak is underlined.
| Peptide | Ω, Å2 |
| Unmodified | 488 |
| 1 | 511 |
| 2 | 495, 511 |
| 3 | 477, 490 |
| 4 | 492 |
| 5 | 466 |
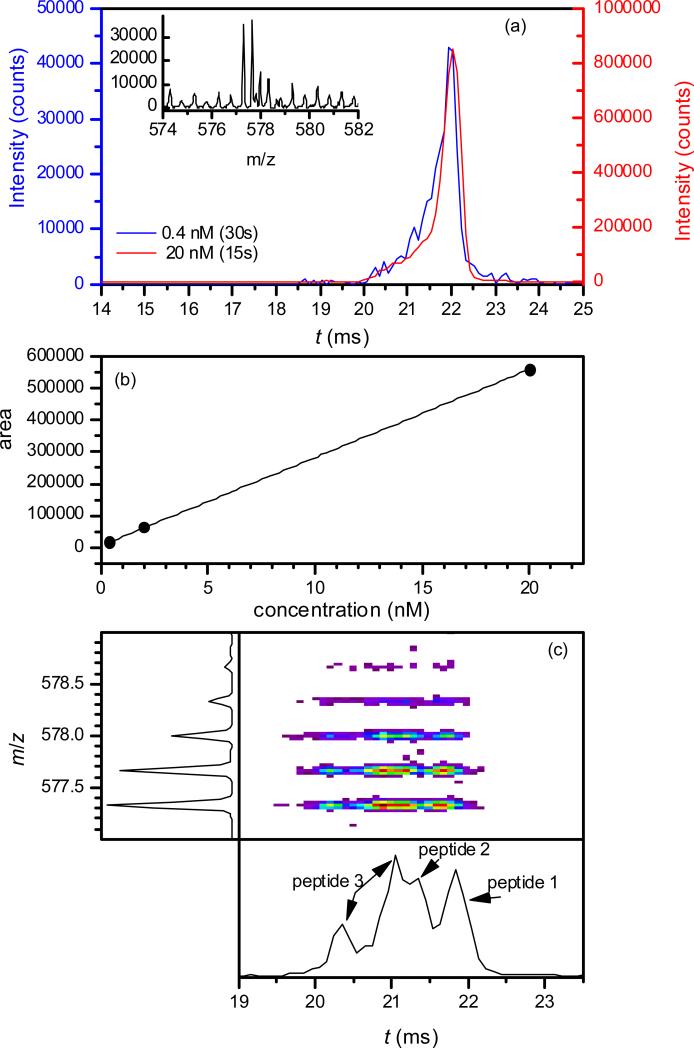
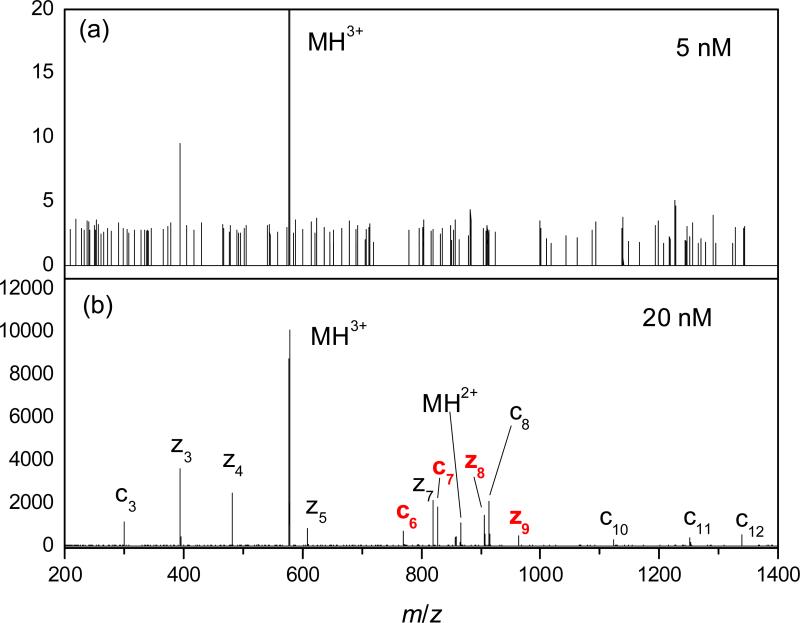
The present DTIMS/TOF platform is quite sensitive. For 1 - 3, the minimum concentration detectable upon averaging for 30 s (with the signal/background ratio of ~4 in the mass spectrum) was ~0.5 nM (Fig. 5a and Fig. S1 in supplementary materials), corresponding to the sample amount of 75 attomole or 0.13 pg. The decrease of concentration did not affect the IMS spectrum, enabling conclusive PTM localization already at the MS detection limit (Fig. 5a). The peak area was proportional to the concentration over the 0.5 - 20 nM range, permitting linear quantification (Fig. 5b). The consistency of established IMS separation for very small samples was further proven by analyses of binary and ternary variant mixtures in low concentrations (Fig. 5c). For comparison, the lowest concentration to yield ETD spectra allowing the identification of 1 - 3 over a similar acquisition period was between 5 and 20 nM (Fig. 6), or an order of magnitude greater. This is consistent with the signal loss of less than one order of magnitude in the IMS process, versus two or more orders in ETD. Hence DTIMS/TOF allows separation and identification of peptide localization isomers with exceptional sensitivity, better than that obtained using current CID and EC/TD methods which cannot separate different variants.
Fig. 5.
Detection limits for 3+ ions using tac = 60 ms: (a) IMS spectra for 1, obtained in 30 s for the concentration of 0.5 nM (blue line, left scale) or 15 s for 20 nM (red line, right scale) and (in the inset) the MS spectrum for 0.5 nM, summed over t = 19 - 24 ms; (b) peak area for 1 in the IMS spectrum, depending on the concentration; (c) 2-D IMS/MS spectrum and its IMS and MS dimensions, obtained in 15 s for the mixture of 1, 2, and 3 with 2 nM concentration (or the consumed amount of 150 attomoles) for each.
Fig. 6.
ETD spectra for the 3+ ions of 1 at (a) 5 nM and (b) 20 nM, acquired over 1 min. The unique fragments are labeled in red.
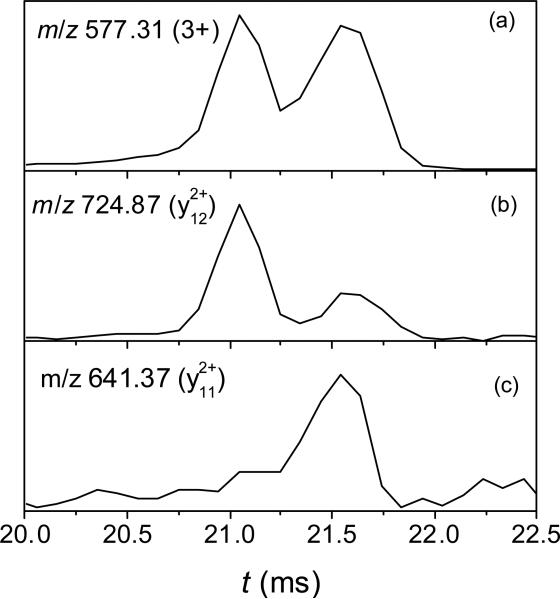
We have also verified the IMS performance using CID for the separated mixture of 3+ ions of 1 and 2 (Fig. 7). The IMS spectra at the m/z of fragment y12 is unique to 2 (Fig. 7b) and fragment y11 found for 1 but not 2 (Fig. 7c) match the measurements for their individual parents (Fig. 2a). Notably, the CID step is added without affecting the IMS/MS throughput. While such “parallel” IMS - CID of peptides is well known,54, its use for PTM localization is novel and appears promising for phosphoproteomic analyses, especially with the recent drastic gains in sensitivity.50
Fig. 7.
IMS spectra for (a) the mixture of 1 and 2 (concentration of 1 uM each); (b) the y12 fragment; (c) the y11 fragment.
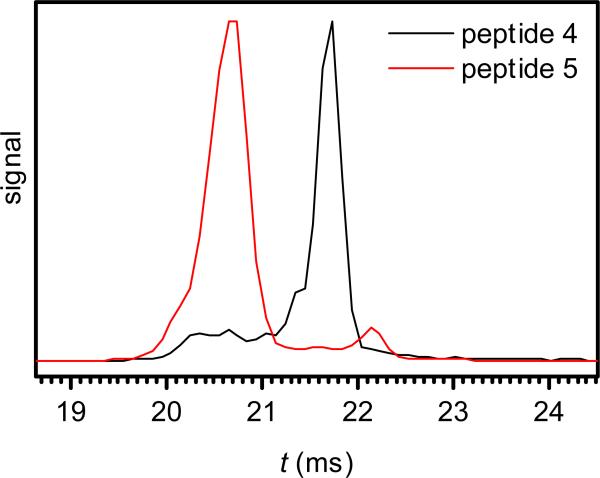
A special challenge for phosphoproteomics is presented by multiply modified peptides, because of their inefficient protonation due to high acidity,55 more complex fragmentation patterns, and often greater number of localization variants. For example, a peptide with 4 phosphorylation sites allows 4 monophosphorylated variants but 6 bisphosphorylated ones. While both 2+ and 3+ ions of the bisphosphorylated peptides 4 and 5 were baseline-separated by FAIMS,30,31 the needed resolving power was higher than that for monophosphorylated analogs. Here, we separated the 3+ ions of 4 and 5 by IMS to >90% at the peak apexes (Fig. 8), an outcome as good as that for any pair of (1, 2, 3). (These species also have mobilities close to that for the unmodified peptide, Table 1.) Hence, IMS may resolve multiply modified peptide variants as well as singly modified ones.
Fig. 8.
IMS spectra for bisphosphorylated peptides 4 and 5 (concentration of 1 μM), using tac = 10 ms.
For ions of unmodified tryptic peptides, the FAIMS and conventional IMS dimensions are substantially orthogonal and 2-D FAIMS/IMS provides much greater peak capacity than either stage alone.56 In contrast, the two dimensions are strongly correlated for multiply-charged proteins generated by ESI: compact geometries with small cross sections have high “compensation voltages” (CVs) in FAIMS, whereas unfolded conformers with high Ω have lower CVs.53,57 The Ω values of major conformers for 3+ ions decrease from 1 to 2 to 3 (Fig. 2), while CVs in FAIMS increase in the order 3, 1, 2 with maximum ion heating and 1, 3, 2 with moderate heating.30 For 2+ ions, 3 has the largest Ω value (Fig. 3) and lowest CV30 and the major conformers of 1 and 2 have similar Ω values and CVs. For the 3+ ions of 4 and 5, the more folded 5 (Fig. 8) also has the higher CV.30 These observations demonstrate an inverse correlation between Ω and CV resembling that for protein conformers, but (based on the data for monophosphorylated peptides) also show some independence between the FAIMS and conventional IMS dimensions.
Conclusions
Localization variants of singly and multiply modified peptides can largely be separated using drift-tube IMS with a moderate resolving power of R ~ 80. The separation for model phosphorylated peptides has been slightly less complete than that using FAIMS, perhaps reflecting its higher resolving power and generally greater orthogonality to MS.28,58 However, DTIMS/MS can be much more sensitive than current (high-resolution FAIMS)/MS platforms, allowing localization of phosphorylation sites for concentrations as low as 0.5 nM and amounts of 0.1 pg, with linear quantification essentially down to the detection limit. These values constitute about an order of magnitude improvement over the ETD approach, while allowing separation of localization variants. The needed analysis time is 30 s at the detection limit and proportionately less at higher concentrations, which is ~102 - 103 times faster than LC and particularly HILIC methods designed to resolve localization variants. The mobilities for all variants are highly reproducible and independent of the sample concentration, enabling assignments based only on the mobility “tag”. Features separated by DTIMS may also be identified or confirmed by MS/MS using CID in the IMS/TOF interface, though at a lower sensitivity. Field heating of ions in the funnel trap prior to DTIMS modifies the distribution of 3-D geometries for some variants, in particular decreasing the fraction of minor conformers. Hence separation of different variants may be improved by varying the accumulation time in the ion funnel trap.
Some DTIMS/TOF systems, including those with high sensitivity enabled by ion funnel interfaces, provide the IMS resolving power35,59,60 up to ~150 – 200 and would better separate the localization variants. The specificity of variant separation and identification could also be increased using FAIMS/IMS, at least partly because of the peptide unfolding upon field heating in FAIMS. Overall, the drift-tube IMS and multidimensional platforms built on it are promising new tools for sensitive and specific characterization of modified peptides in complex biological matrices.
Supplementary Material
Acknowledgement
We thank Professor Helen J. Cooper and Dr. Andrew J. Creese (University of Birmingham, UK) for sharing the phosphopeptide samples. This research was supported by the NIH National Center for Research Resources (RR18522 to RDS). Work was performed in the Environmental Molecular Science Laboratory, a U.S. Department of Energy (DOE) Office of Biological and Environmental Research (DOE/BER) national scientific user facility located on the campus of Pacific Northwest National Laboratory (PNNL) in Richland, Washington. PNNL is a multiprogram national laboratory operated by Battelle for the DOE under contract DE-AC05-76RLO-1830.
References
- 1.Ficarro SB, McCleland ML, Stukenberg PT, Burke DJ, Ross MM, Shabanowitz J, Hunt DF, White FM. Nat. Biotechnol. 2002;20:301–305. doi: 10.1038/nbt0302-301. [DOI] [PubMed] [Google Scholar]
- 2.Collins MA, Yu L, Choudhary JS. Proteomics. 2007;7:2751–2768. doi: 10.1002/pmic.200700145. [DOI] [PubMed] [Google Scholar]
- 3.Boersema PJ, Mohammed S, Heck AJR. J. Mass Spectrom. 2009;44:861–878. doi: 10.1002/jms.1599. [DOI] [PubMed] [Google Scholar]
- 4.Molina H, Horn DM, Tang N, Mathivanan S, Pandey A. Proc. Natl. Acad. Sci. U.S.A. 2007;104:2199–2204. doi: 10.1073/pnas.0611217104. [DOI] [PMC free article] [PubMed] [Google Scholar]
- 5.Hunter T. Cell. 2000;100:113–127. doi: 10.1016/s0092-8674(00)81688-8. [DOI] [PubMed] [Google Scholar]
- 6.Graves JD, Krebs EG. Pharmacol. Ther. 1999;82:111–121. doi: 10.1016/s0163-7258(98)00056-4. [DOI] [PubMed] [Google Scholar]
- 7.Olsen JV, Blagoev B, Gnad F, Macek B, Kumar C, Mortensen P, Mann M. Cell. 2006;127:635–648. doi: 10.1016/j.cell.2006.09.026. [DOI] [PubMed] [Google Scholar]
- 8.Dunn JD, Reid GE, Bruening ML. Mass Spectrom. Rev. 2010;29:29–54. doi: 10.1002/mas.20219. [DOI] [PubMed] [Google Scholar]
- 9.Han G, Ye M, Zou H. Analyst. 2008;133:1128–1138. doi: 10.1039/b806775a. [DOI] [PubMed] [Google Scholar]
- 10.Langlais P, Mandarino LJ, Yi Z. J. Am. Soc. Mass Spectrom. 2010;21:1490–1499. doi: 10.1016/j.jasms.2010.05.009. [DOI] [PMC free article] [PubMed] [Google Scholar]
- 11.Sweet SMM, Mardakheh FK, Ryan KJP, Langton AJ, Heath JK, Cooper HJ. Anal. Chem. 2008;80:6650–6657. doi: 10.1021/ac800963a. [DOI] [PubMed] [Google Scholar]
- 12.Chi A, Huttenhower C, Geer LY, Coon JJ, Syka JEP, Bai DL, Shabanowitz J, Burke DJ, Troyanskaya OG, Hunt DF. Proc. Natl. Acad. Sci. USA. 2007;104:2193–2198. doi: 10.1073/pnas.0607084104. [DOI] [PMC free article] [PubMed] [Google Scholar]
- 13.Cunningham DL, Sweet SMM, Cooper HJ, Heath JK. J. Prot. Res. 2010;9:2317–2328. doi: 10.1021/pr9010475. [DOI] [PMC free article] [PubMed] [Google Scholar]
- 14.Loyet KM, Stults JT, Arnott D. Mol. Cell. Proteomics. 2005;4:235–245. doi: 10.1074/mcp.R400011-MCP200. [DOI] [PubMed] [Google Scholar]
- 15.Gerber SA, Rush J, Stemman O, Kirschner MW, Gygi SP. Proc. Natl. Acad. Sci. USA. 2003;100:6940–6945. doi: 10.1073/pnas.0832254100. [DOI] [PMC free article] [PubMed] [Google Scholar]
- 16.Creese AJ, Cooper HJ. J. Am. Soc. Mass Spectrom. 2008;19:1263–1274. doi: 10.1016/j.jasms.2008.05.015. [DOI] [PMC free article] [PubMed] [Google Scholar]
- 17.Zubarev RA, Zubarev AR, Savitski MM. J. Am. Soc. Mass Spectrom. 2008;19:753–761. doi: 10.1016/j.jasms.2008.03.007. [DOI] [PubMed] [Google Scholar]
- 18.Woodling KA, Eyler JR, Tsybin YO, Nilsson CL, Marshall AG, Edison AS, Al-Naggar IM, Bubb MR. J. Am. Soc. Mass Spectrom. 2007;18:2137–2145. doi: 10.1016/j.jasms.2007.09.010. [DOI] [PubMed] [Google Scholar]
- 19.Swaney DL, McAlister GC, Wirtala M, Schwartz JC, Syka JEP, Coon JJ. Anal. Chem. 2007;79:477–485. doi: 10.1021/ac061457f. [DOI] [PMC free article] [PubMed] [Google Scholar]
- 20.Sweet SMM, Bailey CM, Cunningham DL, Heath JK, Cooper HJ. Mol. Cell. Proteomics. 2009;8:904–912. doi: 10.1074/mcp.M800451-MCP200. [DOI] [PMC free article] [PubMed] [Google Scholar]
- 21.Palumbo A, Reid GE. Anal. Chem. 2008;80:9735–9743. doi: 10.1021/ac801768s. [DOI] [PubMed] [Google Scholar]
- 22.Edelson-Averbukh M, Shevchenko A, Pipkorn R, Lehmann WD. Anal. Chem. 2009;81:4369–4381. doi: 10.1021/ac900244e. [DOI] [PubMed] [Google Scholar]
- 23.Xuan Y, Creese AJ, Horner JA, Cooper HJ. Rapid Commun. Mass Spectrom. 2009;23:1963–1969. doi: 10.1002/rcm.4101. [DOI] [PubMed] [Google Scholar]
- 24.Alpert AJ. J. Chromatogr. 1990;499:177–196. doi: 10.1016/s0021-9673(00)96972-3. [DOI] [PubMed] [Google Scholar]
- 25.Singer D, Kuhlmann J, Muschket M, Hoffman R. Anal. Chem. 2010;82:6409–6414. doi: 10.1021/ac100473k. [DOI] [PubMed] [Google Scholar]
- 26.Eiceman GA, Karpaz Z. Ion Mobility Spectrometry. CRC Press; Boca Raton, FL: 2005. [Google Scholar]
- 27.Guevremont R. J. Chromatogr. A. 2004;1058:3–19. [PubMed] [Google Scholar]
- 28.Shvartsburg AA. Differential Ion Mobility Spectrometry. CRC Press; Boca Raton, FL: 2008. [Google Scholar]
- 29.Liu C, Valentine SJ, Plasencia MD, Trimpin S, Naylor S, Clemmer DE. J. Am. Soc. Mass Spectrom. 2007;18:1249–1264. doi: 10.1016/j.jasms.2007.04.012. [DOI] [PMC free article] [PubMed] [Google Scholar]
- 30.Shvartsburg AA, Creese AJ, Smith RD, Cooper HJ. Anal. Chem. 2010;82:8327–8334. doi: 10.1021/ac101878a. [DOI] [PMC free article] [PubMed] [Google Scholar]
- 31.Shvartsburg AA, Smith RD. Anal. Chem. 2011;83:23–29. doi: 10.1021/ac202386w. [DOI] [PMC free article] [PubMed] [Google Scholar]
- 32.Pringle SD, Giles K, Wildgoose JL, Williams JP, Slade SE, Thalassinos K, Bateman RH, Bowers MT, Scrivens JH. Int. J. Mass Spectrom. 2007;261:1–12. [Google Scholar]
- 33.Srebalus Barnes CA, Hilderbrand AE, Valentine SJ, Clemmer DE. Anal. Chem. 2002;74:26–36. doi: 10.1021/ac0108562. [DOI] [PubMed] [Google Scholar]
- 34.Cooper HJ, Brown J, Campuzano IDG, Tomczyk N, Creese AJ, Williams JP. Proceedings of the 58th ASMS Meeting; Salt Lake City. 2010. [Google Scholar]
- 35.Srebalus CA, Li J, Marshall WS, Clemmer DE. Anal. Chem. 1999;71:3918–3927. doi: 10.1021/ac9903757. [DOI] [PubMed] [Google Scholar]
- 36.Shvartsburg AA, Prior DC, Tang K, Smith RD. Anal. Chem. 2010;82:7649–7655. doi: 10.1021/ac101413k. [DOI] [PMC free article] [PubMed] [Google Scholar]
- 37.Shvartsburg AA, Schatz GC, Jarrold MF. J. Chem. Phys. 1998;108:2416–2423. [Google Scholar]
- 38.Shvartsburg AA, Hudgins RR, Dugourd P, Jarrold MF. Chem. Soc. Rev. 2001;30:26–35. [Google Scholar]
- 39.Wu C, Siems WF, Klasmeier J, Hill HH. Anal. Chem. 2000;72:391–395. doi: 10.1021/ac990601c. [DOI] [PubMed] [Google Scholar]
- 40.Clemmer DE, Hudgins RR, Jarrold MF. J. Am. Chem. Soc. 1995;117:10141–10142. [Google Scholar]
- 41.Dwivedi P, Schultz AJ, Hill HH. Int. J. Mass Spectrom. 2010;298:78–90. doi: 10.1016/j.ijms.2010.02.007. [DOI] [PMC free article] [PubMed] [Google Scholar]
- 42.Fenn LS, McLean JA. Phys. Chem. Chem. Phys. 2011 doi: 10.1039/c0cp01414a. doi: 10.1039/C0CP01414A. [DOI] [PubMed] [Google Scholar]
- 43.Williams JP, Grabenauer M, Holland RJ, Carpenter CJ, Wormald MR, Giles K, Harvey DJ, Bateman RH, Scrivens JH, Bowers MT. Int. J. Mass Spectrom. 2010;298:119–127. [Google Scholar]
- 44.Baker ES, Bushnell JE, Wecksler SR, Lim MD, Manard MJ, Dupuis NF, Ford PC, Bowers MT. J. Am. Chem. Soc. 2005;127:18222–18228. doi: 10.1021/ja0553699. [DOI] [PubMed] [Google Scholar]
- 45.Hoaglund-Hyzer CS, Lee YJ, Counterman AE, Clemmer DE. Anal. Chem. 2002;74:992–1006. doi: 10.1021/ac010837s. [DOI] [PubMed] [Google Scholar]
- 46.Tang K, Shvartsburg AA, Lee HN, Prior DC, Buschbach MA, Li F, Tolmachev AV, Anderson GA, Smith RD. Anal. Chem. 2005;77:3330–3339. doi: 10.1021/ac048315a. [DOI] [PMC free article] [PubMed] [Google Scholar]
- 47.Clowers BH, Ibrahim YM, Prior DC, Danielson WF, Belov ME, Smith RD. Anal. Chem. 2008;80:612–623. doi: 10.1021/ac701648p. [DOI] [PMC free article] [PubMed] [Google Scholar]
- 48.Belov ME, Buschbach MA, Prior DC, Tang K, Smith RD. Anal. Chem. 2007;79:2451–2462. doi: 10.1021/ac0617316. [DOI] [PMC free article] [PubMed] [Google Scholar]
- 49.Belov ME, Clowers BH, Prior DC, Danielson WF, Liyu AV, Petritis BO, Smith RD. Anal. Chem. 2008;80:5873–5883. doi: 10.1021/ac8003665. [DOI] [PMC free article] [PubMed] [Google Scholar]
- 50.Ibrahim YM, Prior DC, Baker ES, Smith RD, Belov ME. Int. J. Mass Spectrom. 2010;293:34–44. doi: 10.1016/j.ijms.2010.03.009. [DOI] [PMC free article] [PubMed] [Google Scholar]
- 51.Ibrahim Y, Belov ME, Tolmachev AV, Prior DC, Smith RD. Anal. Chem. 2007;79:7845–7852. doi: 10.1021/ac071091m. [DOI] [PMC free article] [PubMed] [Google Scholar]
- 52.Siems WF, Wu C, Tarver EA, Hill HH, Larsen PR, McMinn DG. Anal. Chem. 1994;66:4195–4201. [Google Scholar]
- 53.Shvartsburg AA, Li F, Tang K, Smith RD. Anal. Chem. 2006;78:3304–3315. doi: 10.1021/ac060283z. [DOI] [PubMed] [Google Scholar]
- 54.Hoaglund-Hyzer CS, Li J, Clemmer DE. Anal. Chem. 2000;72:2737–2740. doi: 10.1021/ac0000170. [DOI] [PubMed] [Google Scholar]
- 55.Liu S, Zhang C, Campbell JL, Zhang H, Yeung KKC, Han VKM, Lajoie GA. Rapid Commun. Mass Spectrom. 2005;19:2747–2756. doi: 10.1002/rcm.2105. [DOI] [PubMed] [Google Scholar]
- 56.Tang K, Li F, Shvartsburg AA, Strittmatter EF, Smith RD. Anal. Chem. 2005;77:6381–6388. doi: 10.1021/ac050871x. [DOI] [PMC free article] [PubMed] [Google Scholar]
- 57.Purves RW, Barnett DA, Ells B, Guevremont R. J. Am. Soc. Mass Spectrom. 2000;8:738–745. doi: 10.1016/S1044-0305(00)00136-7. [DOI] [PubMed] [Google Scholar]
- 58.Guevremont R, Barnett DA, Purves RW, Vandermey J. Anal. Chem. 2000;72:4577–4584. doi: 10.1021/ac0000271. [DOI] [PubMed] [Google Scholar]
- 59.Koeniger SL, Merenbloom SI, Valentine SJ, Jarrold MF, Udseth HR, Smith RD, Clemmer DE. Anal. Chem. 2006;78:4161–4174. doi: 10.1021/ac051060w. [DOI] [PubMed] [Google Scholar]
- 60.Merenbloom SI, Koeniger SL, Valentine SJ, Plasencia MD, Clemmer DE. Anal. Chem. 2006;78:2802–2809. doi: 10.1021/ac052208e. [DOI] [PubMed] [Google Scholar]
Associated Data
This section collects any data citations, data availability statements, or supplementary materials included in this article.


