

Abstract
Background
Intense efforts are underway to evaluate neuroimaging measures as biomarkers for neurodegeneration in premanifest Huntington’s disease (preHD). We used a completely automated longitudinal analysis method to compare structural scans in preHD and controls.
Methods
Using a one-year longitudinal design, we analyzedT1-weighted structural scans in 35 preHD individuals and 22 age-matched controls. We used the SIENA software tool (Structural Image Evaluation, using Normalization, of Atrophy) to yield overall Percentage Brain Volume Change (PBVC) and voxel-level changes in atrophy. We calculated sample sizes for a hypothetical disease modifying (neuroprotection) study.
Results
We found significantly greater yearly atrophy in preHD vs. controls (Mean PBVC controls = −0.149%; preHD = −0.388%; p=.031, Cohen’s d=.617). For a preHD subgroup closest to disease onset, yearly atrophy was over three times that of controls (Mean PBVC close-to-onset preHD = −0.510%; p=.019, Cohen’s d=.920). This atrophy was evident at the voxel level in periventricular regions – consistent with well-established preHD basal ganglia atrophy. We estimated that a neuroprotection study using SIENA would only need 74close-to-onset individuals in each arm (treatment vs. placebo) to detect a 50% slowing in yearly atrophy with80% power.
Conclusions
Automated whole-brain analysis of structural MRI can reliably detect preHD disease progression over one year. These results were attained with a readily available imaging analysis tool – SIENA – which is observer-independent, automated, and robust with respect to image quality, slice thickness, and different pulse sequences. This MRI biomarker approach could be used to evaluate neuroprotection in preHD.
Keywords: MRI biomarker, Premanifest HD, Longitudinal atrophy
INTRODUCTION
The discovery of the Huntington’s disease (HD) triplet repeat gene expansion1 makes possible the early identification of individuals who will eventually develop manifest HD. Intense efforts are underway to develop disease modifying therapies to slow down or prevent neurodegeneration in Huntington’s disease2–7. Such efforts aim to halt disease progression long before any motor, cognitive, or affective symptoms emerge in gene-positive HD individuals. Consequently, there is an urgent need for biomarkers such as MRI that may be able to detect the degree of neurodegeneration during the premanifest stage of the disease (preHD)8–11. There are several desiderata for MRI biomarkers if they are to be useful for multi-center trials. MRI acquisition should be standard (e.g. a typical high resolution T1 scan), and image analysis should be fully automated with readily available tools that are robust to differences in pulse sequences and image quality. Moreover, an MRI biomarker that meets these criteria must also be shown capable of detecting longitudinal change over the shortest possible period.
There are few longitudinal MRI results in preHD, and even fewer use observer-independent, automated analysis methods. A nearly longitudinal study in preHD demonstrated significant decreases in striatal volumes at intervals shorter than two years12. Subsequent results suggested that striatal degeneration occurs non-linearly, with a precipitous increase in atrophy occurring a decade before estimated diagnosis13. These longitudinal studies, which used manually drawn regions-of-interest, have been complemented by more recent studies using automated segmentation of the striatum14, 15. However, the striatum is not the only structure altered in preHD. Cross-sectional studies comparing preHD and controls have shown cortical thinning16, cortical gray matter intensity changes17, 18, white-matter volume and integrity reductions18–20, and decreases in cortical glucose metabolism19. Thus, a longitudinal MRI biomarker is needed with wider sensitivity to these changes, and a whole-brain measure may serve this role. A few whole-brain, automated, longitudinal studies in preHD have been performed, demonstrating changes in white matter (fractional volume and anisotropy)19–21 and glucose metabolism19. However, these findings were observed in relatively small samples, and were not always compared to controls. A promising approach is automated, unbiased whole-brain analysis of atrophy.
We evaluated the utility of the software tool SIENA (Structural Image Evaluation, using Normalization, of Atrophy)22, 23 for characterizing longitudinal changes in brain volume in preHD over the course of one year. SIENA is capable of detecting genuine change across time that is not confounded by registration, smoothing, and other processing steps. Briefly, SIENA performs subject-specific registration whereby the scans from the two timepoints are aligned. Brain edges in each image are then identified using segmentation, and the displacement between edge images is used to estimate atrophy. SIENA has several important strengths: it is completely automated (reducing labor intensiveness and obviating inter-rater reliability concerns), whole-brain based (obviating regions-of-interest), and robust to image quality, slice thickness, and different pulse sequences22. Thus SIENA meets the criteria for biomarker use in multi-center longitudinal studies. First, however, it is important to establish whether this approach can in fact detect neurodegeneration in preHD over a period as short as one year.
METHODS
Participants
All participants were recruited from the Huntington’s Disease Center of Excellence at the University of California, San Diego. At the start of the study (July 2008) we recruited 37 participants who tested positive for the HD gene expansion yet did not fulfill diagnostic criteria for clinical HD (preHD) and 22 healthy age-and sex-matched control participants. The control group, which was recruited from the friends and spouses of participants with preHD, reported no psychiatric or neurological history and no use of psychoactive substances. Participants provided written consent in accordance with an Institutional Review Board protocol of the University of California, San Diego. Participants were studied longitudinally, on two visits, with an average interval between visits of approximately one year(Table 1).
Table 1.
Participant characterization by group
| Controls (N=22) | PreHD (N=35) | |||
|---|---|---|---|---|
| Timepoint 1 | Timepoint 2 | Timepoint 1 | Timepoint 2 | |
| Age at start (yrs, mean ± SD) | 40.1 ± 12.2 | 40.8 ± 10.2 | ||
| Sex (F/M) | 15/7 | 20/15 | ||
| Between-scan interval (yrs, mean ± SD} | 1.0 ± .1 | 1.0 ± .1 | ||
| MMSE (mean ± SD) * | 28.8 ± 1.4 | 28.4 ± 1.7 | 29.2 ± 1.0 | 28.4 ± 1.5 |
| Number of CAG repeats (mean ± SD) [range] | N/A | 42.4 ± 2.4 [38–48] | ||
| Estimated years-to- onset, Aylward method (yrs, mean ± SD) | N/A | 5.8 ± 6.9 | ||
| Estimated years-to- onset, Langbehn method (yrs, mean ± SD) | N/A | 14.0 ± 7.0 | ||
| UHDRS motor score (mean ± SD) ** | 0.1 ± 0.3 | N/A | 1.6 ± 1.8 | 3.9 ± 4.6 |
| UHDRS confidence score (score: # of participants) | 0: 22 | N/A |
0: 23 1: 12 |
0: 15 1: 10 2: 9 3: 1 |
SD = standard deviation, MMSE = Mini-mental state exam, CAG = cytosine-adenine-guanine, UHDRS = Unified Huntington’s Disease Rating Scale, PreHD = preclinical Huntington’s disease, N/A = not applicable
ANOVA revealed main effect of time (p=.010) but no effect of group.
significantly different between groups at timepoint 1(p<.001) and between timepoints in preHD group (p=.003). UHDRS was not obtained for controls at timepoint 2.
Global cognitive ability was measured using the Mini-Mental State Exam (MMSE)24 at both timepoints. A movement disorder specialist (JCB) evaluated the preHD participants with the Unified Huntington’s Disease Rating Scale24, 25. Using this scale, the neurologist assessed each participant for motor abnormalities to determine a ‘motor score’ (range: 0 to 124) and then assigned a rating from 0 to 4 indicating the level of confidence that the presenting motor abnormalities represent symptoms of HD. A confidence rating of 0 represents a normal evaluation and no motor abnormalities, a rating of 1 represents < 50% confidence of an HD diagnosis, and a rating of 4 represents a definitive diagnosis of HD. UHDRS scores were obtained from all participants at timepoint one and only from preHD participants at timepoint two. All participants at timepoint one were rated below 2, confirming their preHD status(Table 1). At the second timepoint, two participants from the preHD group were rated 4, indicating conversion to manifest Huntington’s disease. These two participants were removed from the primary statistical analyses, leaving a preHD group of 35 participants.
Participants were defined as gene-expansion positive if they had one allele with 38or more cytosine-adenine-guanine (CAG)repeats. Repeat size was determined by the UCSD Medical Genetics laboratory using a polymerase chain reaction assay (accuracy of analysis to determine repeat size: 99%). The length of the CAG repeat expansion was used to calculate estimated years-to-onset(YTO) using two different methods. The Aylward method uses all of CAG repeat length, current age, and parental age of onset in a simple regression equation26, whereas the method of Langbehn and colleagues uses only CAG repeat length and current age in a parametric survival model27.
MR Image acquisition and pre-processing
Data were acquired with a General Electric (Milwaukee, WI, USA) 1.5 T EXCITE HD scanner with an 8-channel phased-array head coil. Image acquisition included a General Electric “PURE” calibration sequence and a high-resolution three-dimensional T1-weighted sequence (echo time = 2.798 msec, repetition time = 6.496 msec, inversion time = 600 msec, flip angle = 12°, bandwidth = 244.141 Hz/pixel, field of view = 24 cm, matrix = 256 × 192, slice thickness = 1.2 mm). T1-images were corrected for non-linear warping using tools developed by the Morphometry Biomedical Informatics Research Network.
Quantifying volumetric change using SIENA
We computed Percentage Brain Volume Change (PBVC)for each participant using SIENA22, 23 –part of the FSL suite of tools28, 29. First, brain and skull images are extracted from the whole-head input data for the two timepoints separately30. Next, the two brain images are aligned using the skull to constrain the registration scaling (this corrects for distortions in imaging geometry related to scans on different occasions)31, 32. The registration transform between the two timepoints is deconstructed into two intermediary transforms that put each brain image into a space halfway between the two. This is done so each brain image undergoes the same amount of interpolation-related blurring23. Next, tissue-type segmentation is carried out in order to find the brain/non-brain edge boundary33. Then edge detection is performed on both the registered brain images22. For every edge point in image 1, voxels along a line perpendicular to the edge at that point are searched in image 2 using intensity gradients in the same direction in order to find the closest matching edge point. Once the edge is found in image 2, the subvoxel position is taken into account in order to quantify the movement (change). This is repeated for many edge points. The total Brain Volume Change is the sum of all edge point motions. This number is divided by the number of edge points and the voxel ‘area’ and is subsequently converted into Percentage Brain Volume Change (PBVC)23.
Voxel-wise analysis of volumetric change
Following SIENA, an edge displacement image was obtained for each participant. This encodes the outward and inward perpendicular displacement between the two timepoints for every point along the participant’s brain/non-brain boundary, including the internal ventricular boundary. This was dilated, transformed into MNI152 standard space, and masked by a standard 2mm brain edge image34. The resulting standardized edge images from all participants were fed into voxel-wise statistical analysis to test for differences between groups.
Sample size calculations and power analysis
We computed estimates of sample sizes needed to achieve 80% power using a two-sided significance test with level α = 5% in a hypothetical two-arm study that would use SIENA to compare a neuroprotective HD treatment with a placebo over a one-year period. For each arm of the study, the minimum sample size required to detect slowing in the yearly atrophy rate can be computed using the following formula:
| (1) |
Here, σ2 is the variance of the PBVC values in the preHD group in question, and zp is the pth quantile of the standard normal distribution. The variable β denotes the magnitude of the yearly atrophy relative to a baseline condition, as assessed through SIENA35, and Δ denotes the desired detectible slowingin atrophy. In a model in which the study drug is expected to modify both the disease-and normal aging-related rates of atrophy, the baseline condition is “no atrophy,” and β is simply the mean PBVC of the preHD group. Possibly more informative, however, is a model that assumes the study drug’s effect is on the disease-related process alone. In this case, the baseline condition is “normal rate of atrophy,” and β is equivalent to the difference between mean PBVC of the preHD group and mean PBVC of normal controls.
Sample sizes were calculated for both a 50% and 20% desired slowing in atrophy [Δ in Equation (1)]. Sample size point estimates relative to the “no atrophy” baseline condition were obtained by computing the mean rate of atrophy and variance of the PBVC within the preHD group and substituting these values for β andσ2 in Equation (1). Sample size point estimates relative to the “normal rate of atrophy” baseline condition were obtained by computing the difference in mean rates of atrophy between the preHD group and an age-and sex-based pair-matched subset of control subjects. This value and the variance of the preHD group were then substituted for β and σ2 in Equation (1). Sample size 95% confidence intervals (CIs) were computed using the Matlab bootstrapping function bootci with 100,000 sample size estimates.
Statistical analysis
Statistical analyses were carried out at a significance level of 5% (two-tailed) using either PASW Statistics 18 (SPSS Inc., Chicago, IL, USA) for participant characteristics and PBVC values or with FSL’s randomize tool, version 4.1.2, for voxel-wise statistics of the brain edge image. The randomize tool uses non-parametric inference and corrects for multiple comparisons36. The number of permutations was 5,000.
RESULTS
Participant characteristics
At study entry, control and preHD groups had similar age and MMSE score (p=.833 and .495, respectively). For MMSE, ANOVA revealed a main effect of time, with scores decreasing, (F(1,55)=7.126, p=.010), but no between-group difference (F<1). Therefore, the groups were well-matched for longitudinal analysis. Regarding UHDRS motor scores, these were significantly elevated in preHD compared to control sat baseline(t[55]=3.912, p<.001), consistent with subtle motor signs, albeit insufficient to meet the criteria for manifest HD. Second timepoint UHDRS motor scores were significantly elevated in the preHD group after the one-year duration, indicating a slightly worsening condition(t[34]=3.254, p=.003).
Analysis of SIENA Percentage Brain Volume Change
The preHD group showed significantly greater PBVC (increased atrophy) over the year compared to controls(Mean PBVC controls = −0.149%; preHD = −0.388%, t[55]=2.217, p=.031, Cohen’s d =.617) (Table 3, tFig 1A). In controls, there was slight atrophy, consistent with aging; however, this was not a significant effect ([21]=2.006, p=.058). As group gender ratios differed slightly, auxiliary analyses were performed. Atrophy did not differ between males and females within either group (both p>0.05). A bootstrapping analysis procedure additionally sampled 10,000 pairs of equally sized, gender-balanced groups from among controls and preHD. This showed that there was a significant difference (p<0.001) even when matching for gender distribution and group size. This confirms that uneven sex distributions and group sizes do not explain the observed difference in PBVC between controls and preHD.
Table 3.
SIENA derived Percentage Brain Volume Change (PBVC) by group
| PBVC (%, mean ± SD) | |
|---|---|
| Controls (N=22) | −0.149 ± .348 |
| PreHD (N=35) | −0.388 ± .425 |
| Far-from-onset (N=17) | −0.259 ± .390 |
| Close-to-onset (N=18) | −0.510 ± .431 |
Figure 1. Longitudinal results derived from SIENA.

A. Brain Volume Loss(%) is significantly greater in the premanifest Huntington’s disease group when compared to controls. B. Changes in the close-to-onset group drive group differences in Percentage Brain Volume Change. Close-to-onset preHD (Aylward YTO ≤ 6) had greater atrophy than far-from-onset preHD, but this was not significant after covarying for age. Far-from-onset preHD were not significantly different from controls. Error bars represent ± 1 standard error of the mean. Brain Volume Loss (%) equals negative PBVC. PreHD = premanifest Huntington’s disease, FFO = far-from-onset preHD, CTO= close-to-onset preHD.
To examine whether the brain volume loss in preHD was greater in those individuals with greater disease burden, we correlated PBVC with the UHDRS motor score and the two measures of YTO separately(i.e. YTO calculated by Aylward and Langbehn methods). PBVC did not correlate with the UHDRS motor score at either timepoint nor with the change in motor score between timepoints (all t < 1). This is consistent with prior findings that the UHDRS motor score is insensitive to atrophy in premanifest individuals37. PBVC was correlated with the Aylward estimate of YTO – such that those preHD individuals with greater brain atrophy were the closest to onset (Spearman’s rho = .296, p=.042, one-tailed). However, PBVC did not correlate significantly with the Langbehn YTO estimate (Spearman’s rho=.261, p=.065, one-tailed).
This correlation between the Aylward YTO estimate and PBVC is consistent with a previously reported finding of accelerating atrophy as onset approaches13. Together, these findings motivate a comparison of preHD subgroups defined by proximity to onset. To do this, we performed a median split using Aylward YTO (6 years-to-onset) (Table 2). The subgroups (close-to-onset and far-from-onset) did not differ in CAG repeat length (t[33]=.788, p=.436). At timepoint 1, the subgroups were also well-matched on MMSE and UHDRS motor score (p=.169 and .380, respectively). For MMSE and UHDRS motor scores, ANOVA revealed a main effect of time (F[1,33]=7.951, p=.008 and F[1,33]=10.263, p=.003, respectively), but no effect of group (F[1,33]=3.254, p=.080 and F[1,33]=.989, p=.327, respectively). However, the close-to-onset group was significantly older than the far-from-onset group (t[33]=2.051, p=.048).
Table 2.
PreHD subgroups by median Aylward years-to-onset (6 years)
| Far from Onset (N=17) | Close to Onset (N=18) | |||
|---|---|---|---|---|
| Timepoint 1 | Timepoint 2 | Timepoint 1 | Timepoint 2 | |
| Age at start (yrs, mean ± SD) * | 37.3 ± 10.4 | 44.1 ± 9.1 | ||
| Sex (F/M) | 8/9 | 12/6 | ||
| Between-scan interval (yrs, mean ± SD} | 1.0 ± .1 | 1.0 ±.2 | ||
| MMSE (mean ± SD) ** | 29.5 ± 0.5 | 28.7 ± 1.4 | 29.0 ± 1.3 | 28.1 ± 1.6 |
| Number of CAG repeats (mean ± SD) | 42.7 ± 2.8 | 42.1 ± 2.0 | ||
| Estimated years-to- onset, Aylward method (years, mean ± SD) | 11.8 ± 3.8 | 0.2 ± 3.6 | ||
| UHDRS motor score (mean ± SD) ** | 1.3 ± 1.5 | 3.2 ± 4.9 | 1.8 ± 1.9 | 4.5 ± 4.3 |
| UHDRS confidence score (score: # of participants) |
0: 12 1: 5 |
0:10 1:4 2:3 |
0: 11 1: 7 |
0: 5 1: 6 2: 6 3: 1 |
Subgroups determined by median split using Aylward YTO of 6 years-to-onset. SD = standard deviation, MMSE = Mini-mental state exam, CAG = cytosine-adenine-guanine, UHDRS = Unified Huntington’s Disease Rating Scale, N/A = not applicable
significantly different between groups (p=.048)
ANOVA reveals main effect of time (p<.01) but noeffect of group.
Consistent with worsening atrophy with approaching disease onset, close-to-onset preHD had larger PBVC than far-from-onset preHD (Mean PBVC close-to-onset preHD = −0.510%; far-from-onset preHD = −0.259%; t[33]=1.801, p=.041, one-tailed) (Table 3). However, the difference between preHD subgroups did not remain significant after covarying for age (F[1,33]=1.584, p=.221).
To compare preHD subgroups with controls, ANOVA was performed with PBVC and all three groups. There was a main effect of group (F[2,54]=4.401, p=.017) (Fig 1B). Scheffé post-hoc tests showed that while there was no significant difference between the far-from-onset group and controls (p=.781), the close-to-onset group had significantly larger PBVC than controls (p=.019, Cohen’s d = .92). This was an over three-fold difference in yearly atrophy. Notably, controls did not differ in age with either the close-to-onset group (t[38]=1.127, p=.267) or the far-from-onset group (t[37]=.935, p=.356), and the ANOVA’s main effect of group remained even after covarying for age (F[2,54]=2.898, p=.043).
The two participants who were excluded from the main analyses above because of conversion to manifest HD had year-end PBVC values greater than any of the other participants in either the preHD or control groups (PBVC = −1.49% and −1.69% in manifest HD individuals vs. maximum values of −1.40% in preHD or −0.70% in controls).
Voxel-wise analysis of volumetric change
The larger PBVC for close-to-onset individuals vs. controls was also evident in voxel-wise analysis of individual edge-displacement images (p<.05, corrected over the 2mm MNI152 edge image). Figure 2 shows the changes around the lateral ventricles, consistent with the well-established basal ganglia degeneration in HD. There were no significant differences for the voxel-wise analysis when comparing the overall preHD group with controls.
Figure 2. Voxel-wise edge displacement results.
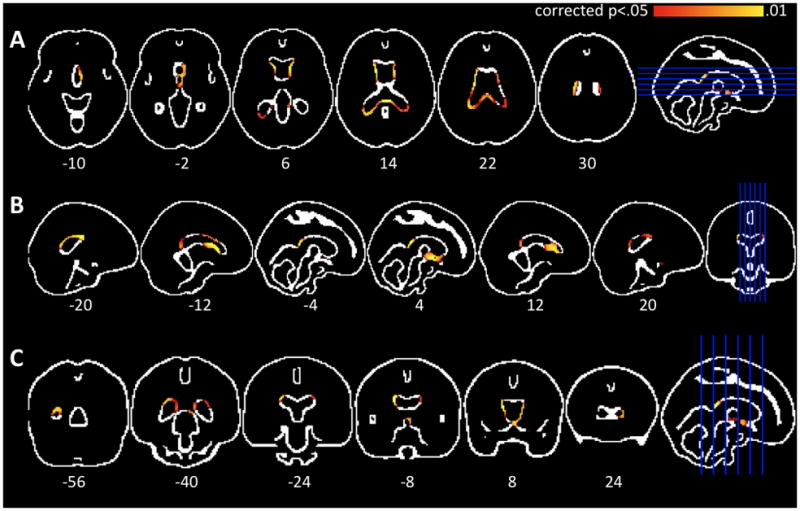
Axial(A), saggital(B), and coronal (C) images of the MNI152 edge image overlaid with areas of significant differences between close-to-onset individuals and controls (p<.05, corrected over the edge image). There is significant periventricular edge displacement, consistent with progressive basal ganglia atrophyin premanifest Huntington’s disease.
Sample size calculations and power analysis
We used Equation 1 to compute the sample sizes needed to power a two-arm neuroprotective treatment study designed to detect both a 50% and 20%slowing in yearly SIENA-derived PBVC. We specified that such a study have a power of 80% and a 5% two-tailed significance level. Sample size estimates (Table 4) were calculated for a hypothetical study that would recruit only those estimated to be six or less years from estimated disease onset (where we found the largest effect size – Cohen’s d = .92). Relative to the “no atrophy” baseline condition, detecting a 50% slowing in atrophy requires a sample size of 45 individuals in each study arm (95% CI: 17 to 188) and a 20% slowing requires 281 individuals (95% CI: 106 to 1225). Relative to the “normal rate of atrophy” baseline condition, detecting a 50% slowing requires 74 individuals (95% CI: 35 to 433) and a 20% slowing requires 460 individuals (95% CI: 218 to 2713). Sample sizes are about twice as large if such a study includes preHD individuals without regard for disease onset proximity (Table 4).
Table 4.
Power analysis
Sample sizes needed to detect a given slowingin yearly atrophy in a two-arm neuroprotection study powered at 80% using a 5% two-sided significance level. Parentheses indicated 95% confidence interval. Treatment effect is relative to an either a baseline of “no atrophy” or one of the “normal atrophy rate.”
| Study of close-to-onset preHD alone | Study of all preHD individuals | |||
|---|---|---|---|---|
| Desired atrophy reduction | 50% | 20% | 50% | 20% |
| “No atrophy” baseline | 45 (17–188) | 281 (106–1225) | 76 (36–210) | 470 (222–1293) |
| “Normal atrophy rate” baseline | 74 (35–433) | 460 (218–2713) | 149 (89–12,302) | 926 (556–78,284) |
DISCUSSION
In this longitudinal study of preHD, we used the completely automated SIENA tool to evaluate whole-brain change. We found significantly larger PBVC (more severe atrophy) in preHD individuals compared to controls over the course of one year. The increased PBVC was particularly striking in a close-to-onset preHD subgroup, supporting a previous finding of accelerating preHD atrophy in the striatum using manual segmentation13. The longitudinal decrease in brain volume was also evident at the voxel-level in periventricular regions – consistent with the well-established basal ganglia atrophy in preHD.
The ideal MRI biomarker for assessing neurodegeneration in preHD would be objectively measured, consistent with known disease pathology, and serve as a predictor for clinical outcomes (such as conversion to manifest HD)8–11. Our results were achieved with a fully-automated analysis. We used the SIENA software tool, which has been shown to be very reliable with an estimated error in brain volume change as low as 0.15%and to be robust to varying image quality, slice thickness, and different pulse sequences22, 23. This error rate is smaller than the group differences we identify in our study. In comparison with other semi-automated techniques to assess longitudinal change, SIENA has demonstrated lower error rates and higher sensitivity in the detection of subtle differences in atrophy38. Moreover, SIENA is freely available and quick to run. Clearly, this fully-automated analysis method meets the objectivity criterion of a preHD biomarker.
A useful longitudinal MRI biomarker should also reveal atrophy that is consistent with known preHD pathology. Here, voxel-wise analysis of longitudinal brain edge displacement revealed changes to periventricular regions, consistent with the well-established profile of basal ganglia atrophy in preHD13–15, 17, 18, 39. However, preHD pathology also includes non-striatal changes such as decreases in white matter volume19, 20 and cortical changes16, 18, 40, 41. Although our voxel-wise analysis points to basal ganglia atrophy, a striking (and probably the most useful) finding here is the overall brain atrophy measure (i.e. PBVC). This measure reflects the total amount of brain edge displacement across time. Thus it is likely sensitive to pathology at multiple levels, including basal ganglia, cortical gray, and white matter, even if not all these changes are reflected in voxel-level differences.
Biomarkers in preHD should also serve as predictors for known future clinical outcomes8–11. We have shown that individuals closest to estimated disease onset drove group differences in atrophy, suggesting that SIENA-derived PBVC may be a good predictor of manifest HD conversion. Furthermore, of the 37 preHD participants who entered our study at the beginning of the year, the two who later converted to manifest HD also had the largest PBVC, consistent with the possibility that PBVC predicts imminent clinical onset. A survival analysis after future follow-up of our remaining 35 preHD participants will further clarify the utility of PBVC as a predictor of clinical onset.
PBVC correlated with the Aylward YTO estimate but not the Langbehn YTO estimate. Differences in methodology may account for this discrepancy. The Langbehn YTO estimate is constrained to always be positive27, 42, whereas the Aylward YTO estimate may be negative when the current age exceeds the estimated age-of-onset26. Thus the Aylward method may allow for greater variability among those closest to onset that is lost when using the Langbehn method.
A limitations of SIENA is the inability to provide full regional specificity as to the locus of atrophy. Our findings of periventricular change, though suggestive regional atrophy, remain unspecific as to the actual locus of change. Indeed, future regionally specific automated analysis tools hold great promise as preHD biomarkers. To date, the sole automated study of caudate atrophy found a high effect size of 0.9 when comparing preHD and controls over a two year period14. Though we show a medium effect size when comparing preHD and control groups, we note that the SIENA whole-brain methodology detected group differences in a shorter time period, i.e. one year. A longer study period would likely accentuate group differences. Moreover, SIENA has the advantage of being freely available, quick, and easy to run.
Furthermore, we observed a high effect size (0.92), as large as that for the abovementioned caudate specific measure14, when comparing PBVC in controls with close-to-onset preHD participants (Aylward YTO ≤ 6 years). This provides useful information about statistical power needed to plan neuroprotective treatment studies in preHD individuals over a one-year period. For instance, a study designed using SIENA to test a treatment that can slow the yearly rate of atrophy by 50% may only require about 74close-to-onset preHD individuals in each experimental arm (treatment vs. placebo). Although the assumption of a 50% benefit may be overly optimistic, the feasibility of such a study strongly argues for the utility of SIENA as a preHD biomarker.
In summary, we have demonstrated the potential of SIENA, a fully-automated and robust method, to detectatrophy in preHD over a mere one year period. We have also shown that year-end PBVC values may predict known disease outcomes such as conversion to manifest disease. These findings provide proof-of-concept regarding biomarker development for disease detection in preHD, as well as quantitative insights into how to power upcoming trials of neuroprotection.
Acknowledgments
This study was funded by CHDI. We thank Anders Dale and Matt Erhart for technical assistance with image preprocessing.
Footnotes
AUTHOR ROLES
1) Research project: A. Conception, B. Organization, C. Execution
2) Statistical Analysis: A. Design, B. Execution, C. Review and Critique
3) Manuscript: A. Writing of the first draft, B. Review and Critique.
Majid: 2A, 2B, 3A. Stoffers: 1B, 1C, 3B. Sheldon: 1B, 1C. Hamza: 1C. Goldstein: 1B, 1C. Thompson: 2A, 2B, 2C. Corey-Bloom: 1B, 1C, 3B. Aron: 1A, 1B, 2C, 3B.
FULL FINANCIAL DISCLOSURES:
This study was supported by the CHDI Foundation.
D.S. Adnan Majid, Dr. Stoffers, S. Sheldon, S. Hamza, W. Thompson, and J. Goldstein report no disclosures. Over the past year, Dr. Corey-Bloom has received travel expenses and honoraria for lectures or educational activities not funded by industry and receives research support from Medivation, Inc., NeuroSearch, Elan Corporation, the University of Rochester, the Alzheimer’s Disease Cooperative Study, and the Huntington’s Study Group. Dr. Aron receives research support from the NIH (DA026452 [PI]), the National Science Foundation (0921168 [PI]), CHDI, and NARSAD.
References
- 1.The Huntington’s Disease Collaborative Research Group. A novel gene containing a trinucleotide repeat that is expanded and unstable on Huntington’s disease chromosomes. Cell. 1993;72:971–983. doi: 10.1016/0092-8674(93)90585-e. [DOI] [PubMed] [Google Scholar]
- 2.Beal MF, Ferrante RJ. Experimental therapeutics in transgenic mouse models of Huntington’s disease. Nat Rev Neurosci. 2004;5:373–384. doi: 10.1038/nrn1386. [DOI] [PubMed] [Google Scholar]
- 3.Bonelli RM, Wenning GK, Kapfhammer HP. Huntington’s disease: present treatments and future therapeutic modalities. Int Clin Psychopharmacol. 2004;19:51–62. doi: 10.1097/00004850-200403000-00001. [DOI] [PubMed] [Google Scholar]
- 4.Handley OJ, Naji JJ, Dunnett SB, Rosser AE. Pharmaceutical, cellular and genetic therapies for Huntington’s disease. Clin Sci. 2006;110:73–88. doi: 10.1042/CS20050148. [DOI] [PubMed] [Google Scholar]
- 5.Fecke W, Gianfriddo M, Gaviraghi G, et al. Small molecule drug discovery for Huntington’s Disease. Drug Discov Today. 2009;14:453–464. doi: 10.1016/j.drudis.2009.02.006. [DOI] [PubMed] [Google Scholar]
- 6.Gil JM, Rego AC. The R6 lines of transgenic mice: a model for screening new therapies for Huntington’s disease. Brain research reviews. 2009;59:410–431. doi: 10.1016/j.brainresrev.2008.12.001. [DOI] [PubMed] [Google Scholar]
- 7.Mestre T, Ferreira J, Coelho MM, et al. Therapeutic interventions for disease progression in Huntington’s disease. Cochrane Database Syst Rev. 2009:CD006455. doi: 10.1002/14651858.CD006455.pub2. [DOI] [PMC free article] [PubMed] [Google Scholar]
- 8.Bohanna I, Georgiou-Karistianis N, Hannan AJ, Egan GF. Magnetic resonance imaging as an approach towards identifying neuropathological biomarkers for Huntington’s disease. Brain research reviews. 2008;58:209–225. doi: 10.1016/j.brainresrev.2008.04.001. [DOI] [PubMed] [Google Scholar]
- 9.Hersch SM, Rosas HD. Neuroprotection for Huntington’s disease: ready, set, slow. Neurotherapeutics: the journal of the American Society for Experimental NeuroTherapeutics. 2008;5:226–236. doi: 10.1016/j.nurt.2008.01.003. [DOI] [PMC free article] [PubMed] [Google Scholar]
- 10.Paulsen JS. Biomarkers to predict and track diseases. Lancet Neurol. 2009;8:776–777. doi: 10.1016/S1474-4422(09)70203-0. [DOI] [PMC free article] [PubMed] [Google Scholar]
- 11.Aylward EH. Change in MRI striatal volumes as a biomarker in preclinical Huntington’s disease. Brain research bulletin. 2007;72:152–158. doi: 10.1016/j.brainresbull.2006.10.028. [DOI] [PubMed] [Google Scholar]
- 12.Aylward E, Li Q, Stine O, et al. Longitudinal change in basal ganglia volume in patients with Huntington’s disease. Neurology. 1997;48:394–399. doi: 10.1212/wnl.48.2.394. [DOI] [PubMed] [Google Scholar]
- 13.Aylward EH, Sparks BF, Field KM, et al. Onset and rate of striatal atrophy in preclinical Huntington disease. Neurology. 2004;63:66–72. doi: 10.1212/01.wnl.0000132965.14653.d1. [DOI] [PubMed] [Google Scholar]
- 14.Hobbs NZ, Henley SMD, Wild EJ, et al. Automated quantification of caudate atrophy by local registration of serial MRI: evaluation and application in Huntington’s disease. Neuroimage. 2009;47:1659–1665. doi: 10.1016/j.neuroimage.2009.06.003. [DOI] [PubMed] [Google Scholar]
- 15.Kipps CM, Duggins AJ, Mahant N, et al. Progression of structural neuropathology in preclinical Huntington’s disease: a tensor based morphometry study. J Neurol Neurosurg Psychiatr. 2005;76:650–655. doi: 10.1136/jnnp.2004.047993. [DOI] [PMC free article] [PubMed] [Google Scholar]
- 16.Rosas HD, Hevelone ND, Zaleta AK, et al. Regional cortical thinning in preclinical Huntington disease and its relationship to cognition. Neurology. 2005;65:745–747. doi: 10.1212/01.wnl.0000174432.87383.87. [DOI] [PubMed] [Google Scholar]
- 17.Thieben MJ, Duggins AJ, Good CD, et al. The distribution of structural neuropathology in pre-clinical Huntington’s disease. Brain. 2002;125:1815–1828. doi: 10.1093/brain/awf179. [DOI] [PubMed] [Google Scholar]
- 18.Stoffers D, Sheldon S, Kuperman JM, et al. Contrasting gray and white matter changes in preclinical Huntington disease: an MRI study. Neurology. 2010;74:1208–1216. doi: 10.1212/WNL.0b013e3181d8c20a. [DOI] [PMC free article] [PubMed] [Google Scholar]
- 19.Ciarmiello A, Cannella M, Lastoria S, et al. Brain white-matter volume loss and glucose hypometabolism precede the clinical symptoms of Huntington’s disease. J Nucl Med. 2006;47:215–222. [PubMed] [Google Scholar]
- 20.Squitieri F, Cannella M, Simonelli M, et al. Distinct brain volume changes correlating with clinical stage, disease progression rate, mutation size, and age at onset prediction as early biomarkers of brain atrophy in Huntington’s disease. CNS neuroscience & therapeutics. 2009;15:1–11. doi: 10.1111/j.1755-5949.2008.00068.x. [DOI] [PMC free article] [PubMed] [Google Scholar]
- 21.Weaver KE, Richards TL, Liang O, et al. Longitudinal diffusion tensor imaging in Huntington’s Disease. Exp Neurol. 2009 doi: 10.1016/j.expneurol.2008.12.026. [DOI] [PMC free article] [PubMed] [Google Scholar]
- 22.Smith S, De Stefano N, Jenkinson M, Matthews P. Normalized accurate measurement of longitudinal brain change. J Comput Assist Tomogr. 2001;25:466–475. doi: 10.1097/00004728-200105000-00022. [DOI] [PubMed] [Google Scholar]
- 23.Smith S, Zhang Y, Jenkinson M, et al. Accurate, robust, and automated longitudinal and cross-sectional brain change analysis. Neuroimage. 2002;17:479–489. doi: 10.1006/nimg.2002.1040. [DOI] [PubMed] [Google Scholar]
- 24.Folstein M, Folstein S, McHugh P. “Mini-mental state”. A practical method for grading the cognitive state of patients for the clinician. J Psychiatr Res. 1975;12:189–198. doi: 10.1016/0022-3956(75)90026-6. [DOI] [PubMed] [Google Scholar]
- 25.The Huntington’s Study Group. Unified Huntington’s Disease Rating Scale: reliability and consistency. Mov Disord. 1996;11:136–142. doi: 10.1002/mds.870110204. [DOI] [PubMed] [Google Scholar]
- 26.Aylward EH, Codori AM, Barta PE, et al. Basal ganglia volume and proximity to onset in presymptomatic Huntington disease. Arch Neurol. 1996;53:1293–1296. doi: 10.1001/archneur.1996.00550120105023. [DOI] [PubMed] [Google Scholar]
- 27.Langbehn DR, Brinkman RR, Falush D, et al. A new model for prediction of the age of onset and penetrance for Huntington’s disease based on CAG length. Clin Genet. 2004;65:267–277. doi: 10.1111/j.1399-0004.2004.00241.x. [DOI] [PubMed] [Google Scholar]
- 28.Smith S, Jenkinson M, Woolrich M, et al. Advances in functional and structural MR image analysis and implementation as FSL. Neuroimage. 2004;23 (Suppl 1):S208–219. doi: 10.1016/j.neuroimage.2004.07.051. [DOI] [PubMed] [Google Scholar]
- 29.Woolrich MW, Jbabdi S, Patenaude B, et al. Bayesian analysis of neuroimaging data in FSL. Neuroimage. 2009;45:S173–186. doi: 10.1016/j.neuroimage.2008.10.055. [DOI] [PubMed] [Google Scholar]
- 30.Smith S. Fast robust automated brain extraction. Hum Brain Mapp. 2002;17:143–155. doi: 10.1002/hbm.10062. [DOI] [PMC free article] [PubMed] [Google Scholar]
- 31.Jenkinson M, Bannister P, Brady M, Smith S. Improved optimization for the robust and accurate linear registration and motion correction of brain images. Neuroimage. 2002;17:825–841. doi: 10.1016/s1053-8119(02)91132-8. [DOI] [PubMed] [Google Scholar]
- 32.Jenkinson M, Smith S. A global optimisation method for robust affine registration of brain images. Med Image Anal. 2001;5:143–156. doi: 10.1016/s1361-8415(01)00036-6. [DOI] [PubMed] [Google Scholar]
- 33.Zhang Y, Brady M, Smith S. Segmentation of brain MR images through a hidden Markov random field model and the expectation-maximization algorithm. IEEE Trans Med Imaging. 2001;20:45–57. doi: 10.1109/42.906424. [DOI] [PubMed] [Google Scholar]
- 34.Bartsch AJ, Bendszus N, De Stefano N, et al. Extending SIENA for a multi-subject statistical analysis of sample-specific cerebral edge shifts: Substantiation of early brain regeneration through abstinence from alcoholism. Tenth International Conference on Functional Mapping of the Human Brain; 2004. [Google Scholar]
- 35.Hua X, Lee S, Hibar DP, et al. Mapping Alzheimer’s disease progression in 1309 MRI scans: power estimates for different inter-scan intervals. Neuroimage. 2010;51(1):63–75. doi: 10.1016/j.neuroimage.2010.01.104. [DOI] [PMC free article] [PubMed] [Google Scholar]
- 36.Nichols TE, Holmes AP. Nonparametric permutation tests for functional neuroimaging: a primer with examples. Hum Brain Mapp. 2002;15(1):1–25. doi: 10.1002/hbm.1058. [DOI] [PMC free article] [PubMed] [Google Scholar]
- 37.de Boo G, Tibben A, Hermans J, Maat A, Roos RA. Subtle involuntary movements are not reliable indicators of incipient Huntington’s disease. Mov Disord. 1998;13(1):96–99. doi: 10.1002/mds.870130120. [DOI] [PubMed] [Google Scholar]
- 38.Sormani M, Rovaris M, Valsasina P, Wolinsky J, Comi G, Filippi M. Measurement error of two different techniques for brain atrophy assessment in multiple sclerosis. Neurology. 2004;62(8):1432–1434. doi: 10.1212/01.wnl.0000120663.85143.b3. [DOI] [PubMed] [Google Scholar]
- 39.Paulsen JS, Nopoulos PC, Aylward E, et al. Striatal and white matter predictors of estimated diagnosis for Huntington disease. Brain research bulletin. 2010 doi: 10.1016/j.brainresbull.2010.04.003. [DOI] [PMC free article] [PubMed] [Google Scholar]
- 40.Paulsen JS, Magnotta VA, Mikos AE, et al. Brain structure in preclinical Huntington’s disease. Biol Psychiatry. 2006;59(1):57–63. doi: 10.1016/j.biopsych.2005.06.003. [DOI] [PubMed] [Google Scholar]
- 41.Nopoulos P, Magnotta V, Mikos A, Paulson H, Andreasen N, Paulsen J. Morphology of the cerebral cortex in preclinical Huntington’s disease. The American journal of psychiatry. 2007;164(9):1428–1434. doi: 10.1176/appi.ajp.2007.06081266. [DOI] [PubMed] [Google Scholar]
- 42.Langbehn DR, Hayden MR, Paulsen JS Group P-HIotHS. CAG-repeat length and the age of onset in Huntington disease (HD): a review and validation study of statistical approaches. Am J Med Genet B Neuropsychiatr Genet. 2010;153B(2):397–408. doi: 10.1002/ajmg.b.30992. [DOI] [PMC free article] [PubMed] [Google Scholar]