SUMMARY
We report a normal-mode method for anisotropic refinement of membrane-protein structures, based on a hypothesis that the global near-native-state disordering of membrane proteins in crystals follows low-frequency normal modes. Thus, a small set of modes is sufficient to represent the anisotropic thermal motions in X-ray crystallographic refinement. By applying the method to potassium channel KcsA at 3.2 Å, we obtained a structural model with an improved fit with the diffraction data. Moreover, the improved electron density maps allowed for large structural adjustments for 12 residues in each subunit, including the rebuilding of 3 missing side chains. Overall, the anisotropic KcsA structure at 3.2 Å was systematically closer to a 2.0 Å KcsA structure, especially in the selectivity filter. Furthermore, the anisotropic thermal ellipsoids from the refinement revealed functionally relevant structural flexibility. We expect this method to be a valuable tool for structural refinement of many membrane proteins with moderate-resolution diffraction data.
INTRODUCTION
Although the structure determination of membrane proteins has gained enormous momentum in recent years, progress has still been slow. One reason is that the structures of many membrane proteins are slightly altered, or disordered, due to the nonnative environment in crystals. Another reason is that membrane proteins, such as ion channels, often have highly flexible structural components for their cellular functions, such as gating (Biggin and Sansom, 2001). All of those nonfunctional and functional deformations of membrane proteins in crystals have substantially hindered the efforts of getting high-resolution diffraction data and have consequently resulted in enormous difficulties in structural refinement.
In this study, we hypothesized that, similar to functionally important conformational changes in many soluble proteins (Ma, 2004, 2005), the global near-native-state structural disordering of membrane proteins in crystals follows the low-frequency normal modes. Thus, we can use a very small set of low-frequency normal modes as adjustable parameters to model the motions, especially the anisotropic motions, of membrane proteins (Shen et al., 2002). In doing so, the conventional isotropic B factors are replaced with the normal-mode-based anisotropic temperature factors. The detailed protocol was similar to that followed for our recent study of a very flexible supramolecular complex (Poon et al., 2007). Aided by previous efforts detailed in literature (Diamond, 1990; Kidera and Go, 1990, 1992; Kidera et al., 1992a, 1992b, 1994), this refinement study was made possible by a recent elastic normal-mode analysis (eNMA) that delivered much improved quality of low-frequency modes (Lu et al., 2006).
A distinct advantage of normal-mode-based refinement is that it allows for anisotropic refinement of temperature factors with a much smaller number of adjustable parameters than even the conventional isotropic refinement. Therefore, it yields a substantially improved observation/parameter ratio and reduces the risk of overfitting. These features make the method particularly attractive for structural refinement of flexible membrane proteins that often diffract to moderate resolutions.
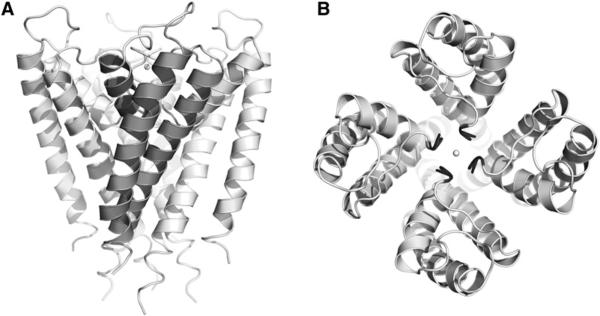
The normal-mode-based refinement was applied to potassium channel KcsA from Streptomyces lividans, an ion channel that is capable of selecting K+ over Na+ by a factor of 104 at a near-diffusion-limited throughput rate of 108 ions per second (Moczydlowski, 1998). The first crystal structure of KcsA, determined to 3.2 Å (PDB code 1BL8), suggested a tetrameric organization, with each subunit containing two transmembrane helices—an inner helix and an outer helix (Doyle et al., 1998). The overall shape of the pore, mainly formed by the four inner helices, looks like an inverted teepee (Figure 1). The high selectivity for the K+ ion is due to a selectivity filter located near the extracellular end of the channel. In this structure, some residues had isotropic B factors greater than 200 Å2, and some important functional groups were not well resolved (Doyle et al., 1998), indicating a considerable level of disordering. Thus, the KcsA structure at 3.2 Å provided an ideal system for testing our refinement protocol on membrane proteins at moderate resolutions. Moreover, another KcsA structure is available at a much higher resolution (2.0 Å; PDB code 1K4C) (Zhou et al., 2001). This structure was compared with the refined model in our structural analysis.
Figure 1. Structure of Potassium Channel KcsA.
(A) Side view of KcsA. For the front subunit, the three helices are shown in darker color: inner helix, outer helix, and pore helix.
(B) Top view of KcsA. The selectivity filter is highlighted in black for all four subunits. The potassium ions and oxygen atoms of water in the selectivity filter are shown as spheres.
Our results show that the normal-mode-based refinement produced a structural model with a lower value for Rfree than the original isotropically refined model. When compared with the structure of KcsA at 2.0 Å resolution, the refined model was found to be systematically closer to the 2.0 Å structure, especially in the selectivity filter region. Several side chains that were missing in the original model, including that of the functionally important Glu71, were established in our model based on the improved density maps. Moreover, the normal-mode-based refinement revealed the distribution of anisotropic thermal ellipsoids that reflects the functionally relevant structural flexibility.
RESULTS
The original structure of KcsA at 3.2 Å was refined by X-PLOR (Brünger, 1992). In order to compare the original model and our refined model based on the same refinement method, we used REFMAC5 (Murshudov et al., 1997) to reminimize the original structure, and we obtained Rcryst and Rfree values of 29.82% and 30.70%, respectively. The original model has 380 amino acid residues and 2,821 nonhydrogen atoms in an asymmetric unit. It was refined by applying essentially strict, four-fold noncrystallographic symmetry with grouped B factors (one for main chain atoms and one for side chain atoms). Thus, including the four B factors for three K+ ions and one water molecule, there were, in total, 764 isotropic B factors. In our normal-mode-based refinement of KcsA, we used the first 25 non-zero modes, i.e., N(N + 1)/2 = 325 parameters, to compute the anisotropic B factors that replaced the isotropic B factors in the original model. Most impressively, the first round of normal-mode-based anisotropic B factor refinement and the subsequent REFMAC5 refinement yielded a structural model of 28.39% and 28.75% for Rcryst and Rfree, respectively. This improved fit mostly came from the normal-mode refinement, as no manual adjustment had been made at that point.
At the conclusion of normal-mode-based structural refinement, the fit between the structural model and diffraction data was improved to final values of 27.16% and 27.18% for Rcryst and Rfree, respectively. The final model had 91.5% of the residues in the most favored regions and the remaining 8.5% in additionally allowed regions in the Ramachandran plot. It was evidently improved over the original model (PDB code 1BL8), which has 74.7% of the residues in the most favored regions, 24.1% in additionally allowed regions, and 1.2% in generally allowed regions (Doyle et al., 1998). For comparison purposes, the KcsA in the 2.0 Å structure (PDB code 1K4C) has 96.6% of the residues in the most favored regions and the remaining 3.4% in additionally allowed regions (Zhou et al., 2001). In terms of root-mean-square difference (rmsd) from ideal values, the new model has 0.007 Å in bond lengths and 0.99° in bond angles, while the original 3.2 Å structure has 0.006 Å in bond lengths and 1.10° in bond angles, and the KcsA structure in 2.0 Å (including antibodies) has 0.007 Å in bond lengths and 1.40° in bond angles.
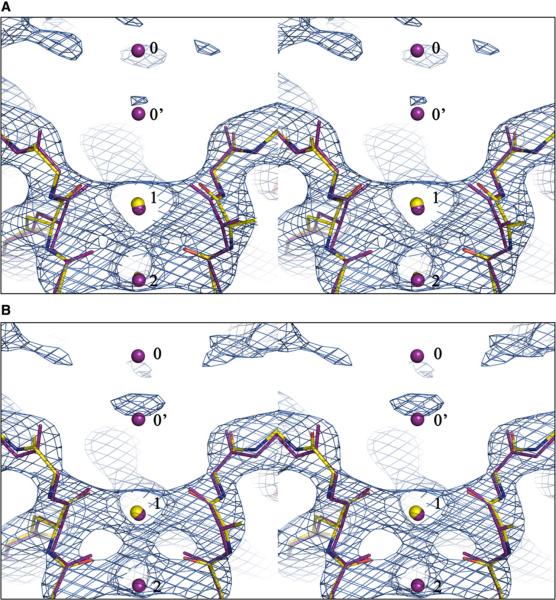
Upon completion of the normal-mode refinement, for a systematic comparison, the main chain rmsd was calculated for the new model and the original isotropic model with respect to the later determined 2.0 Å structure of KcsA (Figure 2). Due to the binding of a monoclonal antibody in the 2.0 Å structure of KcsA that is absent in the 3.2 Å structure, the region of residues 53~65 has a very large rmsd. Despite that, the new model is clearly more similar to the 2.0 Å structure that is presumably more accurate. The average main chain rmsd with respect to the 2.0 Å structure is 0.811 Å for the new model and 0.963 Å for the original model including the antibody-binding region, and 0.697 Å and 0.837 Å, respectively, for the model excluding the antibody-binding region, when all four subunits were aligned. The most striking feature is the improvement in the selectivity filter region (residues 75–79 with signature sequence TVGYG) that was purposely omitted in manual adjustment. The new model in this region is much closer to the 2.0 Å structure (Figure 3B), with an average rmsd of 0.215 Å, in contrast to the 0.474 Å for the original model (Figure 3A) (these rmsd values were calculated based on the main chain alignment of the TVGYG sequence of all four subunits). Moreover, as a result of the improved model, the normal-mode-refined 2Fo – Fc map contoured at 2.0σ revealed a strong density at the extracellular side of the channel, about 6 Å from the K+ ion at position 1 in the selectivity filter (Figure 3B). This density is absent in the 2Fo – Fc map calculated by using the original model (Figure 3A). Comparison with the 2.0 Å structure of KcsA suggests that this extra density could be the density for one of the two alternate positions of a single K+ ion (labeled as 0 and 0′), as seen in the 2.0 Å structure (Zhou et al., 2001).
Figure 2. Main Chain Rmsd of the Normal-Mode-Refined Model and the Original Isotropic Model with Respect to the 2.0Å Structure of KcsA.
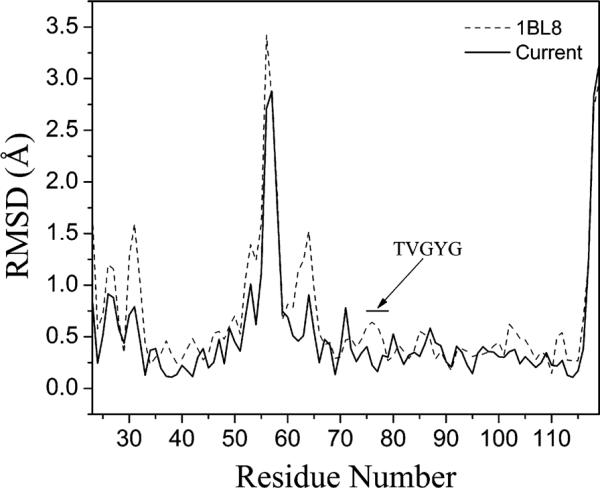
The normal-mode-refined model is denoted by the solid line, and the original isotropic model is denoted by the dashed line. The black bar highlights the selectivity filter (residues 75–79 with signature sequence TVGYG). The comparison was made based on a single subunit.
Figure 3. Improvement of the Structural Model of KcsA in the Selectivity Filter Region.
(A and B) Shown are stereo views of the superposition of the 3.2Å structure (colored by atoms) with the 2.0Å structure (red). The superposition was based on the main chains of the TVGYG sequence of all four subunits. (A) The original model. (B) The normal-mode-refined model. The 2Fo–Fc maps for the 3.2Å structures are contoured at 2.0σ.K+ ions in the filter are numbered as 1 and 2 according to the 2.0Å structure, and the two alternate positions for a single K+ ion at the entryway revealed in the 2.0Å structure are numbered as 0 and 0′ for easy reference. A strong new density is observed near the 0′ position in the 2Fo–Fc map for the normal-mode-refined model. It is evident that the new model is more similar to the 2.0Å structure than the original model.
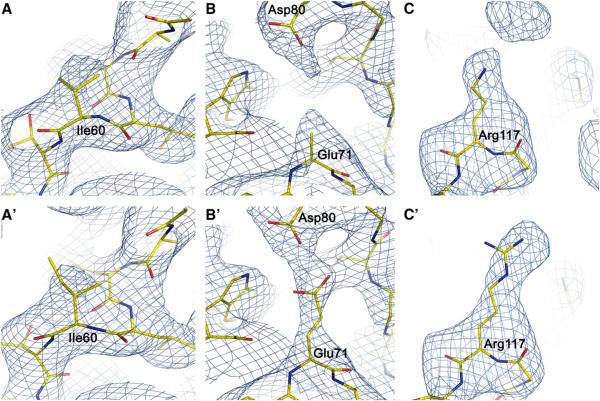
The improvement of the refinement was also reflected in the improved 2Fo − Fc electron density map that allowed for structural adjustments of individual residues. There were large shifts for 12 residues in each subunit. More importantly, the original model had 5 residues in each subunit with missing side chain atoms: Arg27 only modeled to Cβ, Ile60 to Cγ, Arg64 to Cβ, Glu71 to Cβ, and Arg117 to Nε (Doyle et al., 1998). Clear electron densities were shown for the side chains of residues Ile60, Glu71, and Arg117 (Figure 4). In the case of Ile60, the missing Cδ atom in the original model (Figure 4A) had a strong corresponding electron density in the normal-mode-refined 2Fo − Fc map (Figure 4A′), thus allowing for the building of the Cδ atoms in the density for all four chains. In the case of Glu71, based on the 2.0 Å structure of KcsA (PDB code 1K4C)(Zhou et al., 2001), the pair formed by the side chains of Glu71 and Asp80 was proposed to present a total of four negative charges near the entryway of the channel, thus providing electrostatic attraction to cations (Zhou et al., 2001). However, in the original 3.2 Å structure of KcsA, no electron densities were observed for the side chain atoms of Glu71 beyond the Cβ atom (Figure 4B). The new normal-mode-refined 2Fo − Fc map had clear densities for the side chain atoms of Glu71 (Figure 4B′), which, when added in density, were at positions to interact favorably with the side chains of Asp80. In the case of Arg117, the electron densities for the side chains of Arg117 were weak in the original model and only allowed for the building of the side chains to Nε atoms (Figure 4C). In sharp contrast, the new normal-mode-refined 2Fo − Fc map had strong densities for Arg117 even at a contour level of 2.0σ (Figure 4C′). Thus, the full-length side chains of Arg117 in three subunits were built in the new model. (The density of Arg117 in one subunit was still weak, and we didn't build the side chain.) The density for Arg27 and Arg64 was not improved to the extent necessary for side chain rebuilding. Overall, the normal-mode-based refinement caused an average of 34° shifts in the phase angle, with larger phase shifts at higher resolutions (Figure 5).
Figure 4. Improvement of the Structural Model of KcsA in Normal-Mode Refinement.
(A–C) The top panels show the original model superimposed with the 2Fo – Fc map. (A′–C′) The bottom panels show the refined model superimposed with the 2Fo – Fc map calculated with the added side chains omitted. (A and A′) Residue Ile60 with the 2Fo – Fc map contoured at 1.0σ. (B and B′) Residue Glu71 with the 2Fo – Fc map contoured at 1.0σ. (C and C′) Residue Arg117 with the 2Fo – Fc map contoured at 2.0σ.
Figure 5. Phase Angle Shifts as a Function of Resolution Shells.
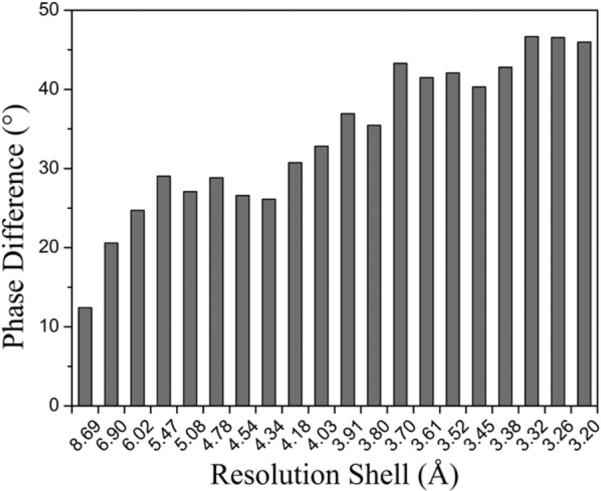
It is evident that the shifts are larger at higher-resolution shells. Phase angle shifts were calculated by using SFTOOLS in CCP4.
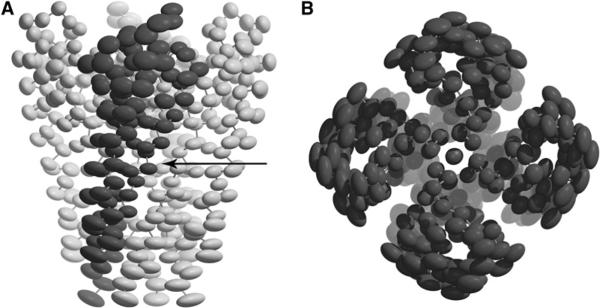
A critical aspect of the functions of channel proteins is how the channels close and open in response to an external stimulus in the process of gating. The 3.2 Å structure of KcsA was presumably in a closed conformation (Doyle et al., 1998). Although the open conformation of KcsA has never been captured in an X-ray crystallographic study, the structure of the MthK channel from Methanobacterium thermoautotrophicum contains a bound ligand that opens the channel in membranes (Jiang et al., 2002). Comparison of the MthK and KcsA structures, in open and closed conformations, respectively, has revealed a gating hinge at residue Gly99 on the inner helix that bends by about 30° to open a 12 Å entryway at the intracellular side. Sequence conservation suggested that such a gating mechanism is conserved in a wide range of potassium channels (Jiang et al., 2002). Interestingly, the thermal ellipsoids for KcsA shown in Figure 6A also suggest a hinge point in the middle of the inner helices (indicated by the arrow), although the amplitudes of motion of the transmembrane helices in this single conformational state of KcsA are much smaller than those that would be needed for actual gating (Jiang et al., 2002). Moreover, the overall distribution of thermal ellipsoids (Figure 6) indicates an axial rotation of transmembrane helices, which is in agreement with a previous computational analysis (Shen et al., 2002). Furthermore, the selectivity filter region has the smallest, more isotropic, thermal ellipsoids, as it is required to be more rigid for selectivity of ions.
Figure 6. The Thermal Ellipsoids of KcsA Made with 40% Probability.
(A) Side view; (B) top view. The arrow highlights the hinge point.
DISCUSSION
In this study, a normal-mode-based refinement protocol was employed to model anisotropic thermal parameters of a membrane protein, the potassium channel KcsA at 3.2 Å. The method operates under a working hypothesis that, similar to functionally relevant conformational changes in many soluble proteins, the global structural disordering of membrane proteins in crystals near their native states follows the low-frequency normal modes. Using a very small set of low-frequency normal modes (25 modes in this case), the anisotropic thermal ellipsoids were constructed and used to replace the isotropic B factors in structural refinement. The results showed that the normal-mode refinement, with far fewer thermal parameters, yielded a new model with an Rfree value that was lower than that of the original model. The improved electron density maps suggested large structural shifts for the side chains of a total of 12 residues in each subunit, in particular the building of the side chains of Ile60, Glu71, and Arg117 that were missing in the original structure. Particularly interesting is the addition of the side chains of Glu71 that have important functional implications. The overall refined structure, especially in the selectivity filter, was found to be closer to a higher-resolution structure of KcsA at 2.0 Å resolution. However, we note that the two structures are inherently different in certain regions because of a different crystal packing environment. The most significant improvements in our refinement were those around the selectivity filter, which were also purposely left out in the manual adjustment. Finally, the distribution of anisotropic thermal ellipsoids from the normal-mode refinement revealed the direction and magnitude of structural deformations that are relevant to the function of the channel, e.g., the axial twisting of transmembrane helices is clearly shown.
The conventional X-ray crystallographic refinement is based on assumptions that atomic motions are harmonic, isotropic, and independent of each other. The normal-mode refinement, although still harmonic, treats the motion in an anisotropic and collective fashion. It is for this reason that the method allows for a more accurate representation of the thermal motions of proteins with a significantly smaller set of adjustable parameters. The collectiveness of motions naturally guaranteed by the harmonic modes also provides an advantage over the TLS refinement (Schomaker and Trueblood, 1968), which fragmentizes protein structures that may be energetically unfavorable.
The results of applying the normal-mode refinement method to KcsA suggest that this method provides an efficient way to deal with highly mobile and/or poorly resolved regions in membrane proteins with moderate-resolution diffraction data. The improvements resulting from the normal-mode refinement method include a structural model with overall better quality, the reduced risk of over-fitting, and a quantitative description of the direction and magnitude of anisotropic structural deformations that are refined against experimental diffraction data. This method has also been successfully applied to the refinement of a soluble supramolecular complex, formiminotransferase cyclodeaminase (FTCD), a 0.5 million dalton homo-octameric enzyme at 3.42 Å resolution (Poon et al., 2007). With the success in both membrane proteins and soluble, large flexible complexes, we expect that this normal-mode-based refinement method will add a useful tool for structural biology, particularly in handling large and flexible complexes at moderate resolutions.
EXPERIMENTAL PROCEDURES
Elastic Normal-Mode Analysis without Tip Effect
We calculated our normal-mode vectors by using a recently developed type of eNMA (Lu et al., 2006) that avoids the tip effect by changing the degrees of freedom to internal coordinates, that is, the bond and dihedral angles for the Cα chain. This form of eNMA has an extra term in its potential function, in addition to that in conventional eNMA (Atilgan et al., 2001; Tirion, 1996):
| (1) |
where |rij| and are the instantaneous and equilibrium distances, respectively, between the ith and the jth Cα atoms, hij is the Heavyside step function that specifies the effect of the cutoff distance, rc, γ is the force constant and is set to 1.0, represents the diagonal elements of the Hessian matrix from conventional eNMA in internal coordinate space, ϕα represents all of the pseudo dihedral and bond angles, and ζ is a scaling factor. This scaling factor affects the stiffness of the protein and is varied in order to reduce the tip effect. For KcsA, this value was set to 3.0. Lastly, because only the modes for the Cα atoms were calculated, the side chain atoms were assumed to move in the same direction as their Cα atom.
Crystallographic Refinement of Thermal B Factors
The temperature factor in X-ray crystallography describes the root-mean-square deviation, 〈〉, of atom j from its average position. For proteins, this parameter, Bj, is usually simplified to the isotropic case and is related to the fluctuation by Bj = (8π2/3)〈〉. Optimal values for Bj are determined by a least-squares minimization of the residual
| (2) |
where h = (h, k, l)T represent the Miller indices, w(h) is a weight function for each reflection, and |Fobs| and |Fcal| are the amplitudes of the observed and calculated structure factors, respectively. |Fcal| is calculated by
| (3) |
where q= 2πΘT h is a reciprocal lattice vector at lattice point h; Θ= (a*, b*, c*)T is a 3 × 3 matrix that converts Cartesian coordinates to fractional coordinates, with a*, b*, and c* being the reciprocal unit cell vectors of the crystal; and fj is the atomic structure factor. The Debye-Waller factor,
| (4) |
describes the fluctuations in atomic positions and can be put in terms of the isotropic B factor by
| (5) |
Inherent in the equation given above are the assumptions that the atomic motions are harmonic, isotropic, and independent. In cases in which the assumptions are inaccurate, such as systems with flexible domains exhibiting directed motions, isotropic refinement performs poorly, resulting in errors in the model.
Normal-Mode-Based Crystallographic Refinement
The instantaneous displacement of atom j from its average position in terms of the normal-mode variable, σ,is
| (6) |
where E is a 3N × M matrix in which each column vector is a normal mode, and M is the number of low-frequency modes. The Debye-Waller factor in Equation 4 can be expressed in terms of Equation 6 by
| (7) |
where Ej is a 3 × M matrix containing only the part of matrix E for atom j, and IImn≡ 〈σmσn〉 represents the variances, IImm, and covariances, IImn(m≠n). The anisotropic displacement tensor is defined as ; thus, II must be a positive semidefinite in order for Unm to be a real ellipsoid. Therefore, II is expressed by the lower triangular matrixΩ (={Ωmn}, m, n = 1,2,…, M; Ωmn = 0, if m<n) as:
| (8) |
For M low-frequency modes, there are M(M+1)/2 parameters in II for all of the anisotropic temperature factors of all of the heavy atoms. These parameters are optimized by the residual in Equation 2, which minimizes the difference between the calculated and observed structure factors.
TLS Refinement, Overall Anisotropic B Factor, and Bulk Solvent Modeling
TLS (Schomaker and Trueblood, 1968) was used to describe the external motion of the molecules because the normal modes only account for the internal motion. REFMAC5 was used to determine the TLS parameters for the rigid body composed of all of the atoms in the asymmetric unit. TLSANL (Howlin et al., 1993) reads these optimized TLS parameters and generates a PDB file with ANISOU records containing the TLS contributions.
Even with normal-mode refinement and TLS, there was some remaining anisotropy from the crystal. Usually, this is corrected while processing the reflections, but some effects remain. This additional anisotropy was modeled by having an overall anisotropic B factor that applies to the whole structure.
Assuming that the internal motion, external motion, and crystal anisotropy are independent, the final anisotropic B factor, U,is
| (9) |
where Unm is from normal modes, Utls is from REFMAC5 and TLSANL, stls is a scaling factor, and Uoverall is the overall anisotropic B factor. The additional scaling factor is used because TLS refinement is done separately from the minimization of the other parameters in Unm and Uoverall. In total, there are M(M+1)/2 parameters for normal modes, 20 parameters for TLS, 1 parameter for TLS scaling, and 6 parameters for the overall B factor.
To account for the scattering due to bulk solvent, a correction similar to the one in CNS is used (Brünger et al., 1998). The partial structure factors for the bulk solvent are scaled according to
| (10) |
where Fprotein is the calculated structure factor for the protein atoms, Fsolvent is the partial structure factor calculated from the solvent mask, ksolvent is like an average solvent density, and Bsolvent is a B factor for the solvent that smoothes the transition from the bulk solvent region to the atomic region. Optimal values for ksolvent and Bsolvent are found by minimizing the residual from Equation 2.
Positional Refinement and Manual Model Adjustment
In the normal-mode-based refinement step, only anisotropic B factors were updated. Thus, it was followed by a REFMAC5 refinement (Murshudov et al., 1997) to update the atomic coordinates of the original structural model of KcsA (PDB code 1BL8). Using the new structural model output from REFMAC5, a new 2Fo–Fc map was calculated, and an averaged map was obtained by applying the noncrystallographic symmetry for the four subunits. Manual adjustments were carried out in O (Jones et al., 1991) guided by the new 2Fo–Fc map. Additions of atoms were only made when suggested by clear and strong electron densities in the new 2Fo–Fc map. Rcryst and Rfree values were monitored to avoid overfitting in the refinement. For the calculation of Rcryst and Rfree, the following equation was used:
| (11) |
In the original structure determination, 10% of unique reflections were saved for the purpose of crossvalidation and were not used in the refinement. These same reflections were also used in our structural refinement for the calculation of Rfree. Convergence was achieved after three iterations of normal-mode-based anisotropic refinement, REFMAC5 refinement, and manual adjustment.
ACKNOWLEDGMENTS
X.C. and B.K.P. contributed equally to this project. B.K.P. is supported by a predoctoral fellowship from the Houston Area Molecular Biophysics Predoctoral Training Program (HAMBP). A.D. is supported by a predoctoral fellowship from the National Library of Medicine Computational Biology and Medicine Training Program. J.M. acknowledges support of a grant from the National Institutes of Health (R01-GM067801).
Footnotes
Accession Numbers Coordinates have been deposited in the Protein Data Bank with accession code 2QTO.
REFERENCES
- Atilgan AR, Durell SR, Jernigan RL, Demirel MC, Keskin O, Bahar I. Anisotropy of fluctuation dynamics of proteins with an elastic network model. Biophys. J. 2001;80:505–515. doi: 10.1016/S0006-3495(01)76033-X. [DOI] [PMC free article] [PubMed] [Google Scholar]
- Biggin PC, Sansom MS. Channel gating: twist to open. Curr. Biol. 2001;11:R364–R366. doi: 10.1016/s0960-9822(01)00195-6. [DOI] [PubMed] [Google Scholar]
- Brünger AT. XPLOR Manual. Version 3.0 Yale University; New Haven, CT: 1992. [Google Scholar]
- Brünger AT, Adams PD, Clore GM, DeLano WL, Gros P, Grosse-Kunstleve RW, Jiang JS, Kuszewski J, Nilges M, Pannu NS, et al. Crystallography & NMR system: a new software suite for macromolecular structure determination. Acta Crystallogr. D Biol. Crystallogr. 1998;54:905–921. doi: 10.1107/s0907444998003254. [DOI] [PubMed] [Google Scholar]
- Diamond R. On the use of normal modes in thermal parameters refinement: theory and application to the bovine pancreatic trypsin inhibitor. Acta Crystallogr. A. 1990;46:425–435. doi: 10.1107/s0108767390002082. [DOI] [PubMed] [Google Scholar]
- Doyle DA, Cabral JM, Pfuetzner RA, Kuo A, Gulbis JM, Cohen SL, Chait BT, MacKinnon R. The structure of the potassium channel: molecular basis of K+ conduction and selectivity. Science. 1998;280:69–77. doi: 10.1126/science.280.5360.69. [DOI] [PubMed] [Google Scholar]
- Howlin B, Butler SA, Moss DS, Harris GW, Driessen HPC. TLS parameter-analysis program for segmented anisotropic refinement of macromolecular structures. J. Appl. Crystallogr. 1993;26:622–624. [Google Scholar]
- Jiang Y, Lee A, Chen J, Cadene M, Chait BT, MacKinnon R. The open pore conformation of potassium channels. Nature. 2002;417:523–526. doi: 10.1038/417523a. [DOI] [PubMed] [Google Scholar]
- Jones TA, Zou JY, Cowan SW, Kjeldgaard M. Improved methods for building protein models in electron density maps and the location of errors in these models. Acta Crystallogr. A. 1991;47:110–119. doi: 10.1107/s0108767390010224. [DOI] [PubMed] [Google Scholar]
- Kidera A, Go N. Refinement of protein dynamic structure: normal mode refinement. Proc. Natl. Acad. Sci. USA. 1990;87:3718–3722. doi: 10.1073/pnas.87.10.3718. [DOI] [PMC free article] [PubMed] [Google Scholar]
- Kidera A, Go N. Normal mode refinement: crystallographic refinement of protein dynamic structure. I. Theory and test by simulated diffraction data. J. Mol. Biol. 1992;225:457–475. doi: 10.1016/0022-2836(92)90932-a. [DOI] [PubMed] [Google Scholar]
- Kidera A, Inaka K, Matsushima M, Go N. Normal mode refinement: crystallographic refinement of protein dynamic structure applied to human lysozyme. Biopolymers. 1992a;32:315–319. doi: 10.1002/bip.360320404. [DOI] [PubMed] [Google Scholar]
- Kidera A, Inaka K, Matsushima M, Go N. Normal mode refinement: crystallographic refinement of protein dynamic structure. II. Application to human lysozyme. J. Mol. Biol. 1992b;225:477–486. doi: 10.1016/0022-2836(92)90933-b. [DOI] [PubMed] [Google Scholar]
- Kidera A, Matsushima M, Go N. Dynamic structure of human lysozyme derived from X-ray crystallography: normal mode refinement. Biophys. Chem. 1994;50:25–31. doi: 10.1016/0301-4622(94)85017-8. [DOI] [PubMed] [Google Scholar]
- Lu M, Poon B, Ma J. A new method for coarse-grained elastic normal-mode analysis. J. Chem. Theor. Comp. 2006;2:464–471. doi: 10.1021/ct050307u. [DOI] [PMC free article] [PubMed] [Google Scholar]
- Ma J. New advances in normal mode analysis of supermolecular complexes and applications to structural refinement. Curr. Protein Pept. Sci. 2004;5:119–123. doi: 10.2174/1389203043486892. [DOI] [PMC free article] [PubMed] [Google Scholar]
- Ma J. Usefulness and limitations of normal mode analysis in modeling dynamics of biomolecular complexes. Structure. 2005;13:373–380. doi: 10.1016/j.str.2005.02.002. [DOI] [PubMed] [Google Scholar]
- Moczydlowski E. Chemical basis for alkali cation selectivity in potassium-channel proteins. Chem. Biol. 1998;5:R291–R301. doi: 10.1016/s1074-5521(98)90288-5. [DOI] [PubMed] [Google Scholar]
- Murshudov GN, Vagin AA, Dodson EJ. Refinement of macromolecular structures by the maximum-likelihood method. Acta Crystallogr. D Biol. Crystallogr. 1997;53:240–255. doi: 10.1107/S0907444996012255. [DOI] [PubMed] [Google Scholar]
- Poon BK, Chen X, Lu M, Vyas NK, Quiocho FA, Wang Q, Ma J. Normal mode refinement of anisotropic thermal parameters for a supramolecular complex at 3.42-Å crystallographic resolution. Proc. Natl. Acad. Sci. USA. 2007;104:7869–7874. doi: 10.1073/pnas.0701204104. [DOI] [PMC free article] [PubMed] [Google Scholar]
- Schomaker V, Trueblood KN. On the rigid-body motion of molecules in crystals. Acta Crystallogr. B. 1968;24:63–76. [Google Scholar]
- Shen Y, Kong Y, Ma J. Intrinsic flexibility and gating mechanism of the potassium channel KcsA. Proc. Natl. Acad. Sci. USA. 2002;99:1949–1953. doi: 10.1073/pnas.042650399. [DOI] [PMC free article] [PubMed] [Google Scholar]
- Tirion MM. Large amplitude elastic motions in proteins from a single-parameter, atomic analysis. Phys. Rev. Lett. 1996;77:1905–1908. doi: 10.1103/PhysRevLett.77.1905. [DOI] [PubMed] [Google Scholar]
- Zhou Y, Morais-Cabral JH, Kaufman A, MacKinnon R. Chemistry of ion coordination and hydration revealed by a K+ channel-Fab complex at 2.0Å resolution. Nature. 2001;414:43–48. doi: 10.1038/35102009. [DOI] [PubMed] [Google Scholar]


