

Abstract
Proper cholesterol transport is essential to healthy cellular activity and any abnormality can lead to several fatal diseases. However, complete understandings of cholesterol homeostasis in the cell remains elusive, partly due to the wide variability in reported values for intra- and intermembrane cholesterol transport rates. Here, we used time-resolved small-angle neutron scattering to measure cholesterol intermembrane exchange and intramembrane flipping rates, in situ, without recourse to any external fields or compounds. We found significantly slower transport kinetics than reported by previous studies, particularly for intramembrane flipping where our measured rates are several orders of magnitude slower. We unambiguously demonstrate that the presence of chemical tags and extraneous compounds employed in traditional kinetic measurements dramatically affect the system thermodynamics, accelerating cholesterol transport rates by an order of magnitude. To our knowledge, this work provides new insights into cholesterol transport process disorders, and challenges many of the underlying assumptions used in most cholesterol transport studies to date.
Introduction
Cholesterol is an important structural component of most cell membranes contributing to their organization, dynamics, and bending modulus; regulating their interactions with the cytoskeleton; and in some cases controlling the functions of membrane proteins crucial for several transmembrane signaling processes (1–3). Healthy cells maintain a cholesterol gradient along the exocytic path from the endoplasmic reticulum to the plasma membrane, with only 0.05% to 1% of the cellular cholesterol residing in the endoplasmic reticulum, whereas 60–70% resides in the plasma membrane. It has been suggested that this cholesterol homeostasis is maintained by the intrinsic ability of lipid membranes to selectively accept and reject cholesterol from their surface (2,4). The significance of cholesterol transport is clear: dysfunction in cholesterol transport leads to several rare monogenic diseases such as lysosomal cholesterol-sphingolipid storage diseases, and has even been linked to severe disorders such as the fatal neurodegenerative disease Niemann Pick Type-C and Alzheimer's disease (1).
This essential role of cholesterol trafficking within the cell has led to numerous studies that aim to understand and quantify the kinetics of cholesterol transport processes using model lipid systems (5–13). However, progress in this area has been hampered by the wide variation in inter- and intramembrane cholesterol transport rates reported in the literature (2,14). Indeed, the reported half-life for transmembrane cholesterol flipping varies by five to six orders of magnitude, ranging from several hours (10–12) to a few seconds (5,8,9) down to even a few milliseconds (13,15). On the other hand, the reported half-lives for intermembrane exchange vary by only an order of magnitude, ranging from many hours (10) down to tens of minutes (6). These are often accompanied by the surprising finding that 20–40% of the cholesterol is nontransferable, indicating that the cholesterol does not equilibrate completely between vesicles, at least on the time scale of the measurements.
Most studies do not discuss at much length either the effects of using different systems (exact nature of phosphatidylcholines, cholesterol/lipid ratio, concentration, size of vesicle, doping of phosphatidylcholines with charged lipids), or the effect of temperature, suggesting that the rates are not significantly affected. Thus, it is difficult to compare values from different studies on the same system as it is impossible to distinguish the effect of varying experimental parameters from those introduced by the experimental technique used. However, in at least one case we found that the reported transmembrane flipping rates for very similar conditions of cholesterol in red blood cells at 37°C, still differ by a few orders of magnitude from several hours (16,17) to a few seconds (18,19).
A potential source for these discrepancies is the well-appreciated limitation that every experimental technique used to date introduces external fields or compounds, which must be assumed, but can never be shown, to minimally affect the rate being measured. Indeed, the reported values for cholesterol flipping rates between different labeled cholesterol analogs vary by several orders of magnitude ranging from seconds to hours (5,10). Similarly, extraneous compounds such as cyclodextrin and cholesterol oxidase are often introduced to measure cholesterol flipping rates assuming that these molecules do not affect the flipping process (5,8,9,12). A few studies have begun to challenge this claim (14,16,20), supported in part by the observation that the measured half-life for cholesterol flipping varies from hours at low cholesterol oxidase concentrations (12) to seconds (9) at higher cholesterol-oxidase concentrations. Finally, most of the studies of cholesterol exchange kinetics involve mixing cholesterol donor and acceptor vesicles requiring a periodic isolation step to assay the amount of cholesterol exchanged, introducing additional uncertainties (2).
In this study, we circumvent these potential limitations by using time-resolved small-angle neutron scattering (TR-SANS) as an in situ probe of cholesterol transfer rates in the absence of chemical tags or extraneous compounds. Neutrons scatter through interaction with the nuclei and are therefore sensitive to the particular isotope used. Thus, isotopic labeling can be used to hide or highlight different components in a system or even different parts of molecules. SANS has been highly successful in the study of soft condensed matter for over 30 years. In particular, in the past decade, TR-SANS has been successfully applied to study the exchange rate of polymer chains between polymer micelles (21) and more recently to study the residence time of lipids within a vesicle (22). Here, we extend that technique to look at the exchange rates of cholesterol in between vesicles. Interestingly, for the 1-palmitoyl-2-oleoyl-sn-glycero-3-phosphocholine (POPC) systems studied here we find that the flipping rates are in general slower than the exchange rates. By measuring the kinetic rate constants at several temperatures, we extract the energy of activation for both the flipping and the exchange processes. We also demonstrate that even the relatively benign ergosta-5,7,9(11),22-tetraen-3β-ol (DHE) can dramatically alter the kinetics. We further show that besides accelerating the intermembrane exchange rate, the commonly used cyclodextrin for measuring flipping rates actually significantly affects the intramembrane kinetics. Our results lead us to question the fundamental driving forces behind cholesterol transport.
Materials and Methods
Vesicle preparation
1-Palmitoyl(d31)-2-oleoyl-sn-glycero-3-phosphocholine (dPOPC with one of the two chains deuterated), cholesterol, dehydroergosterol or DHE, cholesterol 3-sulfate, and the extruder setup were purchased from AVANTI POLAR LIPIDS (Alabaster, AL). The lipids were used as received. Small unilamellar vesicles (SUVs) were prepared by the extrusion method described elsewhere (23). In short, the desired lipid mixtures were prepared in powdered form and then dissolved in chloroform. Chloroform was used to ensure the proper mixing of cholesterol and lipids. The chloroform was then removed by passing a stream of dry nitrogen over the samples. The samples were further dried by placing in a vacuum oven overnight at 50°C. These mixtures were then hydrated with solvents made of appropriate ratios of D2O and H2O for the particular contrast desired (see section on Contrast Matching below). Finally, these aqueous solutions were extruded through 100 nm polycarbonate filters to produce the SUVs. To verify the stability of the vesicles over the temperature and time ranges of these experiments, SANS patterns from pure vesicle solutions at 60°C and 20°C were measured over time. The vesicles were stable over three days in this temperature range.
Small-angle neutron scattering
SANS measurements were performed on the NG7 and NG3 30 m SANS instruments at the National Institute of Standard and Technology (NIST), Gaithersburg, MD, and on D22 in ILL in Grenoble France. Measurements were made at a single instrument configuration covering a q-range of 0.003 ≤ q ≤ 0.025 Å−1. Here, q is the scattering vector given by , where θ is the scattering angle and λ is the neutron wavelength. The wavelength used was 6 Å. Data were collected using a 2-D detector and reduced using the reduction package provided by the NIST (24) and the GRASP package provided by ILL (25). For the kinetic studies, the reduced intensities were integrated over the whole detector and plotted and analyzed as a function of time.
Contrast matching
To render the lipid vesicles invisible for this study, the scattering length density (SLD or scattering power) of the vesicles were matched to that of the solvent by using a mixture of D2O and H2O (D2O and H2O have very different SLDs). The proper ratio was determined by measuring the SANS pattern from dPOPC vesicles in varying mixtures of D2O and H2O. The macroscopic cross section of noninteracting vesicles is given by
where P(Q) is the form factor of the vesicle, n is the number density of vesicles, and V the volume of one vesicle. The contrast match point (point at which the SLD difference equals zero) is obtained by plotting the square root of the macroscopic cross section versus the volume fraction of D2O. The match point (point where the cross section goes to zero) was found to be at a volume fraction of 48.6% D2O/H2O. The contrast match point was then tested by measuring pure vesicles in a 48.6 volume % D2O solvent that yielded a completely flat SANS pattern (see Fig. 2 A), indicating that a near perfect contrast match was achieved. All further experiments in this study were performed in 48.6% D2O.
Figure 2.
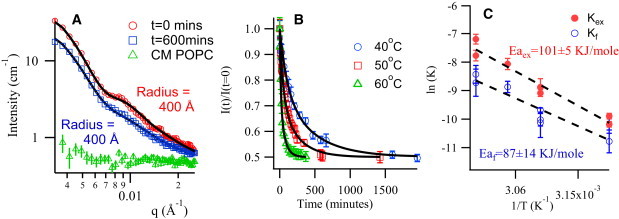
(A) Scattering curves for a sample with donor (cholesterol + dPOPC) and acceptor (dPOPC) vesicles mixed together at t = 0 (open red circles) and t = 600 min (open blue squares) showing that the vesicle size and shape remain unchanged during the experiment. The solid lines are form factor fits to the data. The open green triangle data are for a pure system of (dPOPC) and shows that complete contrast matching condition is achieved. Note that the error bars represent ± σ as propagated from the counting statistics of the experiment. (B) Normalized intensity as a function of time for three temperatures (note 55°C data has been omitted for clarity), with corresponding fits, showing the temperature dependence of cholesterol transport kinetics in POPC vesicles. (C) Arrhenius fits for flipping and exchange rates. Note that some error bars are larger than others and can obscure data points with smaller errors. All data were used in the regression appropriately weighted for their uncertainty.
Cholesterol transfer measurements
To estimate the cholesterol transfer rates, two vesicle populations were prepared: Donor dPOPC vesicles containing 35 mol % cholesterol and acceptor dPOPC vesicles without cholesterol. To measure transfer rates of cholesterol-sulfate and DHE, donor vesicles made of dPOPC/cholesterol-sulfate (65/35) and dPOPC/DHE (65/35), respectively, were prepared. Both donor and acceptor vesicle populations were prepared using the 48.6 volume % D2O solvent to contrast match the dPOPC. At t = 0 equal portions of donor and acceptor vesicle solutions were mixed together and SANS patterns were measured as a function of time. For each time point, the scattered intensity was corrected for solvent scattering (by subtracting the scattered intensity from a pure solvent sample) and integrated over the q range of 0.003 < q < 0.02 Å−1.
To make an unambiguous determination of the scattering intensity at t = 0, an aliquot of donor vesicles was mixed with an equivalent volume of pure solvent (i.e., solution devoid of acceptor vesicles). This avoids any change in intensity between the time of mixing and that of the first measurement and also serves as a check as to how much of the kinetics were missed during the time required for mixing, placing in the machine, and starting the data acquisition.
The integrated intensity normalized to that at time t = 0 is then plotted as a function of time to produce decay curves (see Fig. 2 B). The scattering patterns were collected long enough to ensure equilibrium was reached. A schematic of the process is shown in Fig. 1 A.
Figure 1.
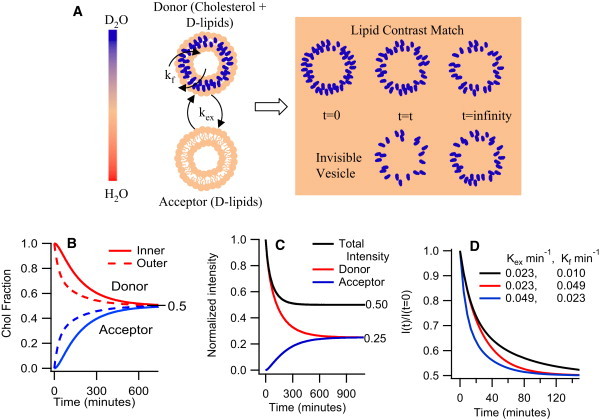
(A) Schematic of experimental protocol: Donor and acceptor vesicles made of dPOPC with a matrix (solvent) completely matched to the lipids rendering them invisible to neutrons. At t = 0, only the donor vesicles are visible as they contain cholesterol, the only visible component in the mixture. As cholesterol moves from donor to acceptor vesicle, the acceptor vesicles gradually begin to appear. (B) Cholesterol fractions in the inner and outer monolayers of the donor and acceptor vesicles as a function of time assuming cholesterol exchange follows first order kinetics and Kex and Kf = 0.01 min−1. (C) Contribution to the normalized intensity from the donor and acceptor vesicles as a function of time assuming the rates above. (D) Plot of normalized intensity decay curves illustrating the relative effects of Kex and Kf on the decay curves.
The following model was fit to the decay curves thus obtained to extract the exchange constants and half-lives. Let and be the cholesterol concentrations in the inner and outer monolayer of the donor vesicles and and be the cholesterol concentrations in the inner and outer monolayer of the acceptor vesicles. The change in cholesterol concentration in each monolayer with respect to time can be written as
| (1) |
| (2) |
| (3) |
| (4) |
At t = 0, cholesterol is only in the donor vesicles. Assuming that at equilibrium both monolayers contain the same concentration of cholesterol, the following boundary conditions can be applied.
| (5) |
The scattering intensity of a dilute solution containing donor and acceptor vesicles is given by Eq. 6 where nd, na are the number density of donor and acceptor vesicles, Vd, Va are the volume of one donor and one acceptor vesicle, respectively, and P(Q) is the form factor for a single vesicle.
| (6) |
The scattering length density of cholesterol containing vesicles can be computed as
| (7) |
Here, , are the volume fraction of cholesterol and lipid in each vesicle. Solving Eq. 6 and Eq. 7 with the added condition that SLDsolvent = SLDlipid (since the lipid is contrast matched to the solvent), leads to the following simplified equation.
| (8) |
where x is the cholesterol fraction that has exchanged and is given by
| (9) |
At t = 0, x = 0. These equations were implemented in IGOR and used to fit the experimental data to obtain the exchange rates.
Simulated curves for the cholesterol fraction in the inner and outer monolayers of donor and acceptor vesicles as a function of time are given in Fig. 1 B. Because the intensity is proportional to the square of the cholesterol fraction in the vesicle, a 50% decrease in cholesterol concentration in the donor vesicle, leads to a drop of 75% in the scattered intensity from the original (t = 0) donor vesicles as shown in Fig. 1 C. Similarly, the increase in scattered intensity from the acceptor vesicles, which have received the cholesterol, will be only 25% of the scattered intensity of the original (t = 0) donor vesicles. This leads to a net decrease in total normalized solution intensity from 1 to 0.5 if cholesterol fully equilibrates between donor and acceptor vesicles. It is interesting to note the consequences of the set of differential equations and boundary conditions used to extract the two rate constants from the raw decay curves. In particular, it means that only Kex contributes close to t = 0 whereas, if Kf is sufficiently slow to limit the exchange, it will dominate at long times as illustrated in Fig. 1 D.
Results
In this study, we use a 40 mg/ml lipid system (∼0.04 lipid volume fraction) of 100 nm POPC vesicles as the model membrane. The experiment is illustrated schematically in Fig. 1. Hydrogen/deuterium substitution in the lipid and the solvent is used to render the vesicles completely invisible. Only the cholesterol, dispersed within the invisible vesicle membrane, is highlighted. Two populations of identically sized invisible vesicles are prepared: one contains cholesterol that serves as the donor population, while the other contains no cholesterol and serves as the acceptor population. A 0.35 mol fraction of cholesterol/lipid ratio is used in the donor population to roughly mimic the cholesterol content of cell membranes. The two populations are mixed in equal amounts at time t = 0 and the total scattered intensity is followed as a function of time to quantitatively track the redistribution of cholesterol between vesicles. This technique relies on the fact that for a fixed particle shape, the total scattering depends on the square of the contrast between the particle and the solvent (and in this case the contrast is just proportional to the volume fraction of cholesterol in the vesicle) and only linearly with the number density of particles (which increases by a factor of two as the acceptor vesicles, initially invisible, begin to scatter from the cholesterol that migrates to them). The net effect is that after complete exchange, the total intensity should drop by a factor of two, whereas the shape of the curve should remain unchanged. Thus, a plot of the total scattered intensity (integrated over a wide q range), normalized to the total intensity at time t = 0, will drop from 1 at t = 0, to 0.5 after complete exchange (t = infinity) as shown schematically in Fig. 1 C.
The success of this quantitative approach relies on two critical assumptions: that the pure lipid vesicles are invisible and that the integrity of the vesicles is maintained through the entire cholesterol transfer process. The data in Fig. 2 A demonstrate the validity of these assumptions, showing no scattering above background for our pure dPOPC. Simple visual inspection of the data for the cholesterol donor/acceptor system, at 50°C, at time t = 0 and t = 600 min (10 h) indicates the two curves are identical except for being offset by a factor of two, demonstrating that the vesicles do not change during the course of the exchange. A vesicle form factor fits both curves with the parameters corresponding to cholesterol decorated vesicles. Lack of any modulation to the vesicle form factor suggests that cholesterol is homogeneously distributed throughout each vesicle rather than forming domains. Furthermore, as shown in Fig. 2 B, the normalized intensity decay curves asymptote to 0.5, corresponding to an equal distribution of cholesterol between donor and acceptor vesicles at equilibrium. It is interesting to note that this result is at odds with some previous observations, which suggest that up to 40% of the cholesterol is not transferable from donor to acceptor vesicles in POPC systems, at least in the 24°C to 37°C temperature range (6,26). However, the present results are consistent with other reports that do not find such nontransferable cholesterol (10,27–29) and with the long held understanding that cholesterol does not have specific interactions with unsaturated lipids, such as POPC, and thus does not form clusters or complexes with them.
Although the normalized intensity decay data of Fig. 2 B can be modeled as a single decay process, the fit is not very satisfactory and a two-process model provides a much better description of the data. As is typically done for these systems, two pools of cholesterol are considered: one in the inner monolayer and the other in the outer monolayer. Cholesterol in the outer monolayer is directly available for exchange, whereas cholesterol in the inner monolayer can only exchange after flipping to the outer monolayer thereby limiting the exchange rates. If the flipping rate is very fast compared to the exchange rate one would only measure one decay process. However, if it is much slower, the cholesterol in the outer monolayer will deplete before that in the inner monolayer can replenish the reservoir leading to two distinct decay times. Modeling the data as the result of two kinetic processes leads to a set of differential equations, which can be solved to yield two effective rate constants, Kf and Kex, that describe the rate at which the cholesterol molecules flip from the inner to the outer monolayer and the rate at which they exchange between two separate vesicles, respectively (see Materials and Methods for details). This is shown schematically in Fig. 1 B for Kex = Kf = 0.01 min−1. Applying the above analysis to the experimental data of Fig. 2 B leads to excellent fits of the decay curves. The results are given in Table 1.
Table 1.
Intra- and intermembrane diffusion rates and half-lives for cholesterol transport in POPC vesicles at 50°C
| Kf (min−1) | T1/2_f (min) | Kex (min−1) | T1/2_ex (min) | |
|---|---|---|---|---|
| Cholesterol | 0.0035 ± 0.0002 | 200 ± 13 | 0.0079 ± 0.0002 | 88 ± 2 |
| Cholesterol-sulfate | 0.0038 ± 0.0005 | 182 ± 25 | 0.15 ± 0.03 | 4.6 ± 0.8 |
| DHE | 0.03 ± 0.01 | 22 ± 7 | 0.033 ± 0.003 | 21 ± 2 |
| Cholesterol with β-cyclodextrin | 021 ± 0.002 | 33 ± 3 | 0.055 ± 0.003 | 12.5 ± 0.6 |
Cholesterol measurement was repeated three times and the weighted averages are reported here.
To extract the energetics of the system, we performed the same experiment at three other temperatures: 40°C, 55°C, and 60°C. The temperature-dependent rate constants were plotted as an Arrhenius function in Fig. 2 C. For the POPC model membrane system used in this study, we measured an enthalpy of activation of 87 ± 14 kJ/mol for flipping and 101 ± 5 kJ/mol for exchange. This leads to a couple of observations. The first is that the temperature dependence of the rates seems more significant than one might infer from the existing literature (7,30,31). The second is that the activation energy for flipping is similar to that of exchange. This last is somewhat surprising as the relatively small hydrophilic moiety on the cholesterol, coupled with an extremely low solubility in aqueous medium of a few nanomolar, has led to the widely held belief that flipping would be much easier than exchange (8,32).
To further probe the validity of this two-process model, cholesterol was replaced with cholesterol sulfate. The cholesterol-sulfate molecule is structurally very similar to cholesterol, but the sulfate group makes the headgroup far more hydrophilic. Thus, the flipping rate, requiring the hydrophilic headgroup to transit through the lipidic interior of the membrane, should be significantly slowed, while the exchange rate, requiring the molecule to transit through the aqueous phase, would be expected to increase, allowing us to more rigorously decouple the exchange and flipping processes. The decay curve for cholesterol-sulfate in POPC vesicles at 50°C is shown in Fig. 3 A. It is immediately clear that there are two very distinct decays. The breakpoint in the decay curve occurs after 11 ± 0.5 min with a normalized intensity of 0.625 ± 0.025, whereas the very slow decay requires nearly 17 h to achieve the equilibrium value of 0.5. The breakpoint value of 0.625 means exactly 25% of the cholesterol is transferred from the donor to the acceptor vesicles in the first process. This further supports our simple two step model in which the 50% of the cholesterol in the outer monolayer of the donor vesicles fully equilibrates between vesicle populations long before the 50% in the inner monolayer can flip to the outer monolayer and thus become available to participate in the exchange.
Figure 3.
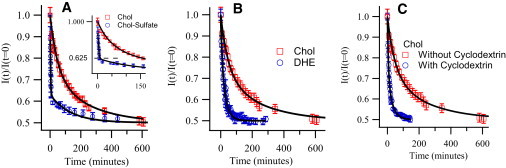
(A) Comparison of normalized intensity decay curves for normal cholesterol and cholesterol-sulfate in POPC vesicles at 50°C (inset expands the view at the breakpoint). (B) Comparison of normalized intensity decay curves for DHE and normal cholesterol in POPC vesicles at 50°C. (C) Comparison of normalized intensity decay curves for cholesterol in POPC vesicles with and without the presence of 2 mM cyclodextrin at 50°C.
Time-resolved SANS offers the versatility to measure tagged and untagged molecules alike, and therefore, it is possible to begin addressing questions concerning possible artifacts in reported flipping and exchange kinetics due to the necessity, using most current methodologies, of inferring the cholesterol transport properties from those of chemically altered cholesterol, or by use of extraneous compounds that may alter the energetics of the system.
First, we looked at the effect of using DHE as a cholesterol mimic. DHE is an extensively used self-fluorescent cholesterol analog due to its similarities to cholesterol in structure, organization, and dynamics (7,33). Indeed, it has been shown that DHE exhibits a similar segregation behavior to cholesterol when residing in lipid membranes (34) and that its distribution within cells is the same as that of cholesterol (35,36). In addition, several studies have suggested that the transport properties of DHE are similar to those of cholesterol based on comparisons of transport properties of DHE and tritium-labeled cholesterol (radio-labeled) (5,6,35). For this experiment, we replaced cholesterol with DHE while keeping the above sample preparation and protocols identical. Fig. 3 B compares the normalized intensity decay curves for DHE and cholesterol at 50°C. These data show that both the flipping and exchange rates for DHE are much faster than for cholesterol. The fitted half-life for DHE exchange at 50°C is 21 ± 2 min compared to 88 ± 2 min for true cholesterol. Likewise, the flipping half-life for DHE at that temperature is measured to be 22 ± 7 min as compared to 200 ± 13 min for cholesterol. These significant differences lead us to question the use of DHE as a cholesterol mimic for studies of cholesterol transport.
To study the effect of extraneous components we chose cyclodextrin. Cyclodextrin is commonly used in measurements aimed at estimating the intramembrane cholesterol flipping rates. This molecule is known to alter the intermembrane exchange rate by increasing the cholesterol solubility in the aqueous medium, but the argument is made that it does not affect the inner monolayer and therefore does not affect the flipping (5,8,9,12,19,37,38). To test the assumption that cholesterol transmembrane flipping is not affected by presence of cyclodextrin, we repeated the previous cholesterol transport measurements in the presence of 2 mM cyclodextrin, a concentration consistent with that used in cholesterol flipping studies. The data are shown in Fig. 3 C. As expected, the intermembrane exchange rate of the cholesterol increases significantly, in agreement with previously reported results (8). The flipping rate however also increases by an order of magnitude. As reported in Table 1, the presence of cyclodextrin dropped the half-life for cholesterol flipping from 200 ± 13 min to 33 ± 3 min. This result clearly puts into question the assumptions underlying the use of cyclodextrin for the accurate measurement of cholesterol flipping kinetics and suggests that care should be taken in interpreting those results.
Discussion
Our data, using noninvasive in situ measurements, clearly challenge many of the assumptions made in previous studies and more generally highlight the difficulty in using chemical tags or additives to understand the transport properties and energetic of self-assembled systems. Furthermore, this work establishes time-resolved SANS as a powerful tool for elucidating the myriad of contributions to the kinetics of these complex and interacting systems.
One of the more surprising results of this study is the relatively high energy barrier for cholesterol transmembrane flipping, with an activation energy similar to that for cholesterol exchange and a flipping half-life of a few hours. The largest reported activation energy we are aware of is only half the activation energy measured here (30,31), several older studies have reported cholesterol flipping times of a few hours (10–12) for a wide variety of lipid membrane compositions and temperatures, there are numerous more recent reports suggesting that cholesterol can flip within a few seconds or even milliseconds (5,8,13,15). These latter values are supported by recent molecular dynamic simulations (32) and are more consistent with the simple molecular picture of cholesterol as mostly hydrophobic with a small hydrophilic moiety. Cholesterol would therefore flip easily within the hydrophobic membrane while exchanging slowly between membranes due to the extremely low solubility in aqueous medium of a few nanomolar (8,32). This simple picture is however clearly at odds with our data. Moreover, the cholesterol-sulfate system presented in this work, while dramatically decreasing the energy barrier to exchange, as expected, did not significantly alter the transmembrane flipping time. Combined, these observations suggest that, at least in this POPC system, the mechanism for cholesterol flipping between the inner and outer monolayer may not be dominated by hydrophobic/hydrophilic interactions between the lipids and cholesterol. Other drivers might include cholesterol-lipid steric interactions, the energetics of lipid tail packing, and even Van der Waals interactions.
The dramatic effect on cholesterol transfer rates originating from such apparently innocuous actions as the addition of small amounts of cyclodextrin or the substitution of chemically tagged cholesterol, allows us to both reconcile our results with the existing literature and indeed begins to explain the wide variability in those reported values. Moreover, the upper limit on reported life times for exchange seems to be in the hour's regime, which is close to what we observe at 50°C. Lower temperatures, where most of the reported values are measured, would have much longer lifetimes, of perhaps even days rather than hours. A possible explanation for the discrepancy is that after several hours it becomes hard to discern any change in cholesterol distribution over the course of the experimental sampling times, which may lead to an erroneous conclusion that the experiment has reached equilibrium. Besides explaining the relatively weak temperature dependence found in previous studies, such a hypothesis would also explain the surprising reports of nontransferable cholesterol, since the time reported would, in fact, be far from the true equilibration time. In fact, at least one study found that the amount of nonexchangeable cholesterol decreases with time (27), strongly supporting the idea that the observation of nonexchangeable cholesterol may just be the signature of a very slow kinetic process. This would eliminate the thermodynamic conundrum of having to explain how a fraction of the cholesterol becomes stuck in a lipid system such as POPC, which, unlike saturated lipids, is thought to have no specific interactions with cholesterol. Complete exchange was observed for all systems studied here (cholesterol, cholesterol-sulfate, DHE, and cholesterol + cyclodextrin).
Certainly, the cell membrane is a rich and complex environment and it is easy to see, given this exquisite sensitivity of cholesterol transport to the details of that environment, how organisms might be able to very finely tune the cholesterol balance within their cellular structures. Furthermore, the slower cholesterol flipping rates detailed in this work provide a clear path to explaining the higher cholesterol concentration in the cytoplasmic leaflet over that in the extracellular leaflet. Lipid-cholesterol interactions alone cannot generate such an asymmetry as unsaturated lipids, more prevalent in the cytoplasmic leaflet, which show much lower affinity for cholesterol than the saturated lipids present in the extracellular leaflet of the bilayer. The suggestion that this cholesterol asymmetry is regulated by transporter proteins on the other hand (and in fact any active pumping mechanism) is only reasonable if cholesterol transmembrane flipping rates are relatively slow.
Acknowledgments
This work utilized facilities supported in part by the National Science Foundation under agreement No. DMR- 0944772. U.P.-S. and S.G. acknowledge support from the U.S. Department of Energy, Office of Science, under contract No. DE-AC02-06CH11357.
Certain commercial materials are identified in this article to foster understanding. Such identification does not imply recommendation or endorsement by the National Institute of Standards and Technology, nor does it imply that the materials or equipment identified are necessarily the best available for the purpose.
Contributor Information
S. Garg, Email: sgarg@anl.gov.
L. Porcar, Email: porcar@ill.fr.
P.D. Butler, Email: paul.butler@nist.gov.
U. Perez-Salas, Email: ursulaps@uic.edu.
References
- 1.Maxfield F.R., Tabas I. Role of cholesterol and lipid organization in disease. Nature. 2005;438:612–621. doi: 10.1038/nature04399. [DOI] [PubMed] [Google Scholar]
- 2.Maxfield F.R., Wüstner D. Intracellular cholesterol transport. J. Clin. Invest. 2002;110:891–898. doi: 10.1172/JCI16500. [DOI] [PMC free article] [PubMed] [Google Scholar]
- 3.Ikonen E. Cellular cholesterol trafficking and compartmentalization. Nat. Rev. Mol. Cell Biol. 2008;9:125–138. doi: 10.1038/nrm2336. [DOI] [PubMed] [Google Scholar]
- 4.Soccio R.E., Breslow J.L. Intracellular cholesterol transport. Arterioscler. Thromb. Vasc. Biol. 2004;24:1150–1160. doi: 10.1161/01.ATV.0000131264.66417.d5. [DOI] [PubMed] [Google Scholar]
- 5.John K., Kubelt J., Herrmann A. Rapid transbilayer movement of the fluorescent sterol dehydroergosterol in lipid membranes. Biophys. J. 2002;83:1525–1534. doi: 10.1016/S0006-3495(02)73922-2. [DOI] [PMC free article] [PubMed] [Google Scholar]
- 6.Nemecz G., Fontaine R.N., Schroeder F. A fluorescence and radiolabel study of sterol exchange between membranes. Biochim. Biophys. Acta. 1988;943:511–521. doi: 10.1016/0005-2736(88)90384-7. [DOI] [PubMed] [Google Scholar]
- 7.Estronca L.M.B.B., Moreno M.J., Vaz W.L.C. Kinetics and thermodynamics of the association of dehydroergosterol with lipid bilayer membranes. Biophys. J. 2007;93:4244–4253. doi: 10.1529/biophysj.107.112847. [DOI] [PMC free article] [PubMed] [Google Scholar]
- 8.Leventis R., Silvius J.R. Use of cyclodextrins to monitor transbilayer movement and differential lipid affinities of cholesterol. Biophys. J. 2001;81:2257–2267. doi: 10.1016/S0006-3495(01)75873-0. [DOI] [PMC free article] [PubMed] [Google Scholar]
- 9.Backer J.M., Dawidowicz E.A. Transmembrane movement of cholesterol in small unilamellar vesicles detected by cholesterol oxidase. J. Biol. Chem. 1981;256:586–588. [PubMed] [Google Scholar]
- 10.Rodrigueza W.V., Wheeler J.J., Hope M.J. Transbilayer movement and net flux of cholesterol and cholesterol sulfate between liposomal membranes. Biochemistry. 1995;34:6208–6217. doi: 10.1021/bi00018a025. [DOI] [PubMed] [Google Scholar]
- 11.Poznansky M.J., Lange Y. Transbilayer movement of cholesterol in phospholipid vesicles under equilibrium and non-equilibrium conditions. Biochim. Biophys. Acta. 1978;506:256–264. doi: 10.1016/0005-2736(78)90396-6. [DOI] [PubMed] [Google Scholar]
- 12.Pal R., Barenholz Y., Wagner R.R. Effect of cholesterol concentration on organization of viral and vesicle membranes. Probed by accessibility to cholesterol oxidase. J. Biol. Chem. 1980;255:5802–5806. [PubMed] [Google Scholar]
- 13.Hamilton J.A. Fast flip-flop of cholesterol and fatty acids in membranes: implications for membrane transport proteins. Curr. Opin. Lipidol. 2003;14:263–271. doi: 10.1097/00041433-200306000-00006. [DOI] [PubMed] [Google Scholar]
- 14.Gimpl G., Gehrig-Burger K. Cholesterol reporter molecules. Biosci. Rep. 2007;27:335–358. doi: 10.1007/s10540-007-9060-1. [DOI] [PubMed] [Google Scholar]
- 15.Bruckner R.J., Mansy S.S., Szostak J.W. Flip-flop-induced relaxation of bending energy: implications for membrane remodeling. Biophys. J. 2009;97:3113–3122. doi: 10.1016/j.bpj.2009.09.025. [DOI] [PMC free article] [PubMed] [Google Scholar]
- 16.Brasaemle D.L., Robertson A.D., Attie A.D. Transbilayer movement of cholesterol in the human erythrocyte membrane. J. Lipid Res. 1988;29:481–489. [PubMed] [Google Scholar]
- 17.Schroeder F., Nemecz G., Devaux P.F. Transmembrane distribution of sterol in the human erythrocyte. Biochim. Biophys. Acta. 1991;1066:183–192. doi: 10.1016/0005-2736(91)90185-b. [DOI] [PubMed] [Google Scholar]
- 18.Lange Y., Dolde J., Steck T.L. The rate of transmembrane movement of cholesterol in the human erythrocyte. J. Biol. Chem. 1981;256:5321–5323. [PubMed] [Google Scholar]
- 19.Steck T.L., Ye J., Lange Y. Probing red cell membrane cholesterol movement with cyclodextrin. Biophys. J. 2002;83:2118–2125. doi: 10.1016/S0006-3495(02)73972-6. [DOI] [PMC free article] [PubMed] [Google Scholar]
- 20.Thurnhofer H., Gains N., Hauser H. Cholesterol oxidase as a structural probe of biological membranes: its application to brush-border membrane. Biochim. Biophys. Acta. 1986;856:174–181. doi: 10.1016/0005-2736(86)90024-6. [DOI] [PubMed] [Google Scholar]
- 21.Lund R., Willner L., Richter D. Equilibrium exchange kinetics in PEP-PEO block copolymer micelles. A time resolved SANS study. Physica B. 2006:385–386. 735–737. [Google Scholar]
- 22.Nakano M., Fukuda M., Handa T. Determination of interbilayer and transbilayer lipid transfers by time-resolved small-angle neutron scattering. Phys. Rev. Lett. 2007;98:238101. doi: 10.1103/PhysRevLett.98.238101. [DOI] [PubMed] [Google Scholar]
- 23.MacDonald R.C., MacDonald R.I., Hu L.-R. Small-volume extrusion apparatus for preparation of large, unilamellar vesicles. Biochim. Biophys. Acta. 1991;1061:297–303. doi: 10.1016/0005-2736(91)90295-j. [DOI] [PubMed] [Google Scholar]
- 24.Kline S. Reduction and analysis of SANS and USANS data using IGOR Pro. J. Appl. Cryst. 2006;39:895–900. [Google Scholar]
- 25.GRASP. 2010. Developed by Charles Dewhurst at ILL. http://www.ill.eu/instruments-support/instruments-groups/groups/lss/grasp/home/.
- 26.Schroeder F., Butko P., Scallen T.J. Interaction of fluorescent delta 5,7,9(11),22-ergostatetraen-3 beta-ol with sterol carrier protein-2. J. Biol. Chem. 1990;265:151–157. [PubMed] [Google Scholar]
- 27.Kan C.C., Bittman R. Spontaneous rates of sitosterol and cholesterol exchange between phospholipid vesicles and between lysophospholipid dispersions: evidence that desorption rate is impeded by the 24.alpha.-ethyl group of sitosterol. J. Am. Chem. Soc. 1991;113:6650–6656. [Google Scholar]
- 28.Thomas P.D., Poznansky M.J. Cholesterol transfer between lipid vesicles. Effect of phospholipids and gangliosides. Biochem. J. 1988;251:55–61. doi: 10.1042/bj2510055. [DOI] [PMC free article] [PubMed] [Google Scholar]
- 29.McLean L.R., Phillips M.C. Cholesterol transfer from small and large unilamellar vesicles. Biochim. Biophys. Acta. 1984;776:21–26. doi: 10.1016/0005-2736(84)90246-3. [DOI] [PubMed] [Google Scholar]
- 30.Phillips M.C., McLean L.R., Rothblat G.H. Mechanism of cholesterol efflux from cells. Atherosclerosis. 1980;36:409–422. [Google Scholar]
- 31.McLean L.R., Phillips M.C. Mechanism of cholesterol and phosphatidylcholine exchange or transfer between unilamellar vesicles. Biochemistry. 1981;20:2893–2900. doi: 10.1021/bi00513a028. [DOI] [PubMed] [Google Scholar]
- 32.Bennett W.F.D., MacCallum J.L., Tieleman D.P. Molecular view of cholesterol flip-flop and chemical potential in different membrane environments. J. Am. Chem. Soc. 2009;131:12714–12720. doi: 10.1021/ja903529f. [DOI] [PubMed] [Google Scholar]
- 33.Wüstner D., Herrmann A., Maxfield F.R. Rapid nonvesicular transport of sterol between the plasma membrane domains of polarized hepatic cells. J. Biol. Chem. 2002;277:30325–30336. doi: 10.1074/jbc.M202626200. [DOI] [PubMed] [Google Scholar]
- 34.Garvik O., Benediktson P., Wüstner D. The fluorescent cholesterol analog dehydroergosterol induces liquid-ordered domains in model membranes. Chem. Phys. Lipids. 2009;159:114–118. doi: 10.1016/j.chemphyslip.2009.03.002. [DOI] [PubMed] [Google Scholar]
- 35.Hao M., Lin S.X., Maxfield F.R. Vesicular and non-vesicular sterol transport in living cells. The endocytic recycling compartment is a major sterol storage organelle. J. Biol. Chem. 2002;277:609–617. doi: 10.1074/jbc.M108861200. [DOI] [PubMed] [Google Scholar]
- 36.Mukherjee S., Zha X., Maxfield F.R. Cholesterol distribution in living cells: fluorescence imaging using dehydroergosterol as a fluorescent cholesterol analog. Biophys. J. 1998;75:1915–1925. doi: 10.1016/S0006-3495(98)77632-5. [DOI] [PMC free article] [PubMed] [Google Scholar]
- 37.Dawidowicz E.A., Backer J.M. The rapid transbilayer movement of thiocholesterol in small unilamellar phospholipid vesicles. Biochim. Biophys. Acta. 1981;644:373–375. doi: 10.1016/0005-2736(81)90396-5. [DOI] [PubMed] [Google Scholar]
- 38.Besenicar M.P., Bavdek A., Anderluh G. Kinetics of cholesterol extraction from lipid membranes by methyl-[beta]-cyclodextrin–a surface plasmon resonance approach. Biochim. Biophys. Acta. 2008;1778:175–184. doi: 10.1016/j.bbamem.2007.09.022. [DOI] [PubMed] [Google Scholar]