

Abstract
We measure the stability and folding relaxation rate of phosphoglycerate kinase (PGK) Förster resonance energy transfer (FRET) constructs localized in the nucleus or in the endoplasmic reticulum (ER) of eukaryotic cells. PGK has a more compact native state in the cellular compartments than in aqueous solution. Its native FRET signature is similar to that previously observed in a carbohydrate-crowding matrix, consistent with crowding being responsible for the compact native state of PGK in the cell. PGK folds through multiple states in vitro, but its folding kinetics is more two-state-like in the ER, so the folding mechanism can be modified by intracellular compartments. The nucleus increases PGK stability and folding rate over the cytoplasm and ER, even though the density of crowders in the nucleus is no greater than in the ER or cytoplasm. Nuclear folding kinetics (and to a lesser extent, thermodynamics) vary less from cell to cell than in the cytoplasm or ER, indicating a more homogeneous crowding and chemical environment in the nucleus.
Introduction
In vitro experiments have revealed that protein folding is often a very fast reaction (microseconds to hours), and that many proteins are marginally stable (tens of kJ/mole) (1). Low stability imparts folded proteins with structural flexibility on the functionally important ns-to-ms timescale (2,3). Clear experimental examples exist of such a trade-off between folding and function (4).
Speedy folding and marginal stability result from a relatively smooth energy landscape (5). An important consequence of smoothness is that protein energy landscapes are susceptible to modulation by environmental factors. This property has been exploited in vitro by tuning protein stability with denaturants, temperature, and many other methods.
Crowding and chemical makeup (6,7) of the cell could likewise modulate protein stability and folding rates. Folding in the natural environment of the cell is interesting for several reasons. The folding reaction could be used as a nanometer-scale local probe of the cellular environment. Even more exciting is the prospect that cells could modulate their proteins' energy landscapes to control function (8), the degree of folding or misfolding (9), and protein structure (10,11).
Experiments have begun to probe biomolecular stability and folding kinetics inside living cells (8,12–14). Some experiments have focused on initial ribosomal folding (15). Others have studied posttranslational unfolding or refolding in the cell (9,12,13,16), which is also important: marginal stability means that many proteins spontaneously unfold in the cell (with notable exceptions (17) usually on a timescale less than hours, depending on the folding rate coefficient and equilibrium constant for folding). The chaperone machinery in the cell cannot assist all of these events (18).
We recently showed that unfolding and refolding of a phosphoglycerate kinase Förster resonance energy transfer (FRET) construct (FRET-PGK∗) is a highly reversible process in the cytoplasm of bone tissue cells (12,19). The cellular cytoplasm is a complex environment, but very conducive to protein folding. We also showed that PGK is slightly stabilized by the cytoplasm compared to in vitro, that its folding in the cytoplasm is spatially patterned, and that it folds more slowly in the cytoplasm, mostly due to a small (×2) increase in local viscosity (8,12,16).
Here we use two variants of FRET-PGK∗ as a probe of different intracellular folding environments. We compare our previous results in the cytoplasm with protein stability and folding kinetics in the nucleoplasm and endoplasmic reticulum (ER). Peptide localization tags introduce our PGK construct in the nucleus and ER, and we report averaged results for these organelles as well as cell-to-cell variations. How is the protein folding landscape modulated by nuclear crowding (20,21), or by the membrane-rich, but otherwise more cytoplasm-like, ER? Our three main results are:
-
1.
The native state of PGK at room temperature is more compact in cellular compartments than in aqueous solution, similar to observations made recently for Ficoll-crowded PGK (22).
-
2.
The nucleus stabilizes PGK, speeds up its folding, and provides a more homogeneous folding environment from cell-to-cell relative to the ER and cytoplasm.
-
3.
Cellular compartments can significantly affect the folding mechanism of PGK compared to in vitro: PGK is not a two-state folder in vitro (stretched exponential or multiexponential functions are required to fit its folding kinetics (23–25)), but in the ER, the measured folding kinetics approaches single-exponential folding.
Methods
Protein design, expression, and purification
Our constructs are based on the destabilized but enzymatically active Y122W/W308F/W333F mutant (PGK∗) of yeast PGK (12,22), so that its folding/unfolding can be studied without thermally denaturing other proteins in the cell. AcGFP1 (green fluorescent donor) and mCherry (red fluorescent acceptor) labels report on the compactness of PGK∗ via FRET. DNA constructs for the nuclear- and endoplasmic reticulum-(ER-)localizing versions of AcGFP1-PGK∗-mCherry (FRET-PGK∗) were cloned into the pDream 2.1/MCS vector, which enabled expression in both mammalian and Escherichia coli cells. For targeting PGK to the nucleus, three repeats of the SV40 nuclear localization sequence (26) were fused to the C-terminus of the FRET-PGK∗ sequence. The DNA sequence of the SV40 NLS was
For ER-localization, we used the calreticulin targeting sequence fused to the N-terminus of the FLAG tag preceding AcGFP1, and the KDEL sequence for retention in the ER fused to the C-terminus of mCherry (27,28). The calreticulin targeting sequence was
The KDEL retrieval sequence was
For subsequent in vitro studies, plasmids containing these constructs were transformed into E. coli BL21-CodonPlus (DE3)-RIPL cells and grown in LB media to an optical density of 1.0, at which point IPTG (final concentration 1 mM) was added to induce protein expression. After induction, cells were grown for 24 h at 30°C. Cells were collected by centrifugation and lysed using a sonicator. The cell lysate was bound to a Ni-NTA column and purified according to the manufacturer's instructions. For in vitro fluorescence experiments, we used a 5 μM aqueous solution of the protein, sealed inside a 100-μm deep imaging chamber. This provided a protein column density similar to in-cell expression. Circular dichroism (CD) experiments also were carried out in aqueous solution, at 1 μM concentration of protein. Our abbreviated protein nomenclature for this article is summarized in Table 1.
Table 1.
PGK nomenclature
| PGK | General reference to several phosphoglycerate kinase variants. |
| PGK∗ | Y122W/W308F/W333F mutant of yeast PGK 1-415. |
| FRET-PGK∗ | PGK∗ labeled with AcGFP1 (N-terminus) and mCherry (C-terminus). |
| FRET-PGK∗-NLS | FRET-PGK∗ with nuclear localization tag at C-terminus. |
| FRET-PGK∗-ER | FRET-PGK∗ with calreticulin targeting sequence (N-terminus of fusion protein) and KDEL retrieval sequence (C-terminus of fusion protein). |
Our current constructs contain two built-in crowders (the fluorescent labels). Therefore, we compare only fluorescent-labeled constructs in vitro, in Ficoll, and in cells unless otherwise stated. It will be of interest in the future to use alternative labels (e.g., dyes) that may be more hydrophobic but smaller, and alternative delivery methods (direct dye-labeled protein transfection instead of plasmid transfection) to see whether protein labeling or delivery have any effect on stability and kinetics.
Eukaryotic cell culture
For in-cell experiments, U2OS bone tissue cancer cells were grown in Dulbecco's modified Eagle's medium supplemented with 10% fetal bovine serum and penicillin-streptomycin to >70% confluency. Cells were transiently transfected using Lipofectamine with 2.5 μg of plasmid DNA for the PGK nucleus localization experiments and with 5 μg plasmid DNA for the ER experiments. Five to six hours after transfection, the cell population was split and grown on coverslips. Cells were imaged 1–3 days posttransfection. Immediately before the imaging experiments, cells were transferred into the same imaging chamber also used for in vitro studies, filled with Leibovitz L-15 media supplemented with 30% fetal bovine serum. We formed imaging chambers by putting together a coverslip with the cells onto a 1” × 3” microscope slide, separated with a 100-μm adhesive spacer. Cells remained alive, as evidenced by cell morphology (29).
FReI experiments
Fast relaxation imaging (FReI) was used to monitor kinetics and thermodynamics (Fig. 1). A small temperature jump perturbs the PGK folding equilibrium, which is monitored before and after the T-jump by FRET. Construction and operation of the FReI microscope are described in detail elsewhere (12,19). Briefly, a blue LED illuminated cells expressing the PGK fusion construct, exciting the AcGFP1 donor. The resulting two-color fluorescence (from AcGFP1=donor=D and mCherry=acceptor=A) was split into D and A images by dichroic mirrors, and imaged simultaneously onto a charge-coupled device (CCD) camera operating at 60 frames/s. All imaging was done with a 40×, 0.65 numerical aperture objective that required no oil immersion or other contact with the sample.
Figure 1.
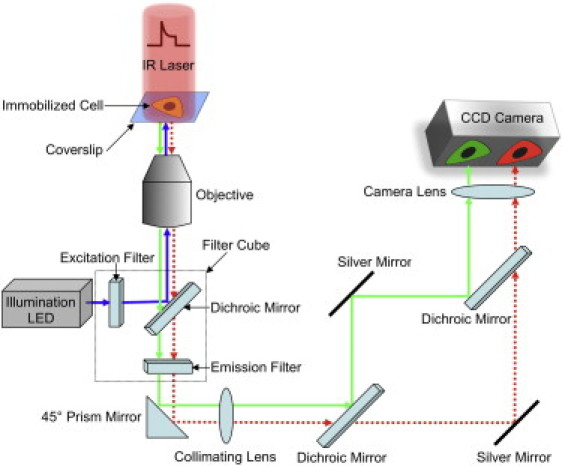
Schematic diagram of the FReI setup. Living cells expressing fluorescent-labeled PGK are placed on coverslips on the microscope stage. Cells are illuminated using a blue LED (λ = 470 nm) and the resulting two-color fluorescence is split using dichroic mirrors and imaged simultaneously onto a CCD camera. Folding/unfolding dynamics are initiated by a shaped heating pulse from an infrared diode laser (λ = 2200 nm).
In a typical FReI experiment, equilibrium data at a fixed temperature were collected for 3 s, at which point a tailored pulse from an infrared laser (λ = 2200 nm) T-jumped the cell under observation up by 4°C in 200 ms. Subsequent PGK unfolding dynamics were monitored for 15 s. The laser was then turned off, allowing the temperature to return to the pre-jump value while we monitored refolding for another 15 s. The unfolding/refolding process was >95% reversible, as judged by complete recovery of the folded FRET signal at a ≈20:1 signal/noise ratio. This agrees with the observation in Fig. 2c of Ebbinghaus et al. (12). A full temperature series for thermodynamic analysis took ∼60 min. To test reversibility over this longer period, the temperature was returned to the starting temperature for the whole kinetics/thermodynamics sequence (e.g., see 22°C in Fig. 4), and FRET was remeasured. An average of five such measurements with final temperatures in the 40–45°C range yielded a D/A ratio of 91% of the original value, with a range from 86% to 97%. This level of reversibility is acceptable when compared to in vitro folding studies, although not as good as during the shorter kinetics measurement.
Figure 2.
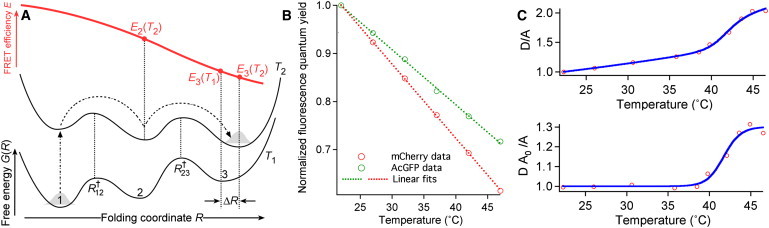
(A) Schematic energy landscape showing how protein populations shift upon a temperature jump. (B) Measured quantum yield trends (circles) of AcGFP1 and mCherry as a function of temperature, and linear fits (dotted lines). (C) Thermal denaturation of PGK (circles) represented in two different schemes, with and without linear baselines.
Figure 4.
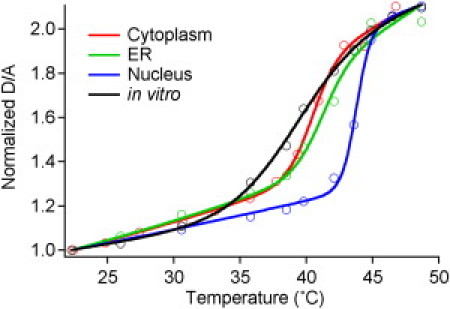
Representative experimental thermal melts (circles) of PGK in vivo in the cytoplasm, ER, and nucleus. A representative in vitro trace is shown for PGK-FRET-ER∗. Fits to the cooperative model in the text are shown as lines.
Images were analyzed using custom-written software in LabVIEW (National Instruments, Austin, TX) and MATLAB (The MathWorks, Natick, MA). The green and red channels above a minimal intensity threshold were integrated over the cell, yielding average D and A intensity values in the nucleus or ER, depending on the protein used for transfection. For the in vivo experiments, we collected data on five cells expressing FRET-PGK∗-NLS and five cells expressing FRET-PGK∗-ER.
Data analysis
The thermodynamic and kinetic data analysis has been described only briefly before, so we discuss it in more detail here. It is similar to the conventional thermal titration and T-jump kinetics analysis, but for a spatially resolved FRET signal instead of intrinsic tryptophan fluorescence. Here we focus on the analysis of average signals from entire organelles; pixel-to-pixel dynamics would require additional consideration of protein diffusion.
The FRET reaction coordinate is R, the donor-acceptor distance. The protein population ρ(R) shifts toward larger R (less folded states) upon heating, and toward smaller R (the folded state) upon cooling, for N- and C-terminal labeling (Fig. 2 A). The FRET efficiency E is given by
| (1) |
where R0 is the Förster distance. The value E depends on time t in a kinetics experiment because ρ evolves in time, and E depends on temperature in a thermodynamic titration experiment because ρ shifts with temperature. The other key property is that E[ρ] is a linear functional of the population ρ. The resulting donor and acceptor fluorescence intensities, measured separately on the CCD camera, are
| (2) |
where γD and γA are constants that depend on collection efficiency and fluorescence filters. It is assumed that filters with negligible bleed-through between D and A channels are used, as in our case. Iexc is the excitation laser intensity. D0 and A0 are the temperature-dependent donor and acceptor quantum yields. We measured both quantum yields, which are well fitted by straight lines from 22 to 50°C (Fig. 2 B).
We find that two types of signals constructed from D and A are particularly useful for thermodynamic and kinetic analysis, and yield consistent results for thermodynamic and kinetic fitting parameters:
| (3a) |
| (3b) |
Each expression has its practical advantages and disadvantages. Equation 3a requires only one nontrivial scaling factor A0(T), the ratio γA/γD being constant. However, Eq. 3a does not depend linearly on the population ρ. Equation 3b requires two temperature-dependent scaling factors. Equation 3b, on the other hand, depends linearly on E and hence on the population distribution function ρ.
For thermal denaturation experiments, we find that Eq. 3a is most suitable because it requires the least scaling by temperature-dependent quantum yields that could distort the signal. Kinetics can be fitted by either Eq. 3a or 3b. The kinetics measurement is made at constant temperature, so Eq. 3b is reduced to the simple form
| (4) |
We find Eq. 4 particularly useful for kinetics because the fit is linearly proportional to protein population.
To fit experimental data, Eqs. 3 and 4 must be coupled with a biophysical model that connects E with free energies or rate coefficients. Here we discuss two simple examples: an n-state thermodynamic model, and a stretched exponential kinetic model. Any other standard biophysical model can be implemented equally easily.
Thermodynamic fitting will be illustrated using Eq. 3. For an n-state folder, we can partition the reaction coordinate R at Rij† (Fig. 2 A) and rewrite the integral Eq. 1 as
| (5) |
The first line is exact. The second line makes the assumption of discrete thermodynamic states (i.e., ρ(Rij†) ≈ 0), where each thermodynamic state has a population ρi normalized to unity, so that the fraction of protein in state i is given by fi(T). The temperature dependence of fi(T) is the desired output because it allows relative free energies of all states to be calculated.
PGK is not a two-state folder, but its thermal unfolding, when monitored by a single probe such as FRET, is well represented by a single transition in vivo (Fig. 2 C) and in vitro. In such cases, a van' t Hoff model with only two effective states in Eq. 5 yields a satisfactory fit (30):
| (6a) |
| (6b) |
It is worth noting that the van' t Hoff model, from the point of view of fitting, is equivalent to the first-order Taylor expansion of the two-state model f2 = 1/(1 + e−ΔG(T)/RT) with ΔG(T) = CT(1)(T − Tm) + CT(2)(T − Tm)2 + …. In the latter equation, ΔG(T) is the folding free energy expanded in a Taylor series in temperature, Tm is the melting midpoint temperature, and CT(n) are expansion parameters, such that to first-order ΔH° = −CT(1)Tm and ΔS° = −CT(1). Inserting Eq. 6a into Eq. 5 and then into Eq. 3a, one obtains
| (7) |
The Ei FRET efficiencies, and the b and c baselines (as they are commonly called in thermodynamic fitting), are temperature-dependent. The temperature dependence can be intrinsic to the probe, or it can be caused by a thermodynamic state that moves by a small distance ΔR when the temperature increases from T1 to T2, changing its FRET efficiency (Fig. 2 A). When we plot the D/A ratio normalized to 1 at room temperature, there is an approximately linear baseline (Fig. 2 C). When we plot DA0/A normalized to 1 at room temperature, the baseline disappears (Fig. 2 C). This observation indicates that the baseline comes mostly from the intrinsic temperature dependence of the FRET probe. Equation 7 can be used to fit either DA0/A or D/A (if A0 is not available), by making b and c either constants or straight lines. The Tm obtained by these two methods in Fig. 2 C agree within ±0.5°C.
Kinetic fitting will be illustrated using Eq. 4. During kinetics measurements, the temperature is constant. Inserting Eq. 5 into Eq. 4 thus yields
| (8) |
Here b and c are constants because the temperature is constant after the T-jump, and the last two lines hold when there are two effective states (Eq. 6a). The factor a is not critical because of the linear dependence of population on D−aA. In practice, we find two values of a particularly useful. Selecting a so that D(t) and A(t) have the same signal/noise ratio maximizes the signal/noise ratio of the difference. Selecting a as the ratio of slopes in Fig. 2 B eliminates the effect of small temperature fluctuations from the signal (e.g., when the T-jump laser power settles in at t = 0) because D and A respond to temperature fluctuations according to the slopes in Fig. 2 B.
As a kinetic model for f1 or f2, we use
| (9) |
the same stretched exponential model to which literature PGK data have been fitted (24,31). We fitted the kinetics signal to this stretched exponential function (to describe the folding/unfolding relaxation after the T-jump) plus a small fast single exponential decay (to account for transient settling of the temperature after the laser T-jump pulse). The functional form of the equation used was
| (10) |
The kinetics were fit globally, with the same time constant for the instrument response (τlaser = 200 ms) and a used for all data sets. The dead-time for the measurements is thus ∼200 ms.
Results
All FRET-PGK∗ constructs have similar stability in vitro
Table 1 summarizes the nomenclature of FRET-labeled PGK with nuclear or ER localization tags. We measured the thermal stability of FRET-labeled PGKs by FRET and circular dichroism (CD). CD correlates with overall secondary structure, whereas FRET correlates with overall compactness. The FRET melting curve of FRET-PGK∗-ER is shown in Fig. 4 (solid trace). The other in vitro FRET curves and the CD curve are shown in Fig. S1 and Fig. S2 in the Supporting Material.
The FRET results for the three mutants do not vary significantly from each other. The average in vitro melting point is Tm = 38.5°C. FRET-PGK∗ yielded Tm ≈ 37.9°C, FRET-PGK∗-NLS yielded Tm of 38.8°C, and FRET-PGK∗-ER yielded Tm = 38.7°C. The nuclear and ER localization tags do not have a large effect on protein stability.
Circular dichroism yields higher melting temperatures than FRET in vitro. As discussed in Methods, PGK is not a two-state folder, even though the FRET curves can be fitted by Eq. 6 to obtain effective Tm values. CD measurements yielded a melting temperature of 44.5°C for FRET-PGK∗ in aqueous solution, and 42.5°C in 200 mg/ml Ficoll crowding agent, both significantly higher than the average FRET result of 38.5°C (Fig. S2). Thus, tertiary structure of PGK is thermally denatured more easily (38.5°C) than secondary structure (42.5–44.5°C), which represents an upper limit to the unfolding temperature.
Folded FRET-PGK∗ is more compact in cellular compartments than in vitro
Fig. 3 compares subcellular localization of the new mutants to the previous data obtained in the cytoplasm. The protein distribution is shown at 39°C (near the protein melting temperature Tm) in U2OS (human osteosarcoma) cells. In Fig. 3 A, FRET-PGK∗ is distributed throughout the cytoplasm, as expected without any peptide tags to direct it to a specific organelle. Fig. 3 B shows that FRET-PGK∗-NLS is localized to the nucleus. In Fig. 3 C, we see that FRET-PGK∗-ER is localized to the ER as a result of the calreticulin targeting sequence and the KDEL retrieval sequence. Localization to the ER is apparent as a patchiness of the fluorescence when compared to Fig. 3 A, which shows more uniform fluorescence throughout the cell.
Figure 3.

Fluorescence images showing subcellular localization of (A) FRET-PGK∗, (B) FRET-PGK∗-NLS, and (C) FRET-PGK∗-ER. AcGFP1 has a quantum yield of 0.8, whereas mCherry has a quantum yield of 0.2, so the protein appears green at elevated temperature.
In the cell, folded PGK is considerably more compact than in aqueous solution. At room temperature (22°C) all three proteins are folded, and the donor-acceptor ratios D/A we observe are similar: D/A = 6.1 ± 0.7 in the nucleus (Fig. S3), D/A = 5.8 ± 0.5 in the ER (Fig. S4), and D/A = 6.6 ± 0.3 in the cytoplasm for comparison (8). These values are very similar to the D/A ratio ≈6.5 measured for FRET-PGK∗ in 300 mg/ml Ficoll solution in Dhar et al. (22). All of these values are much smaller than the D/A ≈ 11 measured for FRET-PGK∗ in aqueous solution (Fig. S2 b and Dhar et al. (22)). The unfolded state of PGK∗ also has a smaller value in vivo than in aqueous solution (Fig. S2 b).
FRET-PGK∗ is more stable in the nucleus than in the ER or cytoplasm
We next investigated the stability of the PGK constructs in the nucleus and ER, for comparison with results previously reported for the cytoplasm (8). Thermal denaturation plots were obtained by measuring steady-state donor fluorescence D and acceptor fluorescence A at every temperature to obtain a D/A value for every temperature. The curves were fitted to Eq. 7. Fig. 4 shows representative thermodynamic melting curves in the nucleus and ER, as well as in the cytoplasm and in vitro for reference. We show the full set of melting curves for each cell in Fig. S3 and Fig. S4. The parameters obtained from the thermodynamic measurements are summarized in Table 2.
Table 2.
Thermodynamic fits
| Construct | In vitro FRET |
In vivo FRET |
||||
|---|---|---|---|---|---|---|
| Tm(°C) | CT(kJ/mol) | Mean Tm(°C) | Tm spread (°C) | CT(kJ/mol/K) | ΔH° (at Tm)(kJ/mol) | |
| FRET-PGK∗ | 37.9 ± 0.4 | 1.8 ± 0.6 | 39.9 ± 1.0 | 1.1 | 2.7 ± 1.2 | −845 |
| FRET-PGK∗-ER | 38.7 ± 0.4 | 1.0 ± 0.4 | 41.2 ± 0.4 | 1.8 | 2.4 ± 0.8 | −754 |
| FRET-PGK∗-NLS | 38.8 ± 0.4 | 4.8 ± 3.4 | 43.2 ± 0.2 | 0.8 | 4.9 ± 1.2 | −1550 |
Spread is the root of the variance for each ensemble of cells studied. The errors are ±2 SD of the mean.
Our data reveal the nucleus as the most stabilizing environment for FRET-PGK∗. In each organelle, FRET-PGK∗ is stabilized relative to its in vitro counterpart when measured by FRET. In the cytoplasm and ER, Tm increases only by 2 to 2.5°C relative to aqueous solution. In the nucleus, the PGK construct is stabilized to Tm of 43.2°C, nearly 4.5°C over aqueous solution.
The van' t Hoff enthalpies of FRET-PGK∗ and FRET-PGK∗-ER (Methods and Table 2) are close to the −600 kJ/mol expected from published correlations of total folding enthalpies as a function of protein size (30). The van' t Hoff enthalpy of FRET-PGK∗-NLS is much larger than expected in vitro because of the unusually high cooperativity observed in the nucleoplasm.
Folding kinetics is faster in the nucleus than in the ER or cytoplasm
We also measured the T-jump relaxation kinetics of the PGK constructs in the nucleus and ER, and compared it with kinetics measured in the cytoplasm (8). Relaxation kinetics was measured following a rapid temperature jump near Tm (39°C–43°C). The difference signal between green and red channels was analyzed according to Eqs. 8 and 9, yielding a relaxation time τ and a stretching factor β from exp[−(t/τ)β] in Eq. 10. The parameters obtained from kinetics experiments are summarized in Table 3. Representative T-jump relaxation traces are shown in Fig. 5 (all traces in Fig. S5 and Fig. S6). As discussed in Methods, the dead time is ∼0.2 s.
Table 3.
Kinetics fits
| Construct | In vitro FRET |
In vivo FRET |
|||
|---|---|---|---|---|---|
| τ (s) | β | Mean τ (s) | τ Spread (s) | Mean β | |
| FRET-PGK∗ | 1.4 ± 0.2 | 0.59 ± 0.02 | 2.7 ± 0.2 | 1.1 | 0.49 ± 0.10 |
| FRET-PGK∗-ER | 1.1 ± 0.2 | 0.54 ± 0.02 | 3.7 ± 0.2 | 1.0 | 0.91 ± 0.08 |
| FRET-PGK∗-NLS | 1.7 ± 0.2 | 0.57 ± 0.02 | 1.7 ± 0.2 | 0.3 | 0.60 ± 0.08 |
Spread is the root of the variance for each ensemble of cells studied. The errors are ±2 SD of the mean.
Figure 5.
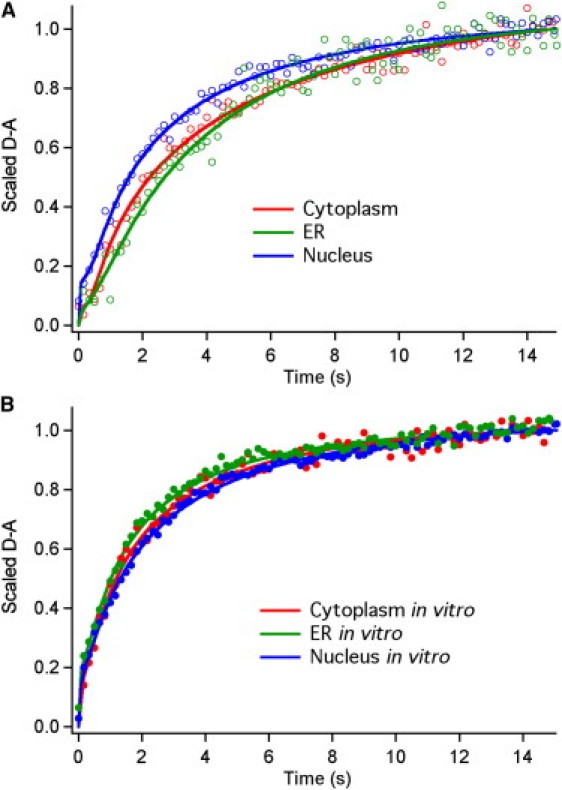
Representative kinetic traces for PGK folding kinetics in the nucleus, ER, and cytoplasm (A) in vivo (open circles) and (B) in vitro (solid circles). The lines represent fits to the data using Eq. 10.
For reference, in vitro measurements of the nuclear and ER constructs compared to the untagged FRET-PGK∗ show that relaxation kinetics is not significantly affected by the addition of the peptide leader sequences. FRET-PGK∗-ER has an average folding time of 1.1 ± 0.2 s as compared to 1.4 ± 0.2 s for PGK-FRET∗. The nuclear-tagged protein is slightly slower, with τ = 1.7 ± 0.2 s.
In vivo, PGK-FRET∗-NLS folds faster than the ER and cytoplasmic constructs, which have similar folding times. Thus the nucleus increases protein stability and speeds up folding relaxation relative to the other cellular compartments. Relative to aqueous solution, we previously showed that the cytoplasm slows down folding by a factor of 2, mostly due to increased viscosity (8). In the ER, the factor is ≈3, whereas in the nucleus, increased viscosity does not manage to overcome the reduced activation barrier. Measurement of kinetics at several temperatures near 39°C shows that the relaxation rate changes by <25% over the 0.5–2°C range by which the ER or nuclear Tm differs from the cytoplasm. Thus, the relatively faster rate of nuclear folding is not simply due to a temperature dependence of the rate.
Folding is more homogeneous in the nucleus than in the cytoplasm and ER
In vitro, only a small standard deviation of the relaxation rate (±0.2 s) and stability (±0.4°C) is observed, defining our measurement uncertainty. The spread of nuclear kinetics (Table 3) is not much larger. In contrast, the spread of τ among cells in the cytoplasm and ER is three times larger than in the nucleus (Table 3), which therefore is kinetically more homogeneous. The full set of folding traces for all cells is shown in Fig. S5 and Fig. S6). Protein stability also indicates that the most homogeneous environment is in the nucleus (Table 2; and see the Supporting Material for all thermodynamic traces recorded).
FRET-PGK∗-ER has a more two-state-like folding mechanism in vivo than in vitro
When unlabeled (24,25) or FRET-labeled (Table 3) PGK mutants are studied in vitro, they exhibit stretched kinetics (β = 0.3–0.6) (24,25,32), indicative of a hierarchical succession (33) of intermediates after the first few microseconds of folding. In the nucleus and cytoplasm, similar values of β (0.5–0.6 in Table 3) are also obtained, so folding intermediates persist in these compartments.
The ER-localized protein yields a β close to 1 (Table 3), consistent with a shift toward two-state kinetics in that compartment. The Supporting Material shows individual cell data and comparative fits with β = 0.91 vs. β = 0.56, the average value in the ER versus all other environments. For example, only one out of five cells yielded a β ≥ 0.75 in the nucleus, whereas all five cells with ER-localized folding reactions yielded β ≥ 0.75, and four had β ≥ 0.9. The only caveat is that with a 0.2 s dead time and 15 s observation window, the dynamic range for distinguishing stretched from single exponential is only 75:1.
Discussion
The three main in vivo results obtained here are:
-
1.
All native PGK∗ constructs have higher FRET efficiency in cellular compartments than in aqueous solution, consistent with a new compact native state previously proposed based on Ficoll crowding studies (22).
-
2.
The nucleus allows PGK to fold faster and form a more stable native state, with less variation from cell to cell than observed in the cytoplasm and ER.
-
3.
At least the ER is more conducive to two-state folding than is aqueous solution. These observations have several consequences and allow some interesting speculations.
For the native state of PGK∗, we observe the same small D/A in organelles as was previously observed in the macromolecular carbohydrate crowder Ficoll (22). D/A ranges from 5.8 to 6.6 in the nucleus, ER, cytoplasm, and 300 mg/ml Ficoll, vs. ∼11 in aqueous solution (22). This suggests that inside living cells, PGK adopts a native state similar to that observed in Ficoll. The unfolded state is also affected in vivo, with D/A values up to only ∼11 whereas in vitro, the D/A goes up to 15 (Fig. S2 b). This result could be due to a conformationally restricted PGK∗ unfolded state, or it could be due to conformational restriction of the fluorescent labels, or both.
Previous in vitro work has shown that crowding induces a structurally more compact native state of FRET-PGK∗ than suggested by the crystal structure of PGK. The experimental evidence is increased FRET efficiency (smaller D/A) coupled with much higher enzymatic activity as Ficoll is added to the aqueous solution (22). Two simulation results supported this assignment. First, simulations proposed a crowded structure in which the two parts of the active site widely separated in the crystal structure are squeezed together, explaining the higher enzymatic activity measured in Ficoll (22). In addition, simulations show that the N- and C-termini of PGK∗ are much closer together in the most compact state than in the crystal structure (Fig. 4D in Dhar et al. (22)); AcGFP1 and mCherry are bound to the N- and C-termini of PGK∗ by very short linkers (two residues), so one expects increased FRET efficiency (smaller D/A) in the most compact state.
Although we have not shown that compact structure in vivo also increases the catalytic rate in vivo, our result coupled with the behavior of PGK in Ficoll supports other interesting observations that the eukaryotic cell enhances the efficiency of glycolytic pathway enzymes compared to the test tube. For example, Verkman (34) showed that PGK diffuses much more slowly in the cytoplasm than do extraneous proteins of similar size such as GFP. Loose association to form clusters with other enzymes or organelles to speed up substrate processing by reducing diffusion distances is a possible explanation. Ovádi and Srere (35) discuss many examples, including the glycolytic pathway, where enzyme association accelerates substrate processing. Giegé et al. (36) show explicitly that glycolytic enzymes associate with mitochondria in plant cells. Cells use association of enzymes, and perhaps even structural modification of enzyme native states, to enhance metabolic efficiency.
Turning to our second in vivo result, Fig. 6 summarizes PGK stability and folding kinetics in the nucleus, ER, cytoplasm, and in vitro. The figure shows data for individual cells when both kinetics and thermodynamics were probed simultaneously, as well as ellipses indicating the spread of melting temperatures and folding relaxation times for all cells (including cells where either only thermodynamics or only kinetics were measured, but not both). Collection of similar data for very many cells, although impractical at the current time, could also allow the determination of correlation between Tm and τ (leading to tilted ellipses). The figure clearly shows that the various localization tags cause only a small spread of stability and kinetics in vitro, that the ER and cytoplasm result in very similar stability and average relaxation times, and that the nucleus occupies an entirely different region in the Tm-τ space.
Figure 6.
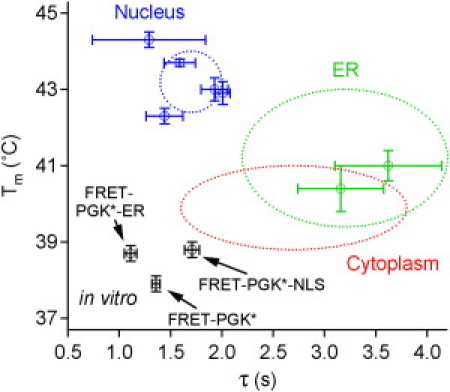
Plot of the melting temperature Tm versus relaxation time τ (at ∼Tm) for FRET-labeled PGK in various cellular organelles and in vitro. In vitro, different tagged PGKs have similar values of both Tm and τ. In vivo, the cytoplasm and the ER provide similar folding environments, whereas the nuclear environment stabilizes the protein and makes it fold faster relative to the cytoplasm and ER. The individual data points with 1 SD error bars are measurements of Tm and τ carried out for the same cell, while the dotted ellipses include additional cells for which only Tm or τ was measured. The widths of the ellipses are the spreads (from Tables 2 and 3) for the whole ensemble of cells measured.
On average, FRET-PGK∗-NLS is stabilized by 4.4°C in the nucleus over in vitro. Greater stabilization in the nucleoplasm relative to the cytoplasm (Fig. 4) is difficult to explain solely by excluded volume crowding effects. Based on diffusion measurements (20), crowding in the nucleus and crowding in the cytoplasm are similar on the <100-nm length scale relevant for protein folding. However, nuclear crowding and compartmentalization are mainly caused by histone-bound nucleic acids (21), a chemical environment very different from the cytoplasm. Although the nucleus is itself a complex compartmentalized environment (e.g., nucleoli), the chemical crowding environment provided by histone-bound nucleic acids could at once be more powerful and more uniform than the cytoplasmic environment. Indeed, our observations (Table 3) show that folding stability and kinetics of FRET-PGK∗-NLS vary less from cell to cell than they do for the corresponding ER or cytoplasmic proteins.
Although the difference between nucleus and cytoplasm may be difficult to explain by simple excluded volume crowding models, the correlation between increased nuclear stability and folding rate is entirely consistent with excluded volume crowding models. According to these models, the free energy of the unfolded state is raised by crowding (which reduces conformational entropy of the unfolded state), simultaneously lowering the activation barrier for folding and stabilizing the native state (7). The same correlation of faster folding near or below Tm and greater stability of the folded state is what we observe for the nuclear-localized protein. Our previous experiments on FRET-PGK∗ revealed that the smaller cytoplasmic relaxation rate is mainly due to a twofold increase of viscosity relative to aqueous solution (8). In contrast, the nuclear folding relaxation rate remains the same as in aqueous solution. In the nucleus there seems to be a compensatory effect: viscosity slows down folding both in the nucleus and in the cytoplasm, whereas the chemical and crowding environment speeds up folding more in the nucleus to make up for it.
The melting temperatures of all our mutants in the cell tend to lie between the in vitro value detected by FRET (average 38.5°C), and the highest in vitro value detected by CD (44.5°C; see Fig. S2 a). This observation could be a coincidence, but it suggests an interesting possibility for future investigation. FRET is sensitive to protein compactness, whereas CD is more sensitive to secondary structure: the upper limit on thermodynamic stabilization in cells may be given by the maximum stability attained by the secondary structure. It is well known that macromolecular crowding has a lesser effect on helical secondary structure (PGK has a mixed α/β structure) than on tertiary structure (11,37). If enhanced tertiary stability is the main effect of in-cell crowding, once a protein reaches the melting point of its secondary structure, crowding may cease to increase stability. Our results are consistent with this notion.
Finally we consider our third major observation, the difference between ER and in vitro folding mechanisms. All our kinetic data were fitted to the same stretched exponential model from Eq. 10. The in vitro, cytoplasmic, and nuclear proteins all fit to β-values averaging from 0.5 to 0.6 (Table 3), indicating hierarchical folding/unfolding kinetics through a series of intermediate stages (33). Similar stretched kinetics has also been observed for unlabeled PGK in previous in vitro studies (24,25) up to minute timescales. The ER resembles the cytoplasm in protein stability and folding relaxation time (Fig. 6), but FRET-PGK∗-ER is unique in vivo in that several cells consistently yield β = 0.91 ± 0.08, close to the value β = 1 expected for a simple two-state folder.
Although adding several single exponentials with positive amplitudes can mimic a stretched exponential function, adding several stretched exponentials with positive amplitudes never approximates a single exponential function. (The T-jump shifts the equilibrium of each protein in the same direction, so the sign of all amplitudes must be the same.) Thus one could easily explain how a two-state folder in vitro would appear stretched in the cell because our experiment averages over folding microenvironments with different rates. One cannot explain how a multistate folder in vitro would appear as a two-state folder in the heterogeneous environment of the cell. The conclusion is that the ER modulates the free energy of FRET-PGK∗-ER folding intermediates to make the process more two-state-like, thus altering the folding mechanism. Similar tuning of the protein free energy landscape by in vitro crowding of apoflavodoxin was recently reported (38). In light of the relatively smooth energy landscapes for folding predicted by theory and seen experimentally (i.e., low protein stability and fast folding reactions), a modulation of the free energy landscape inside the cell is quite plausible.
Our results provide input for future simulations of macromolecular crowding effects in cells. Past work has frequently modeled crowders as spheres of uniform size without chemical attributes. To quantitatively compare simulations with experiment, the chemical environment of crowders will have to be taken into account in addition to their size and geometry. The differences in PGK folding behavior across different cellular compartments will have to include interactions with cellular structures such as the ER membranes, or histones and negatively charged DNA. For example, the ER may have an effect on folding intermediates with exposed hydrophobic surface area when they interact with the ER membrane. Work in this direction has begun for bacterial cells (39,40), and coarse-grained simulations of parts of eukaryotic cells should also become feasible in the near future. Such models could capture the underlying spatial and temporal heterogeneity inherent in living cells and thus offer a systems-level view of how protein folding is altered by cells, either randomly, or as a result of evolution for post-post-translational control of protein structure, function, stability, and folding by the cell.
Acknowledgments
Author contributions: M.G. designed the research. A.D., K.G., D.S., H.G. and S.E. performed the research. A.D., H.G, S.E. and M.G. analyzed the data. A.D., S.E. and M.G. wrote the article.
This work was supported by National Science Foundation grant MCB-1019958. A.D., K.G., and S.E. were supported in part by the National Science Foundation Center for Physics of Living Cells. M.G. and S.E. gratefully acknowledge support from the von Humboldt Foundation.
Supporting Material
References
- 1.Kubelka J., Hofrichter J., Eaton W.A. The protein folding ‘speed limit’. Curr. Opin. Struct. Biol. 2004;14:76–88. doi: 10.1016/j.sbi.2004.01.013. [DOI] [PubMed] [Google Scholar]
- 2.Lange O.F., Lakomek N.A., de Groot B.L. Recognition dynamics up to microseconds revealed from an RDC-derived ubiquitin ensemble in solution. Science. 2008;320:1471–1475. doi: 10.1126/science.1157092. [DOI] [PubMed] [Google Scholar]
- 3.Henzler-Wildman K.A., Lei M., Kern D. A hierarchy of timescales in protein dynamics is linked to enzyme catalysis. Nature. 2007;450:913–916. doi: 10.1038/nature06407. [DOI] [PubMed] [Google Scholar]
- 4.Jäger M., Zhang Y., Kelly J.W. Structure-function-folding relationship in a WW domain. Proc. Natl. Acad. Sci. USA. 2006;103:10648–10653. doi: 10.1073/pnas.0600511103. [DOI] [PMC free article] [PubMed] [Google Scholar]
- 5.Bryngelson J.D., Onuchic J.N., Wolynes P.G. Funnels, pathways, and the energy landscape of protein folding: a synthesis. Proteins. 1995;21:167–195. doi: 10.1002/prot.340210302. [DOI] [PubMed] [Google Scholar]
- 6.Minton A.P. Influence of macromolecular crowding upon the stability and state of association of proteins: predictions and observations. J. Pharm. Sci. 2005;94:1668–1675. doi: 10.1002/jps.20417. [DOI] [PubMed] [Google Scholar]
- 7.Cheung M.S., Klimov D., Thirumalai D. Molecular crowding enhances native state stability and refolding rates of globular proteins. Proc. Natl. Acad. Sci. USA. 2005;102:4753–4758. doi: 10.1073/pnas.0409630102. [DOI] [PMC free article] [PubMed] [Google Scholar]
- 8.Dhar A., Ebbinghaus S., Gruebele M. The diffusion coefficient for PGK folding in eukaryotic cells. Biophys. J. 2010;99:L69–L71. doi: 10.1016/j.bpj.2010.08.066. [DOI] [PMC free article] [PubMed] [Google Scholar]
- 9.Ignatova Z., Krishnan B., Gierasch L.M. From the test tube to the cell: exploring the folding and aggregation of a β-clam protein. Biopolymers. 2007;88:157–163. doi: 10.1002/bip.20665. [DOI] [PMC free article] [PubMed] [Google Scholar]
- 10.Dedmon M.M., Patel C.N., Pielak G.J. FlgM gains structure in living cells. Proc. Natl. Acad. Sci. USA. 2002;99:12681–12684. doi: 10.1073/pnas.202331299. [DOI] [PMC free article] [PubMed] [Google Scholar]
- 11.Christiansen A., Wang Q., Wittung-Stafshede P. Factors defining effects of macromolecular crowding on protein stability: an in vitro/in silico case study using cytochrome c. Biochemistry. 2010;49:6519–6530. doi: 10.1021/bi100578x. [DOI] [PubMed] [Google Scholar]
- 12.Ebbinghaus S., Dhar A., Gruebele M. Protein folding stability and dynamics imaged in a living cell. Nat. Methods. 2010;7:319–323. doi: 10.1038/nmeth.1435. [DOI] [PubMed] [Google Scholar]
- 13.Ignatova Z., Gierasch L.M. Monitoring protein stability and aggregation in vivo by real-time fluorescent labeling. Proc. Natl. Acad. Sci. USA. 2004;101:523–528. doi: 10.1073/pnas.0304533101. [DOI] [PMC free article] [PubMed] [Google Scholar]
- 14.Schoen I., Krammer H., Braun D. Hybridization kinetics is different inside cells. Proc. Natl. Acad. Sci. USA. 2009;106:21649–21654. doi: 10.1073/pnas.0901313106. [DOI] [PMC free article] [PubMed] [Google Scholar]
- 15.Chattopadhyay S., Pal S., Das Gupta C. Protein folding in Escherichia coli: role of 23S ribosomal RNA. Biochim. Biophys. Acta. 1999;1429:293–298. doi: 10.1016/s0167-4838(98)00179-4. [DOI] [PubMed] [Google Scholar]
- 16.Ebbinghaus S., Gruebele M. Protein folding landscapes in the living cell. J. Phys. Chem. Lett. 2011;2:314–319. [Google Scholar]
- 17.Xia K., Manning M., Colón W. Identifying the subproteome of kinetically stable proteins via diagonal 2D SDS/PAGE. Proc. Natl. Acad. Sci. USA. 2007;104:17329–17334. doi: 10.1073/pnas.0705417104. [DOI] [PMC free article] [PubMed] [Google Scholar]
- 18.Thirumalai D., Lorimer G.H. Chaperonin-mediated protein folding. Annu. Rev. Biophys. Biomol. Struct. 2001;30:245–269. doi: 10.1146/annurev.biophys.30.1.245. [DOI] [PubMed] [Google Scholar]
- 19.Dhar A., Gruebele M. Fast relaxation imaging in living cells. Curr. Protoc. Protein Sci. 2011 doi: 10.1002/0471140864.ps2801s65. in press. [DOI] [PubMed] [Google Scholar]
- 20.Guigas G., Kalla C., Weiss M. The degree of macromolecular crowding in the cytoplasm and nucleoplasm of mammalian cells is conserved. FEBS Lett. 2007;581:5094–5098. doi: 10.1016/j.febslet.2007.09.054. [DOI] [PubMed] [Google Scholar]
- 21.Hancock R. Internal organization of the nucleus: assembly of compartments by macromolecular crowding and the nuclear matrix model. Biol. Cell. 2004;96:595–601. doi: 10.1016/j.biolcel.2004.05.003. [DOI] [PubMed] [Google Scholar]
- 22.Dhar A., Samiotakis A., Cheung M.S. Structure, function, and folding of phosphoglycerate kinase are strongly perturbed by macromolecular crowding. Proc. Natl. Acad. Sci. USA. 2010;107:17586–17591. doi: 10.1073/pnas.1006760107. [DOI] [PMC free article] [PubMed] [Google Scholar]
- 23.Lillo M.P., Szpikowska B.K., Beechem J.M. Real-time measurement of multiple intramolecular distances during protein folding reactions: a multisite stopped-flow fluorescence energy-transfer study of yeast phosphoglycerate kinase. Biochemistry. 1997;36:11273–11281. doi: 10.1021/bi970789z. [DOI] [PubMed] [Google Scholar]
- 24.Osváth S., Herényi L., Köhler G. Hierarchic finite level energy landscape model: to describe the refolding kinetics of phosphoglycerate kinase. J. Biol. Chem. 2006;281:24375–24380. doi: 10.1074/jbc.M601915200. [DOI] [PubMed] [Google Scholar]
- 25.Osváth S., Sabelko J.J., Gruebele M. Tuning the heterogeneous early folding dynamics of phosphoglycerate kinase. J. Mol. Biol. 2003;333:187–199. doi: 10.1016/j.jmb.2003.08.011. [DOI] [PubMed] [Google Scholar]
- 26.Kalderon D., Roberts B.L., Smith A.E. A short amino acid sequence able to specify nuclear location. Cell. 1984;39:499–509. doi: 10.1016/0092-8674(84)90457-4. [DOI] [PubMed] [Google Scholar]
- 27.Munro S., Pelham H.R.B. A C-terminal signal prevents secretion of luminal ER proteins. Cell. 1987;48:899–907. doi: 10.1016/0092-8674(87)90086-9. [DOI] [PubMed] [Google Scholar]
- 28.Fliegel L., Burns K., Michalak M. Molecular cloning of the high affinity calcium-binding protein (calreticulin) of skeletal muscle sarcoplasmic reticulum. J. Biol. Chem. 1989;264:21522–21528. [PubMed] [Google Scholar]
- 29.Clarke P.G.H. Developmental cell death: morphological diversity and multiple mechanisms. Anat. Embryol. (Berl.) 1990;181:195–213. doi: 10.1007/BF00174615. [DOI] [PubMed] [Google Scholar]
- 30.Robertson A.D., Murphy K.P. Protein structure and the energetics of protein stability. Chem. Rev. 1997;97:1251–1268. doi: 10.1021/cr960383c. [DOI] [PubMed] [Google Scholar]
- 31.Osváth S., Köhler G., Fidy J. Asymmetric effect of domain interactions on the kinetics of folding in yeast phosphoglycerate kinase. Protein Sci. 2005;14:1609–1616. doi: 10.1110/ps.051359905. [DOI] [PMC free article] [PubMed] [Google Scholar]
- 32.Sabelko J., Ervin J., Gruebele M. Observation of strange kinetics in protein folding. Proc. Natl. Acad. Sci. USA. 1999;96:6031–6036. doi: 10.1073/pnas.96.11.6031. [DOI] [PMC free article] [PubMed] [Google Scholar]
- 33.Metzler R., Klafter J., Jortner J. Hierarchies and logarithmic oscillations in the temporal relaxation patterns of proteins and other complex systems. Proc. Natl. Acad. Sci. USA. 1999;96:11085–11089. doi: 10.1073/pnas.96.20.11085. [DOI] [PMC free article] [PubMed] [Google Scholar]
- 34.Verkman A.S. Solute and macromolecule diffusion in cellular aqueous compartments. Trends Biochem. Sci. 2002;27:27–33. doi: 10.1016/s0968-0004(01)02003-5. [DOI] [PubMed] [Google Scholar]
- 35.Ovádi J., Srere P.A. Metabolic consequences of enzyme interactions. Cell Biochem. Funct. 1996;14:249–258. doi: 10.1002/cbf.699. [DOI] [PubMed] [Google Scholar]
- 36.Giegé P., Heazlewood J.L., Sweetlove L.J. Enzymes of glycolysis are functionally associated with the mitochondrion in Arabidopsis cells. Plant Cell. 2003;15:2140–2151. doi: 10.1105/tpc.012500. [DOI] [PMC free article] [PubMed] [Google Scholar]
- 37.Mukherjee S., Waegele M.M., Gai F. Effect of macromolecular crowding on protein folding dynamics at the secondary structure level. J. Mol. Biol. 2009;393:227–236. doi: 10.1016/j.jmb.2009.08.016. [DOI] [PMC free article] [PubMed] [Google Scholar]
- 38.Stagg L., Christiansen A., Wittung-Stafshede P. Macromolecular crowding tunes folding landscape of parallel α/β protein, apoflavodoxin. J. Am. Chem. Soc. 2011;133:646–648. doi: 10.1021/ja107638e. [DOI] [PubMed] [Google Scholar]
- 39.McGuffee S.R., Elcock A.H. Diffusion, crowding & protein stability in a dynamic molecular model of the bacterial cytoplasm. PLOS Comput. Biol. 2010;6:e1000694. doi: 10.1371/journal.pcbi.1000694. [DOI] [PMC free article] [PubMed] [Google Scholar]
- 40.Roberts E., Magis A., Luthey-Schulten Z. Noise contributions in an inducible genetic switch: a whole-cell simulation study. PLOS Comput. Biol. 2011;7:e1002010. doi: 10.1371/journal.pcbi.1002010. [DOI] [PMC free article] [PubMed] [Google Scholar]
Associated Data
This section collects any data citations, data availability statements, or supplementary materials included in this article.