Abstract
Participants in the 11th annual PhysioNet/CinC Challenge were asked to reconstruct, using any combination of available prior and concurrent information, 30-second segments of ECG, continuous blood pressure waveforms, respiration, and other signals that had been removed from recordings of patients in intensive care units.
Fifteen of the 53 participants provided reconstructions for the entire test set of 100 ten-minute recordings. The mean correlation between the segments that had been removed (the “target signals”) and the reconstructions produced using the two most successful methods is 0.9, and the sum of the squared residual errors in these reconstructions is less than 20% of the energy of the target signals.
Sources for the most successful methods developed for this challenge have been made available by their authors to support research on robust estimation of parameters derived from unreliable signals, detection of changes in patient state, and recognition of signal corruption.
1. Introduction
In settings ranging from sleep studies to surgery to sports medicine to intensive care, real-time monitoring of a variety of physiologic signals has become an essential tool for clinicians and researchers. Transient corruption or loss of one or more signals, common in all of these settings, can be disruptive, especially when continuous observations are required in order to rule out rare events or as a basis for forecasting. Signal corruption can be particularly challenging when it mimics features that are associated with pathologic states.
Humans can be remarkably adept at dealing with transient noise and signal loss in these settings. Filling in gaps, and making use of context to recognize and ignore noise, are processes that our sensory and cognitive abilities leave us well-equipped to do. Can algorithmic solutions that take account of the same data, in broader contexts and without fatigue, do as well?
The aim of the PhysioNet/CinC Challenge 2010 was to develop robust methods for filling in gaps in multiparameter physiologic data (including ECG signals, continuous blood pressure waveforms, and respiration). In a real-world monitoring application, these methods can be applied for many purposes, including:
robust estimation of parameters such as heart rate, mean arterial pressure, and respiration when the primary signals used to derive these parameters become unavailable or unreliable;
detection of changes in patient state, when the relationships between signals remain consistent even as individual signals change their behavior; and
recognition of intervals of signal corruption, when a signal becomes inconsistent not only with respect to its previous history but also with respect to its relationships with other signals.
In this Challenge, participants were asked to reconstruct, using any combination of available prior and concurrent information, segments of signals that have been removed from multiparameter recordings of patients in intensive care units (ICUs).
2. Methods
2.1. Challenge Data Sets
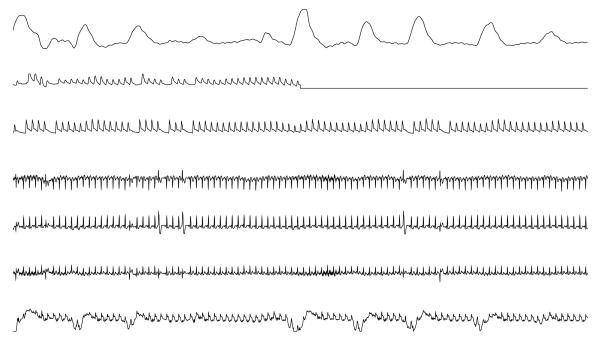
From previously unpublished ICU patient monitor recordings collected by the MIMIC II project [1], we prepared ten-minute records containing at least six simultaneous and continuous signals (digitized at 125 samples/second each). The signals vary across records, and they include ECG, continuous invasive blood pressure, respiration, raw fingertip plethysmogram outputs, and occasional other signals. We prepared one such record from each of 300 randomly chosen monitor recordings, selecting the ten-minute interval at random within each longer recording. In each ten-minute record, the final thirty seconds of one of the signals (also chosen at random, see table 1) was designated as the target signal, and it was replaced by a gap (a flat line signal) as shown in figure 1. The goal is to reconstruct this missing 30-second target signal in each record. The modified records were assigned randomly to one of three Challenge data sets of 100 records each:
Table 1.
Distribution of target signals in Set C records.
| Target signal to be reconstructed | Records |
|---|---|
| Arterial blood pressure | 19 |
| Central venous pressure | 11 |
| ECG | 40 |
| Fingertip plethysmograph (raw signal) | 14 |
| Intracranial pressure | 5 |
| Respiration | 11 |
Figure 1.
The final minute of a typical 10-minute record from the Challenge data set. From the top, the signals are respiration, raw fingertip plethysmograph output, arterial blood pressure, ECG leads II, “V” (an unspecified precordial lead), and aVR, and central venous pressure. The goal was to reconstruct the missing target signal (in this case, the fingertip plethysmograph output, which was replaced by a flat signal during the final 30 seconds).
Set A
Is a set of 100 records for participants' use as a training set. Participants were able to obtain scores for Set A reconstructions at any time, but Set A scores were not included in the final rankings of Challenge entries. The target signals were provided for the records in this set. Participants were able to construct additional training data from any of the multiparameter data available from PhysioNet [2], such as the MIMIC II Waveform Database.
Set B
Is a set of 100 records for which the target signals were withheld until the conclusion of the challenge. Participants were able to obtain scores for Set B reconstructions at any time, but (as for Set A) Set B scores were not included in the final rankings of Challenge entries.
Set C
Is a set of 100 records, with the target signals withheld. Participants were allowed to submit reconstructions of the target signals at any time, but they received only a single set of scores based on their final submissions, which determined the final rankings and the winners of the challenge.
The Challenge data sets were posted on PhysioNet and remain freely available to support further study [3].
2.2. Scoring for individual reconstructions
Each reconstruction was compared with the corresponding target (reference) signal and was scored using two different methods, one for each of the two Challenge events.
Event 1
The target signal, Vref (t), is subtracted from the reconstruction, Vrec (t) to obtain the residual signal, Vres (t):
| (1) |
Where t = t0, t0 + Δt, …, t0 + (n − 1)Δt.
The event 1 figure of merit, Q1, varies between 0 and 1 (where 1 represents a perfect reconstruction); it depends on the sum of the squares of the residuals, normalized by the energy (sample variance) of the target signal, Eref:
| (2) |
Where
| (3) |
If Σvres2 is 0, the reconstruction is perfect, and Q1 = 1 even if Eref is also 0.
Use of a figure of merit based on the residual signal reflects the importance in many cases of obtaining a good estimate of target signal levels (such as systolic, mean, and diastolic pressures in a continuous blood pressure signal).
Event 2
The quality Q2 of a reconstruction is defined as the correlation coefficient of Vref and Vrec, or 0, whichever is larger. (Correlation coefficients can of course be negative; for the purposes of this challenge, an anticorrelated reconstruction is equivalent to an uncorrelated one, however.)
Use of the correlation coefficient as a figure of merit is motivated by the observation that reconstruction of a filtered signal may be useful in many cases. Such a reconstruction might, for example, provide a basis for reliable estimation of the timing of major fluctuations in a signal (such as QRS complexes in an ECG signal), even if absolute signal levels are not recovered. Unlike Q1, Q2 is relatively insensitive to misestimation of the amplitudes of fluctuations.
2.3. Aggregate (summed) scores
The final ranking of participants is based on summing the Q scores obtained for records in Set C. Participants were encouraged, but not required, to provide reconstructions of all records in Set C.
Both Q1 and Q2 are defined so they can vary between 0 and 1, and higher values are better. Participants who did not submit a reconstruction for a given record received zero scores for that record.
For event 1, each participant's Set C summed score, C1, is the sum of the Q1 scores for each record in Set C. Similarly, for event 2, the Set C summed score, C2, is the sum of the individual Q2 scores. Since Set C contains 100 records, C1 and C2 can vary between 0 and 100.
The summed scores were not normalized by the number of target signals reconstructed, to provide a strong incentive to submit reconstructions of as many of the Set C records as possible.
2.4. Training
Participants were given scores for any number of reconstructions of the records in sets A and B, so an iterative process of improving these scores was possible. They were also provided access to the code of the scoring algorithm [4] so that it was possible to use additional data from PhysioNet or any other source for development and training of their methods. Such training may have been beneficial if it resulted in improving the performance of a reconstruction algorithm on unknown data. Since the only scores reported for set C were for the final reconstruction of each target signal, iterative refinement (“tuning”) was not possible using the data on which the final rankings were based.
3. Results
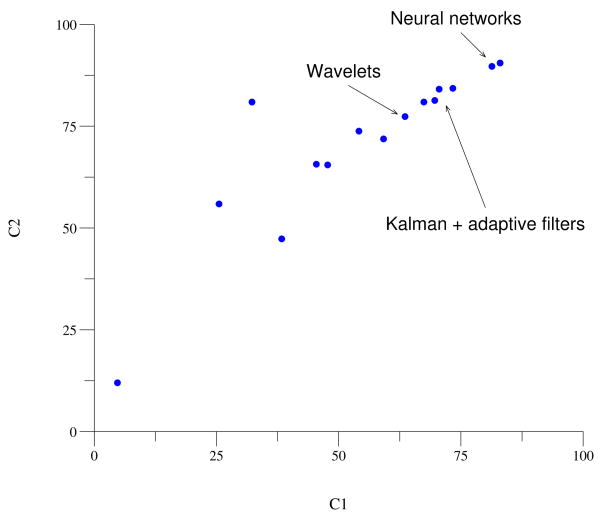
Fifteen participant-teams submitted reconstructions for all 100 records in set C. Their final scores are illustrated in figure 2, and the top scores are summarized in table 2.
Figure 2.
Results for set C. Each participant who submitted a complete set of reconstructions is represented by a point on this plot. Points nearest to the upper right corner represent the most successful reconstructions of the target signals, on average. The primary methods used by the top participants are indicated on the figure.
Table 2.
Top results for Challenge 2010.
| C1 | C2 | Entrant |
|---|---|---|
| 83.00 | 90.51 | Rui Rodrigues |
| Universidade Nova de Lisboa, Portugal | ||
| 81.33 | 89.67 | Adam Sullivan, Henian Xia, |
| Joseph McBride, Xiaopeng Zhao | ||
| University of Tennessee, Knoxville, USA | ||
| 73.35 | 84.30 | Mohamed Mneimneh, Sahar Elturk |
| Marquette University, USA | ||
| 70.55 | 84.09 | Ikaro Silva |
| MIT, USA | ||
| 69.66 | 81.32 | András Hartmann |
| Semmelweis University, Hungary | ||
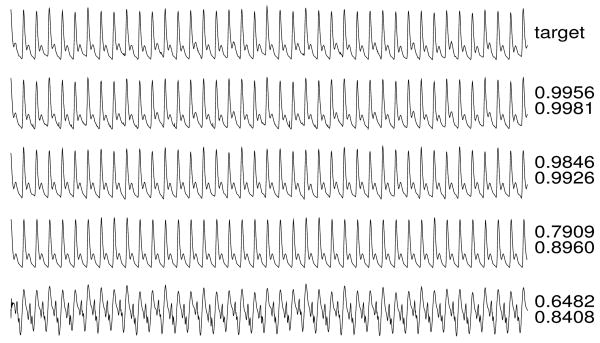
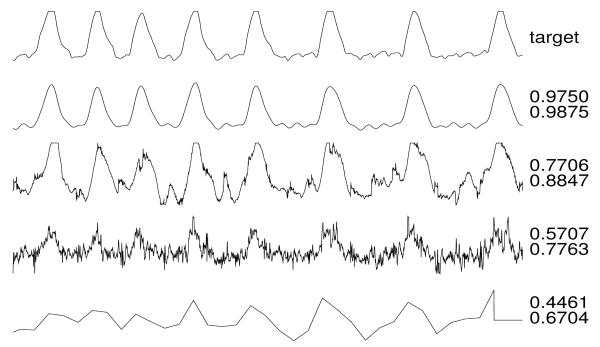
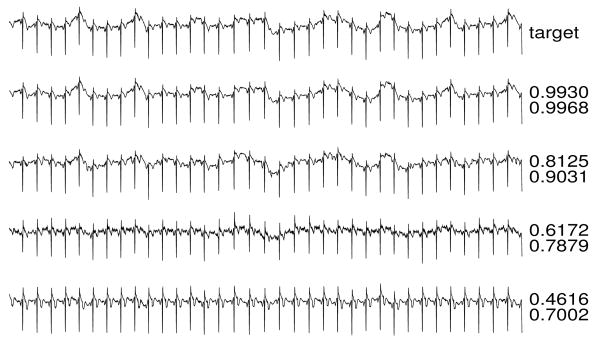
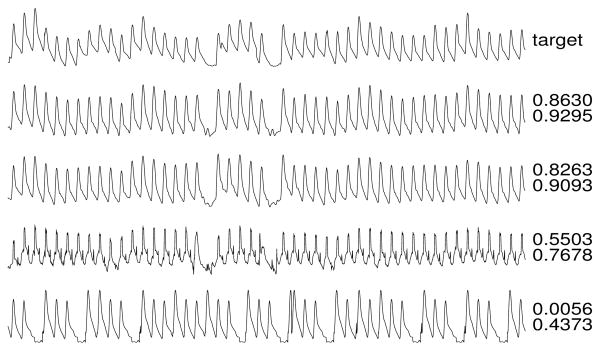
Figures 3-6 illustrate reconstructions of target arterial blood pressure, ECG, fingertip plethysmograph (“PLETH”), and respiration signals from set C. To the right of each reconstruction, the Q1 and Q2 scores are shown.
Figure 3.
ABP target and reconstructions.
Figure 6.
Respiration target and reconstructions.
4. Discussion and conclusions
The two most successful approaches [5, 6], based on neural networks, performed almost equally well, achieving C2 scores near 90 (corresponding to a mean correlation between the target and reconstructed set C signals of about 0.9). The three next most successful entries relied on Kalman filtering [7], adaptive filtering [8], or both [9]; these also had similar levels of performance, with mean correlations of 0.81 to 0.84. Although this group's performance was surpassed by the best neural network methods, the reconstructions were nevertheless of excellent quality, and the generally more efficient training possible using the methods of this group may be advantageous in future online applications. Other approaches included signal averaging [10], hidden Markov models [11], and principal component analysis [12], achieving generally good results; the most promising alternative approach relies on wavelet decomposition [13].
Figure 4.
ECG target and reconstructions.
Figure 5.
PLETH target and reconstructions.
Acknowledgments
Thanks to Ikaro Silva for valuable discussions on the scoring algorithms, and to Benjamin Moody for providing unpublished data from the MIMIC II project for this Challenge. The awards for this year's Challenge were provided by a generous gift from the family of Solange Akselrod in her memory, and by Computing in Cardiology.
The MIMIC II project is a Bioengineering Research Partnership funded by the US National Institutes of Health (NIH) and its National Institute of Biomedical Imaging and Bioengineering (NIBIB) under grant 2R01 EB001659, with additional support from Philips Medical Systems. PhysioNet is funded by NIBIB and by the National Institute of General Medical Sciences (NIGMS) under NIH cooperative agreement U01-EB-008577.
References
- 1.Saeed M, Lieu C, Raber G, Mark RG. MIMIC II: A massive temporal ICU patient database to support research in intelligent patient monitoring. Computers in Cardiology. 2002;29:641–644. [PubMed] [Google Scholar]
- 2.Goldberger AL, Amaral LAN, Glass L, Hausdorff JM, Ivanov PC, Mark RG, Mietus JE, Moody GB, Peng CK, Stanley HE. PhysioBank, PhysioToolkit, and PhysioNet: Components of a new research resource for complex physiologic signals. Circulation. 2000 June 13;101(23):e215–e220. doi: 10.1161/01.cir.101.23.e215. Circulation Electronic Pages: http://circ.ahajournals.org/cgi/content/full/101/23/e215. [DOI] [PubMed]
- 3.Mind the Gap. http://physionet.org/challenge/2010/
- 4.http://physionet.org/challenge/2010/c2010-score.c
- 5.Rodrigues R. Filling in the gap: a general method using neural networks. Computing in Cardiology. 2010;37 [Google Scholar]
- 6.Sullivan A, Xia H, McBride J, Zhao X. Reconstruction of missing physiological signals using artificial neural networks. Computing in Cardiology. 2010;37 [Google Scholar]
- 7.Mneimneh MA, Elturk S. A sensorless Kalman estimator toward the reconstruction of physiologic data. Computing in Cardiology. 2010;37 [Google Scholar]
- 8.Hartmann A. Reconstruction of missing cardiovascular signals using adaptive filtering. Computing in Cardiology. 2010;37 [Google Scholar]
- 9.Silva I. PhysioNet 2010 challenge: A robust multi-channel adaptive filtering approach to the estimation of physiological recordings. Computing in Cardiology. 2010;37 [PMC free article] [PubMed] [Google Scholar]
- 10.Langley P, King S, Wang K, Zheng D, Giovannini R, Bojarnejad M, Murray A. Estimation of missing data in multichannel physiological time-series by reference timing channel and average substitution. Computing in Cardiology. 2010;37 [Google Scholar]
- 11.Li Y, Sun Y, Zhai C, Sha L. HMMFIT: Using hidden Markov models to reconstruct missing signals in multi-parameter physiologic data. Computing in Cardiology. 2010;37 [Google Scholar]
- 12.Petrolis R, Simoliuniene R, Krisciukaitis A. Principal component analysis-based method for reconstruction of fragments of corrupted or lost signal in multilead data reflecting electrical heart activity and hemodynamics. Computing in Cardiology. 2010;37 [Google Scholar]
- 13.Wu W. Multi-parameter physiologic signal reconstruction by means of wavelet singularity detection and signal correlation. Computing in Cardiology. 2010;37 [Google Scholar]


