Abstract
This study describes the use of a stable-isotope labeled precursor ([U-13C]palmitate) to analyze de novo sphingolipid biosynthesis by tandem mass spectrometry. It also describes factors to consider in interpreting the data, including the isotope's location (13C appears in three isotopomers and isotopologues: [M + 16] for the sphingoid base or N-acyl fatty acid, and [M + 32] for both); the isotopic enrichment of palmitoyl-CoA; and its elongation, desaturation, and incorporation into N-acyl-sphingolipids. For HEK293 cells incubated with 0.1 mM [U-13C]palmitic acid, ∼60% of the total palmitoyl-CoA was 13C-labeled by 3 h (which was near isotopic equilibrium); with this correction, the rates of de novo biosynthesis of C16:0-ceramide, C16:0-monohexosylceramide, and C16:0-sphingomyelins were 62 ± 3, 13 ± 2, and 60 ± 11 pmol/h per mg protein, respectively, which are consistent with an estimated rate of appearance of C16:0-ceramide using exponential growth modeling (119 ± 11 pmol/h per mg protein). Including estimates for the very long-chain fatty acyl-CoAs, the overall rate of sphingolipid biosynthesis can be estimated to be at least ∼1.6-fold higher. Thus, consideration of these factors gives a more accurate picture of de novo sphingolipid biosynthesis than has been possible to-date, while acknowledging that there are inherent limitations to such approximations.
Keywords: metabolomics, lipidomics, sphingolipidomics, stable isotope labeling, fatty acyl-CoAs, isotopomers, isotopologues
Sphingolipids (SP) are a complex family of compounds (1) that shares the structural feature of having a sphingoid base backbone, which varies somewhat in structure but is most often sphingosine for mammalian SP (2). Interest in SP metabolism has grown as the genes for enzymes of this pathway have been identified and the metabolites, including intermediates such as ceramides (Cer), have been found to have vital biological functions and important roles in disease (1). SP can be analyzed by a wide variety of methods (3), and all of the early metabolites (summarized in Fig. 1) can be quantitated by liquid chromatography-electrospray-ionization tandem mass spectrometry (LC-ESI-MS/MS) using commercially available internal standards (4).
Fig. 1.
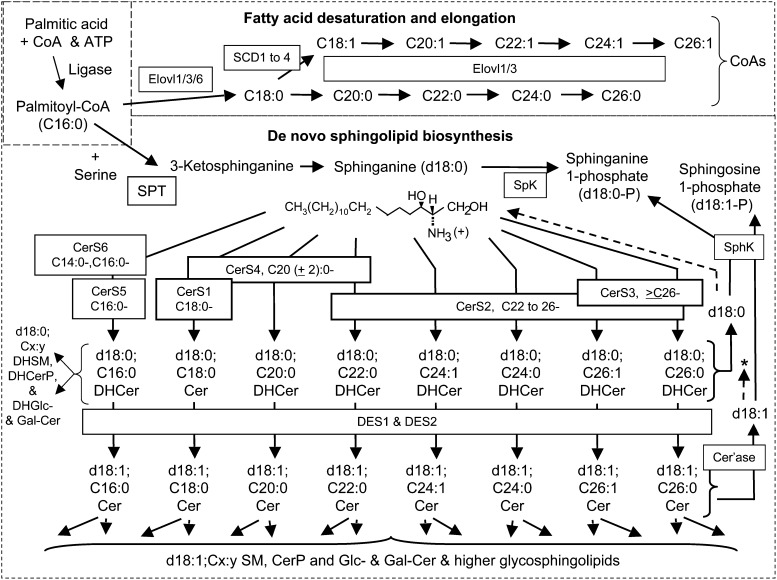
Summary of de novo sphingolipid biosynthesis in HEK293 cells with an emphasis on steps where 13C-labeling from [U-13C]palmitate appears. The pathway begins with the activation of palmitate (C16:0) to palmitoyl-CoA, which is condensed with serine via serine palmitoyltransferase (SPT) to produce 3-ketosphinganine, which is reduced to sphinganine (d18:0) (11, 46). Sphinganine is acylated to dihydroceramides (DHCer) by Cer synthases (CerS) (6, 47–50) utilizing fatty acyl-CoAs (the upper panel shows how fatty acyl-CoAs are elongated by ELOVL1/3/6 and/or desaturated by SCD1 to 4, beginning with palmitoyl-CoA). DHCer is oxidized (or hydroxylated, not shown) by desaturases (DES1 or 2) to ceramides (Cer), with a sphingosine (d18:1) backbone. Cer and, to a minor extent, DHCer are converted to sphingomyelins (SM) and monohexosyl Cer (glucosylceramide, GlcCer, and small amounts of galactosylceramide, GalCer, for HEK293 cells). Also shown is the turnover of DHCer and Cer by ceramidases, which can produce d18:1 and d18:0 that can be recycled (indicated by the dashed lines and asterisk) or phosphorylated by sphingosine kinases (SphK, 44), followed by catabolism via sphingosine phosphate lyase (SPL, 45). The short-hand nomenclature shown in this figure (2) designates the sphingoid base by the number of hydroxyl moieties (d for dihydroxy), the number of carbon atoms (18 being the major chain length for most mammalian SL), and the number of double bonds (1); likewise, the N-acyl-chain is designated by the number of carbon atoms and double bonds.
In applying MS to metabolic studies, stable-isotope-labeled precursors are typically used to provide information about changes in the amounts of the molecular species of interest (5). Stable-isotope-labeled palmitate is particularly useful because SP biosynthesis begins with condensation of palmitoyl-CoA and serine to form the sphingoid base backbone (Fig. 1), and palmitoyl-CoA and other fatty acyl-CoAs are also used by Cer synthases (CerS) to add the second chain (1, 6). Stable isotope labeling of SPs has been described previously (7–9) using gas chromatography-electron impact-mass spectrometry (GC-EIMS) to monitor the individual sphingoid base and palmitate moieties in different categories of SP, but this approach does not provide information about intact molecular species due to their fragmentation.
This article describes the types of results that are obtained upon utilization of LC-ESI-MS/MS to analyze the incorporation of [U-13C]palmitate into SP by HEK293 cells, it and describes factors that should be considered in such studies, such as the position of the 13C and the isotopic enrichment of the precursor [13C]labeled palmitoyl-CoA, which can also be determined by LC-ESI-MS/MS (10).
EXPERIMENTAL PROCEDURES
Additional details about materials and methods are provided in the supplementary data.
Reagents
The internal standard cocktail for sphingolipid analysis (catalog number LM-6002) and the fatty acyl-CoA standards (pentadecanoyl-, heptadecanoyl-, tricosanoyl-, and pentacosanoyl-CoAs) were from Avanti Polar Lipids (Alabaster, AL) as described previously for the analysis of these lipids (4, 10). The [U-13C]palmitate (98%) was purchased from Cambridge Isotope Laboratories (Andover, MA); fatty-acid-depleted BSA was from Calbiochem (EMD, Darmstadt, Germany); and phospholipase D (PLaseD) from Streptomyces chromofuscus was purchased from Biomol (Plymouth Meeting, PA) and had a specific activity of 50 kU/ml.
Cell culture
HEK293 cells (catalog #CRL-1573) were obtained from the ATCC® (Manassas, VA) and grown in 100 mm tissue culture dishes as described previously (11). After the indicated treatments, the medium was removed, and the cells were washed and scraped from the dishes for extraction of the SP (4) or fatty acyl-CoAs (10) as described previously. For the 13C-labeling experiments, cells at ∼80% confluence were changed to new medium the evening before the experiment, then at time zero for labeling, 0.5 ml of medium was replaced with 2 mM [U-13C]palmitate in a 1:1 molar complex with fatty acid-free BSA in PBS, for a final concentration of 0.1 mM [U-13C]palmitate. The 1:1 molar complex with fatty acid-free BSA in PBS was prepared as previously described (12).
LC-ESI-MS/MS
LC-ESI-MS/MS analyses of the SP (4) and fatty acyl-CoAs (10) were performed as described previously. In each case, the lipid extracts were examined by precursor-product scans followed by LC-ESI-MS/MS with multiple reaction monitoring (MRM) to select the subspecies that were sufficiently prevalent to include in the final MRM analysis protocol. In the case of the monohexosylceramides (MHC), this required additional analysis under LC conditions that resolve GlcCer and GalCer (4); however, this analysis revealed that HEK293 cells have such small quantities of GalCer (as well as insignificant amounts of labeled free sphingoid bases, Cer-1-P, many of the dihydroSPs, and complex SP with >1 saccharide) that our analysis could focus on Cer, SM, and GlcCer, which accounted for >95% of the 13C-label incorporated into SP. The N-acyl chain lengths 16:0, 18:0, 20:0, 22:0, 24:1, 24:0, 26:1, and 26:0 constituted ≥98% of the Cer of HEK293 cells.
The MRM precursor-product ion pairs and fraction of total quantity (r) that were used for these SP are summarized in supplementary Table I (Cer), Table II (monohexosylceramides), Table III (SM), and Table IV (Cer-1-P). The fraction of total quantity (r) was used to calculate the total amount of a compound from the counts per second (cps) observed with a single MRM pair by taking into account the fraction of the total compound that was represented by that exact mass. This fraction differed based on the number of natural abundance 13C atoms in the compound (which, in turn, was related to the total number of carbons). The fraction was calculated using an isotopic abundance calculator (e.g., http://winter.group.shef.ac.uk/chemputer/isotopes.html) regardless whether one or both of the acyl moieties were enriched with 13C (i.e., 16 or 32 13C from stable isotope-labeled palmitates). This correction factor is given in supplementary Tables I–IV as the MRM observed isotopic abundance relative to the sum of all isotopic species. Using this value for “r,” each SP was quantified by comparing its ion abundance to that for an appropriately selected internal standard (see Ref. 4 for how standards were selected and validated for SP) using the formula: pmol of analyte = [(cps of analyte)corr × (1 / r of analyte)] × {pmol of internal standard / [(cps of internal standard)corr × (1 / r of internal standard)]}. The subscript “corr” signifies that the measured cps for the analyte and internal standard have already been corrected for any differences in ion yield for equivalent pmol of the compounds (this adjustment was made from standard curves and, in our experience, is relatively small for these SP versus the internal standards under optimized MRM conditions, but this depends on the instrument and conditions employed) (4). The data from these analyses are given in this article as pmol analyte/mg protein, with a depiction of the relative proportions of the four isotopologues and isotopomers as pie graphs in supplementary Fig. I.
The fatty acyl-CoAs were quantified similarly using odd-chain-length internal standards, as described recently (10).
Calculation of the isotopic enrichment
The isotopic enrichment of fatty acyl-CoAs was calculated as:
The isotopic enrichment of N-acyl SPs was calculated as:
Analysis of backbone labeling of SM by LC-ESI-MS/MS after phospholipase D treatment
SM fragmentation gave loss of headgroup but not backbone fragmentation; thus, it did not reveal the location of the 13C. Therefore, this was determined by enzymatic cleavage of the SM to Cer-1-P, which follows the more informative fragmentation shown in Fig. 2 (4). For this analysis, an aliquot (10–50%) of the SP extract was added to a 13 × 100 mm borosilicate glass test tube, the solvents were removed under vacuum, and then 0.1 ml of 3 mM decylglucopyranoside (Sigma, St. Louis, MO) was added. The lipids and detergent were dispersed by brief vortexing and sonication for ∼30 s in a Branson B-12 bath-type sonicator (Emerson Industrial Automation, Danbury, CT), and then 500 units of PLaseD (from a stock of 10,000 units/ml in 3 mM decylglucopyranoside and 0.1 M Tris HCl, pH 8.0) were added. After this mixture was incubated with shaking for 15 min at 37°C (which cleaved all of the SM), the sample was dried under vacuum and reconstituted in mobile phase for analysis of Cer-1-P by LC-ESI-MS/MS (4). This method was validated as described in the supplementary text and Fig. II. These analyses revealed that there was ∼8-fold greater 13C-labeling of the fatty acid moiety compared with the sphingoid base moiety in the singly labeled SM in HEK293 cells, providing a correction factor for [M + 16] SM quantities.
Fig. 2.
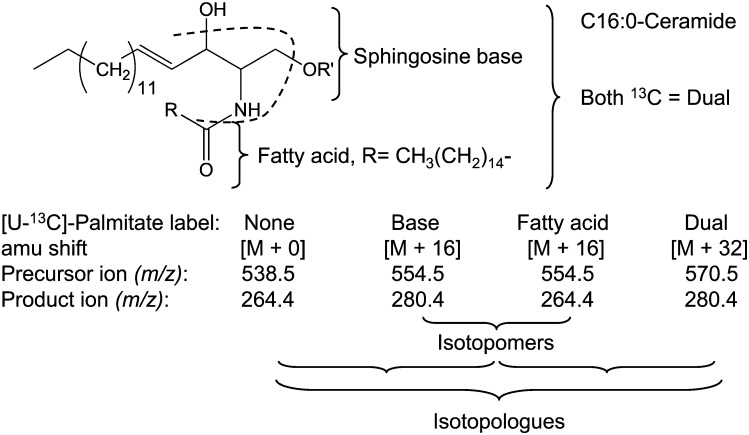
Nomenclature of C16:0-ceramide isotopologues and isotopomers with sites of fragmentation of most sphingolipids in positive ion mode using an API3000 triple quadrupole mass spectrometer. Also shown are the m/z for the precursor and product ions for C16-Cer with no 13C (None), [U-13C]palmitate in the sphingoid base alone (Base), [U-13C]palmitate in the N-acyl chain alone (Fatty acid), or [U-13C]palmitate in both the sphingoid base and fatty acid (Dual).
Statistics
The lipid quantities were normalized to protein as determined by the Pierce BCA assay kit (catalog #23225, Thermo Fisher Scientific, Rockford, IL) (for reference, 1 mg protein corresponds to 1.7 × 10⁶ HEK293 cells). The data for Cer, MHC, and SM are means ± SEM (n = 4) and for fatty acyl-CoAs, means ± range (n = 2).
RESULTS AND DISCUSSION
As summarized in Fig. 1, [U-13C]palmitate is incorporated into [U-13C]palmitoyl-CoA and utilized for de novo SP biosynthesis at two steps: 1) by serine palmitoyltransferase (SPT) to make the sphingoid base backbone, and 2) addition of an N-acyl-fatty acid by ceramide synthases (CerS), of which CerS5 and 6 incorporate [U-13C]palmitate per se and the others incorporate longer chain fatty acids which could be made by elongation and desaturation, of [U-13C]palmitoyl-CoA. Therefore, from a metabolic perspective, there are four distinct forms for each chain-length subspecies as shown in Fig. 2: one that is not derived from [U-13C]palmitate (referred to as “unlabeled”); two that have been made by utilization of [U-13C]palmitate by SPT, in one case also with [U-13C]palmitate as the amide-linked fatty acid (referred to as “dual-labeled”); and one where the compound is only labeled by [U-13C]palmitate in the sphingoid base (referred to as “base-labeled”); and one without [U-13C]palmitate in the sphingoid base but with [U-13C]palmitate in the amide-linked fatty acid (referred to as “fatty acid-labeled”). This latter species might be presumed to arise from reacylation of preexisting sphingoid bases that arise from complex SP turnover (as indicated on the right side of Fig. 1 in the dashed lines from d18:0 and d18:1), but this would overestimate this route if the cells continue to produce 12C-base-labeled SP due to incomplete labeling of the 13C/12C-fatty acyl-CoA pool, as will be described later.
As shown in Fig. 2, these forms can be distinguished by mass spectrometry based on the m/z of the precursor and product ions (with the exception of SM, as discussed later) (4). The convention is for molecules with the same chemical structure but different isotopes at specific structural position(s) to be referred to as “isotopologues” and for compounds with the same chemical structures and the same isotopes, but at different structural position(s), to be referred to as “isotopomers.” Hence, by this convention, the subcategories base- versus fatty acid-labeled Cer are isotopomers, whereas there are three subcategories of isotopologues: unlabeled, the combined isotopomer pair (base and fatty acid) and dual (Fig. 2).
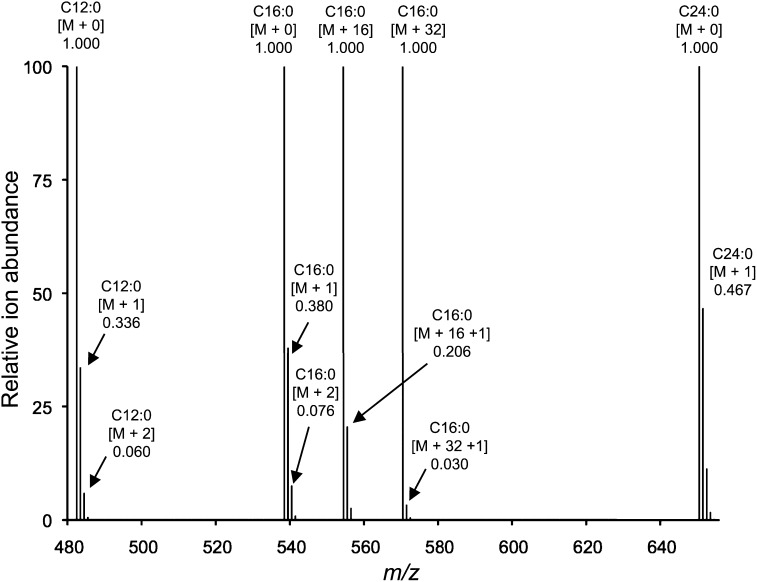
One of the factors to consider in using these relationships to quantify unlabeled, base, fatty acid, and dual Cer by LC-ESI-MS/MS using MRM is that the abundance of a single precursor-product ion pair (such as the molecules with only 12C, depicted as [M + 0] in Fig. 3) does not include the molecules composed of natural abundance 13C. For compounds that have a large number of carbon atoms, these are a substantial proportion of the total metabolite (and changes as the number of carbons increases), as illustrated by the [M +1] and [M +2] ions for several different Cer in Fig. 3. This correction of the measured ion abundance of a given MRM precursor-product pair can be made using an isotopic abundance calculator as described in Experimental Procedures; however; the correction factors also change when one or both of the alkyl chains is derived from [U-13C]palmitate, as seen by the comparison of the relative abundance of [M + 16 + 1] versus [M + 16] (0.206) and [M + 1] versus [M + 0] (0.380) for C16:0-Cer (Fig. 3). This requires additional correction factors, which were calculated for the major chain-lengths of mammalian SP and are presented in supplementary Tables I–IV.
Fig. 3.
Calculated ion abundance of ceramide based upon natural isotope abundance and labeling with [U-13C]palmitate. The Cx:y abbreviation denotes the length (x) and number of double bonds (y) in the ceramide N-acyl chain, [M + 0] denotes the monoisotopic ion for each chain length, [M + n] denotes the mass shift in amu (n) resulting from isotope atoms in the precursor ions, and the decimal number denotes the relative ion abundance.
Incorporation of [U-13C]palmitate into the ceramide of HEK293 cells
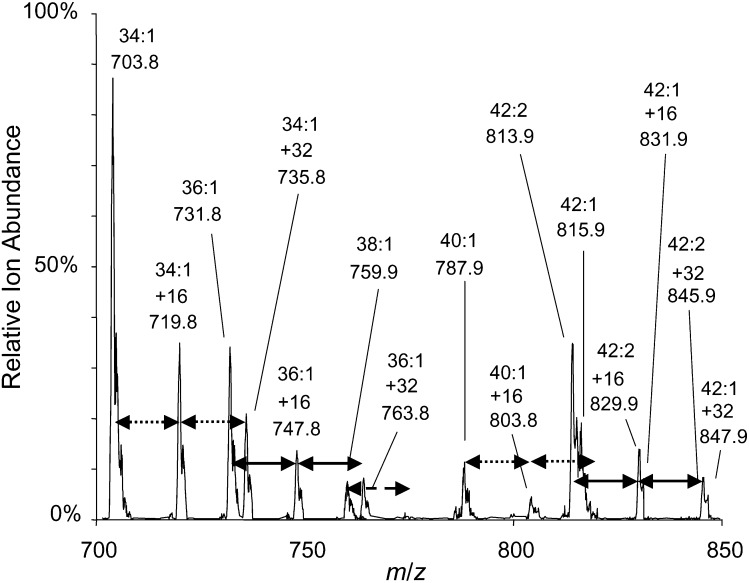
To exemplify the types of results that are obtained from analysis of SP biosynthesis using [U-13C]palmitate, HEK293 cells were incubated with [U-13C]palmitate for 0-6 h, and the SP were analyzed by LC-ESI-MS/MS. Before calculating the amounts of each subspecies using the MRM pairs (supplementary Tables I–III) as described in Experimental Procedures, another potentially complicating factor should be considered. It has been assumed that within the timeframe of the experiment, [U-13C]palmitate does not undergo chain shortening followed by resynthesis; e.g., β-oxidation of [U-13C]palmitate to myristic acid, 13C14-C14:0, followed by resynthesis of palmitate using unlabeled 12C, which would produce SP with shifts in m/z in units other than 16 and 32. To explore this possibility, a precursor ion scan for the Cer backbones of SM was conducted with the lipid extract from HEK293 cells incubated with [U-13C]palmitate for 3 h (Fig. 4). The [M + 16] and [M + 32] ions are clearly seen relative to the [M + 0] counterparts (and account for ≥98% of the labeled SM), with only trace amounts of ions that might reflect other isotopic combinations. Likewise, analysis of the very long-chain SM, which has fatty acids made by elongation of [U-13C]palmitate, had ions only at m/z M + 0, 16, and 32. Third, analysis of the fatty acyl-CoAs by LC-ESI-MS/MS as described under Experimental Procedures did not detect [M + 14] C16:0-CoA (data not shown). Therefore, for these cells under these conditions, it is valid to use the MRM pairs listed in supplementary Tables I–III to calculate the amounts of the four isotopologues and isotopomers of Cer over this time course as described under Experimental Procedures). The results are shown in Figs. 5 and 6.
Fig. 4.
Positive mode precursor ion scan (m/z 184.4) of sphingomyelin from HEK293 cells (∼1 × 10⁶ cells) incubated with 0.1 mM [U-13C]palmitate for 3 h. The x:y abbreviation denotes the total number of carbon atoms (x) and double bonds (y). Incorporation of one (+16 amu) or two (+32 amu) molecules of 0.1 mM [U-13C]palmitate into a particular x:y sphingomyelin are indicated by a pair of arrows, which are dotted, solid, or dashed.
Fig. 5.
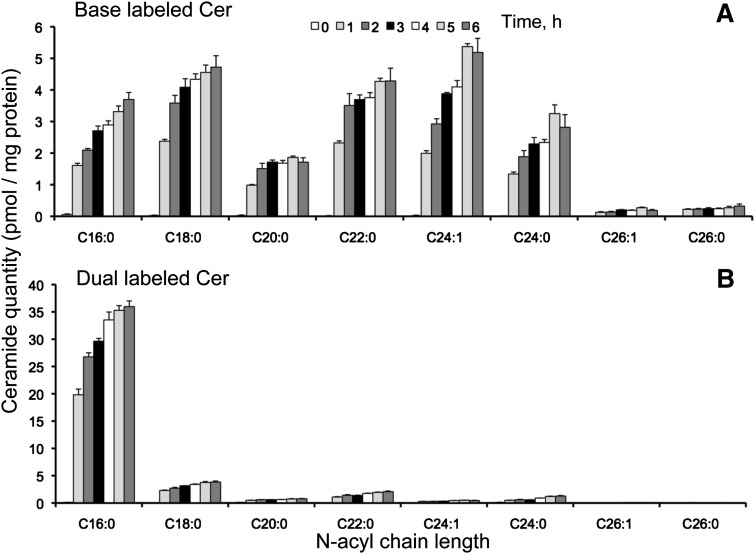
Base-labeled (A) and dual-labeled (B) ceramide from HEK293 cells incubated with 0.1 mM [U-13C]palmitate for 0-6 h. Results are the mean ± SEM (n = 4).
Fig. 6.
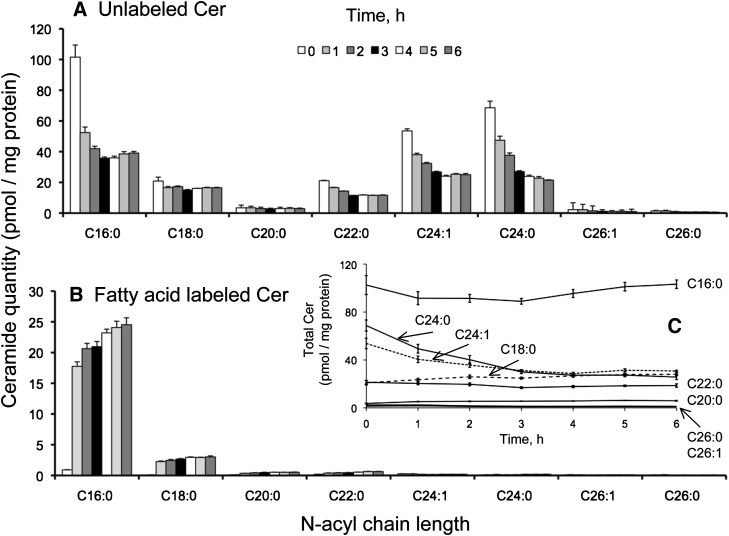
Unlabeled (A) and fatty acid-labeled (B) ceramide from HEK293 cells incubated with 0.1 mM [U-13C]palmitate for 0-6 h. Graph C shows the sum of all the forms of labeled and unlabeled Cer over this time course. Results are the mean ± SEM (n = 4).
The base- and dual-labeled isotopomers (Fig. 5A, B) have 13C in the sphingoid base moiety and, therefore, have been unambiguously made via de novo biosynthesis. The total amounts of the base and dual Cer were ∼22 and ∼50 pmol/mg protein, respectively, after 6 h incubation of the cells with [U-13C]palmitate. As might have been predicted, the base-labeled Cer were composed of multiple N-acyl chain lengths (16:0, 18:0, 22:0, 24:1, and 24:0), whereas the dual-labeled Cer was composed mainly of C16:0 because dual labeling of longer chains requires that 13C-palmitate undergo elongation (and in some cases desaturation).
The amounts of unlabeled Cer (i.e., with 13C in neither the sphingoid base nor fatty acid) (Fig. 6A) decreased substantially within the first hour for all of the N-acyl-chain length isotopologues, with the possible exception of C18:0 and C20:0, and the subspecies decreased from ∼250 to ∼110 pmol/mg protein between 0 and 6 h. By 6 h, the Cer isotopomers 13C-labeled in the N-acyl chain (i.e., with 12C-sphingosine and 13C-fatty acid) increased to ∼28 pmol/mg protein (Fig. 6B) and were composed mainly of the C16:0 chain length, with progressively smaller amounts of C18:0, C20:0, C22:0, etc., in a manner similar to that for the dual-labeled isotopomer (see Fig. 5B). From the sum of dual- and fatty acid-labeled Cer with chain-lengths ≥18 carbons (Figs. 5B and 6B), >10 pmol of 13C-palmitoyl-CoA was elongated into 13C-stearoyl-CoA and utilized [presumably by the C18-specific CerS1 (13)] within this timeframe.
Although the chain-length distributions of the Cer isotopologues and isotopomers differed considerably and shifted over the 6 h time course (see Figs. 5 and 6 and supplementary Fig. I), the total amounts of most of the Cer subspecies (i.e., the sum of all four isotopologues and isotopomers with a particular N-acyl chain length) remained remarkably constant over the 6 h of study (Fig. 6C). Indeed, only the C24 chain length Cer decreased, perhaps indicating that, at least under the conditions of this experiment, the last step of elongation (C22→C24) is relatively slow. With this exception, the fairly constant level of Cer suggests that the cells have a mechanism to maintain some degree of Cer homeostasis despite substantial rates of turnover (as reflected in the decrease in unlabeled Cer from 250 ± 70 to 110 ± 20 pmol/mg protein between 0 and 6 h, calculated from the sums of all Cer chain lengths shown in Fig. 6A).
Incorporation of [U-13C]palmitate into the fatty acyl-CoAs of HEK293 cells
Measurement of [U-13C]palmitate incorporation into base- and dual-labeled SP will underestimate the actual rate of biosynthesis if the C16:0-CoA precursor pool has less than 100% isotopic enrichment. Thus, LC-ESI-MS/MS was also used to quantify the major 13C-fatty acyl-CoAs (C16- and C18-) in both the 12C- and 13C- isotopologues.
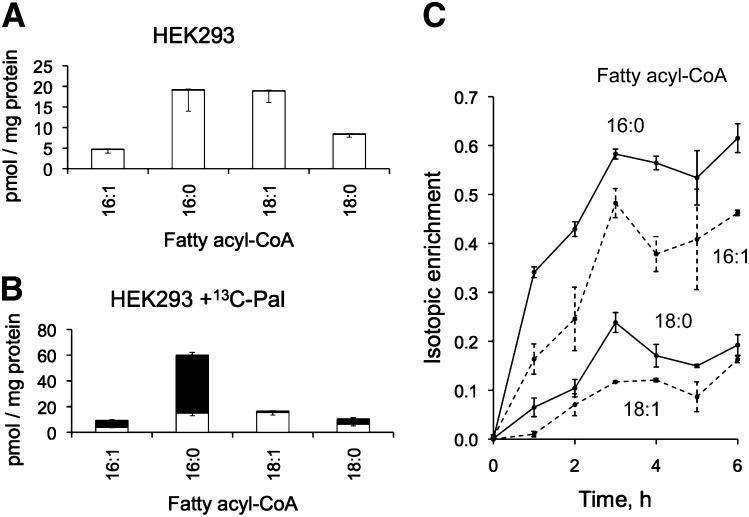
Shown in Fig. 7 are the amounts of unlabeled and [M + 16] fatty acyl-CoAs (C16:0-, C16:1-, C18:0-, and C18:1-CoA) before (Fig. 7A) and after (Fig. 7B) treatment with 0.1 mM [U-13C]palmitate for 3 h. The addition of labeled palmitate approximately tripled the quantity of total C16:0-CoA and doubled the total quantity of C16:1-CoA (see Fig. 7A, B), but the total amounts of C18:0- and C18:1-CoA were not noticeably altered. The isotopic enrichment over the 6 h time course is shown in Fig. 7C; it reached an apparent plateau of ∼60% for C16:0-CoA between 3 and 6 h, which also appears to be when the elongated and/or desaturated metabolites (C18:0-, C16:1-, and C18:1-CoA) reached maxima. Isotopic enrichment was, nonetheless, more extensive for C16:0-CoA at the earliest time point (35% at 1 h) than for other chain lengths (<20% at 1 h). Such a lag would be expected as the 13C-precursor was undergoing coupling with CoA by fatty acyl-CoA synthetases (14–16), followed by elongation (17, 18) and/or desaturation (19–21). The level of isotopic enrichment between 3 and 6 h also differed and was approximately 60%, 45%, 20%, and 10% for C16:0-, C16:1-, C18:0-, and C18:1-CoA, respectively (Fig. 7C). The importance of analyzing not only the downstream SP metabolites but also the level of isotopic enrichment of the fatty acyl-CoA species was illustrated in the differences for C16:0-CoA (60%) versus C18:0-CoA (20%) (Fig. 7C).
Fig. 7.
Quantities of unlabeled (white bars) and labeled (black bars) fatty acyl-CoAs in HEK293 cells before (A) and after 3 h of incubation with 0.1 mM [U-13C]palmitate (B); data are mean ± SD (n = 3). Graph C is the isotopic enrichment of fatty acyl-CoAs (calculated as [M + 16] / [M + 0] + [M + 16]) from HEK293 cells incubated with 0.1 mM [U-13C]palmitate for 0-6 h; data are mean ± range (n = 2).
Estimation of C16:0-ceramide biosynthesis, including the isotopic labeling of fatty acyl-CoAs of HEK293 cells
The isotopic enrichment with 13C16:0-CoA appeared to be uniform between 3 to 6 h after addition of 13C-palmitate (Fig. 7). Over this time period, the rate of appearance of newly synthesized 13C16:0-Cer2 was 37 ± 3 pmol/mg protein × h [the sum of base-labeled (3 ± 0.4) and dual-labeled (34 ± 3)]. Taking into account that 60% of the C16:0-CoA pool was composed of 13C-palmitoyl-CoA, another 25 pmol/mg protein of C16:0-Cer should appear from unlabeled C16:0-CoA, totaling 62 pmol/mg protein*h.
This adjustment is useful not only in thinking about the magnitude of Cer production beyond that estimated using 13C alone, but also in considering the origins of the unlabeled and the fatty acid-labeled Cer (Fig. 6). If the 13C isotopic enrichment of the C16:0-CoA pool had been 100%, then all of the 12C-backbone-labeled Cer would be presumed to reflect Cer that existed before the labeling time course began, most likely from turnover of preexisting, more complex SP, such as SM. If ∼25 pmol of the unlabeled backbone C16:0-Cer/mg protein × h (out of a total of 60 pmol/mg protein × h based on 37 ± 2 pmol of unlabeled/mg protein × h and 23 ± 2 pmol of fatty acid-labeled/mg protein × h) (Fig. 6) appears from de novo biosynthesis using unlabeled C16:0-CoA, then about half of the 12C-backbone-labeled Cer is likely to be due to de novo biosynthesis and about half to turnover. Likewise, it appeared that the amounts of unlabeled Cer leveled off between 3 and 6 h (Fig. 6A), which suggests that Cer metabolism had reached isotopic equilibrium. Taken together, these estimates suggest that the majority of the C16:0-Cer in these cells at a given time point was derived from de novo biosynthesis rather than from the turnover of preexisting complex SP.
With the estimate for the 13C enrichment of the palmitoyl-CoA pool (0.6) and the assumption that a single, well-mixed pool of this biosynthetic precursor is used by both SPT and CerS5/6, one would predict that every 13C-labeled sphingoid base would partition between dual- versus base-labeled C16:0-Cer in the ratio 0.6 to 0.4 (i.e., 1.5:1); however, it is clear from the data in Fig. 5 that the ratio is closer to 10:1. A possible explanation for why utilization of 13C16:0-CoA by both SPT and CerS was more common than predicted might be a close association of the enzymes for these reactions; i.e., the ligase that activates 13C-palmitate to 13C16:0-CoA, SPT, and CerS5/6. Coordination between fatty acyl-CoA biosynthesis and Cer biosynthesis has not yet been reported for these partners, but production of C24-CoA by ELOVL1 elongation has been shown to be coordinated with its utilization by CerS2 for biosynthesis of C24-Cer (22). The subcellular localization of these compounds and the enzymes of SP metabolism might also influence the labeling time course and profiles (23–25).
Incorporation of [U-13C]palmitate into the monohexosylceramides of HEK293 cells
As noted above, another factor in estimating de novo SP biosynthesis using [U-13C]palmitate is that Cer undergoes further metabolism to SM, GlcCer (26), and GalCer (27), with the latter two being the monohexosylCer precursors for more complex glycosphingolipids (Fig. 1). GlcCer and GalCer are isobaric but can be resolved by LC (4), which was unnecessary for HEK293 cells because GalCer was present in insignificant amounts (as described in Experimental Procedures). Therefore, we used the more rapid method for analysis of MHC (4), recognizing that this is referring almost entirely to GlcCer.
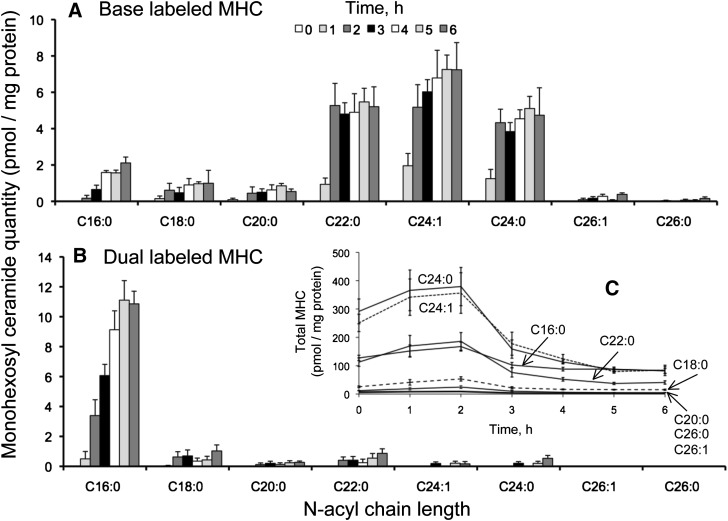
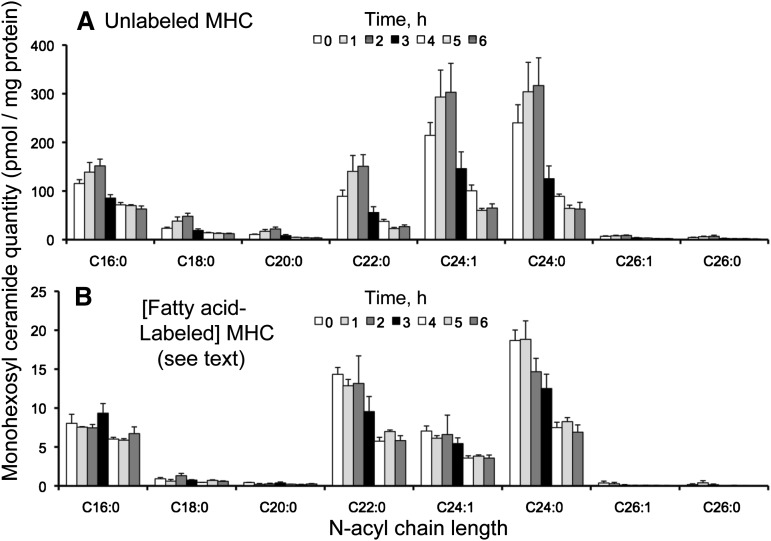
There were 2-8 pmol of the base-labeled isotopomers/mg protein (depending on the chain length of the N-acyl-subspecies) after 6 h of [U-13C]palmitate incubation, with the most prominent being C22:0, C24:1, and C24:0, which differed from the distribution for base-labeled Cer (Figs. 5A and 8A). As seen with Cer (see Figs. 5B and 8B), the dual-labeled MHC was mainly the C16:0 N-acyl-chain length species (∼11 pmol/mg protein after 6 h); each of the other N-acyl chain lengths was ≤1 pmol/mg protein. The unlabeled isotopologue accounted for the majority of the MHC (almost 700 pmol/mg protein at the beginning of incubation) (Figs. 8C and 9A) but decreased to <200 pmol over the 6 h time course. Interestingly, the unlabeled MHC was initially composed of mainly C24:1 and 24:0 N-acyl chain lengths, but the proportion of C16:0 was higher at the end of the 6 h incubation.
Fig. 8.
Base-labeled (A) and dual-labeled (B) monohexosyl ceramide (MHC) from HEK293 cells incubated with 0.1 mM [U-13C]palmitate for 0-6 h. Graph C shows the sum of labeled and unlabeled MHC over this time course. Results are the mean ± SEM (n = 4).
Fig. 9.
Unlabeled (A) and fatty acid-labeled (B) monohexosyl ceramide (MHC) from HEK293 cells incubated with 0.1 mM [U-13C]palmitate for 0-6 h. Results are mean ± SEM (n = 4).
The apparent quantities of fatty acid-labeled MHC (Fig. 9B) were puzzling because it appeared that the 13C-labeling was highest at time zero and decreased, instead of the expected opposite. This situation was explained by identification of MHC with α-hydroxy fatty acids (28) in HEK293 cells, which have the same precursor/product m/z (and under the LC conditions used here, a similar elution profile). This interfered with determination of the amounts of the 13C-fatty acid-labeled MHC, but it at least placed upper limits to what they might be (i.e., the amounts shown if all were 13C-labeled MHC and none were α-hydroxy MHC). This overlap of the MRM pair for 13C-fatty acid-labeled and α-hydroxy MHC illustrates that one must always be mindful that samples might contain isobaric compounds and that steps to distinguish them might be needed (in this case, α-hydroxy MHC could have been resolved using the LC conditions that separate GlcCer and GalCer) (4).
After adjustment for the isotopic enrichment of the fatty acyl-CoA pool, the de novo synthesis of C16:0-MHC would be ∼13 pmol/mg protein per h in the labeling period between 3 and 6 h based on apparent rates of 7 ± 2 pmol for the dual-labeled plus 1 ± 0.5 pmol for the base-labeled species (i.e., 8 ± 2 pmol/mg protein × h total) plus ∼5 pmol/mg protein × h for the 12C-MHC that would be expected to have been made from 12C-palmitoyl-CoA.
These estimates do not take into account the amounts of GlcCer that are incorporated into more complex glycosphingolipids. Analysis of all the isotopomers and isotopologues of that complex family of downstream metabolites remains an analytical challenge. Nonetheless, if the rate of disappearance of unlabeled C16:0-MHC (Fig. 9A) represents the disappearance of preexisting MHC as they are incorporated into more complex glycosphingolipids, then this rate would be two times higher than the apparent rate of C16:0-MHC labeling.
Incorporation of [U-13C]palmitate into the sphingomyelin of HEK293 cells
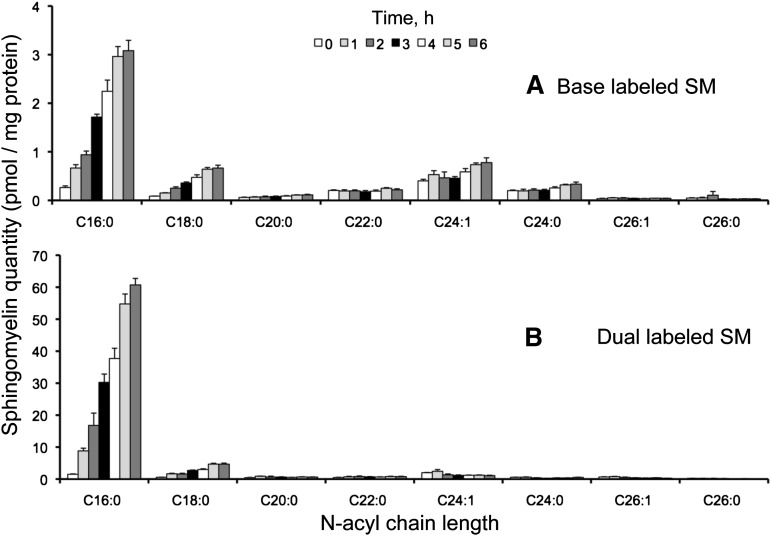
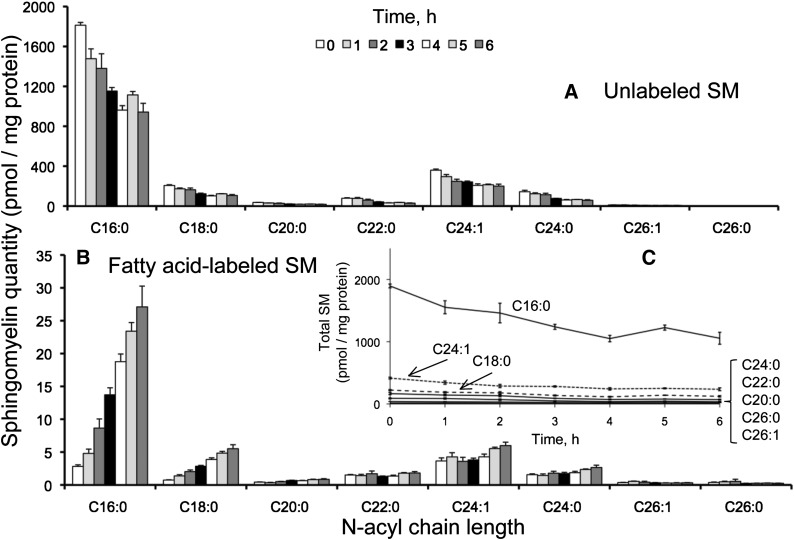
Since SM does not fragment to product ions that give information about the specific sphingoid base and fatty acid composition in positive (Figs. 2 and 3) or negative ionization modes (4), PLaseD was used to convert SM to Cer-1-P for analysis of the backbone composition as described in Experimental Procedures.3 As shown in Fig. 10A, after 6 h of incubation with [U-13C]palmitate, base-labeled SM was ∼4.5 pmol/mg protein with approximately two-thirds as the C16:0-chain length, in contrast to base-labeled Cer (Fig. 5A) and MHC (Fig. 8A) where the longer chains predominated. Dual-labeled SM was ∼45 pmol/mg protein and comprised mainly the C16:0-subspecies (Fig. 10B). Unlabeled SM was initially very high (∼1,800 pmol pmol/mg protein) but decreased by ∼800 pmol over this time period (Fig. 11A). Fatty acid-labeled SM increased to ∼40 pmol/mg protein (Fig. 11B). It is interesting that the sum of the SM with [U-13C]palmitate in the backbone and/or fatty acid is only ∼100 pmol/mg protein, which is only a fraction of the loss of unlabeled SM over this time period, corresponding to a substantial net decrease in SM (Fig. 11C). The cause of this decrease in SM is not known, but it might be due to stimulation of SM turnover by the exogenous tracer since palmitate is known to modulate gene expression and signaling in some systems (29–32).
Fig. 10.
Base-labeled (A) and dual-labeled (B) sphingomyelin (SM) from HEK293 cells incubated with 0.1 mM [U-13C]palmitate for 0-6 h. Calculation of the amounts of 13C-base-labeled SM was done as described in the text. Results are mean ± SEM (n = 4).
Fig. 11.
Unlabeled (A) and fatty acid-labeled (B) sphingomyelin from HEK293 cells incubated with 0.1 mM [U-13C]palmitate for 0-6 h. Calculation of the amounts of 13C-fatty-acid-labeled SM was done as described in the text. Graph C shows the sum of the labeled and unlabeled SM over this time course. Results are mean ± SEM (n = 4).
Estimation of C16:0-sphingomyelin biosynthesis, including the isotopic labeling of fatty acyl-CoAs of HEK293 cells
During the period when the C16:0-CoA was at isotopic equilibrium (3-6 h), the amount of newly synthesized C16:0-SM (i.e., unambiguously synthesized de novo by 13C-labeling of the sphingoid base) was 34 ± 11 (dual-labeled) plus 2 ± 0.6 (base-labeled) for a total of 36 ± 11 pmol/ mg protein × h. Based on the 60% isotopic enrichment of 13C16:0-CoA pool (Fig. 7) during this period, the predicted amount of de novo 12C-C16:0 SM was ∼24 pmol/mg protein × h, for a total of only ∼60 pmol/mg protein × h. This apparently low rate of de novo SM biosynthesis might be related to the apparent stimulation of SM turnover noted above, or it might indicate that the cells derived a considerable amount of SM from the culture medium (i.e., from serum) (33).
Estimation of overall C16:0 sphingolipid biosynthesis, including the isotopic labeling of fatty acyl-CoAs of HEK293 cells
During the period when 13C16:0-CoA was at apparent isotopic equilibrium (3-6 h), the rate of appearance of the summed C16:0-SP was 135 pmol/mg protein × h (62 + 13 + 60 pmol/mg protein × h for C16:0-Cer, C16:0-MHC, and C16:0-SM, respectively). This estimate was compared with an alternative approach for estimating biosynthesis in which the total isotopic enrichment of a particular chain-length species is plotted versus time, followed by curve-fitting using an exponential growth equation (see Experimental Procedures) (5, 34):
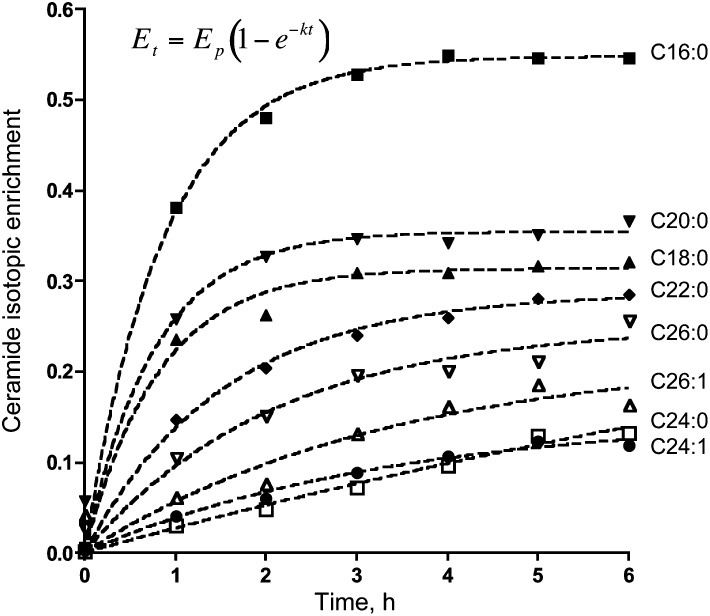
This simple equation models Et (the isotopic enrichment of a metabolite at time = t) as an exponential approach (with base e) to the asymptote Ep (the plateau isotopic enrichment at isotopic equilibrium) driven by k (the fractional turnover rate per unit time of the metabolite pool). This equation is most appropriate for single-pool metabolites that reach isotopic equilibrium during the time course of the experiment (5). Based on the values of Ep and k generated by curve-fitting, this data modeling approach appeared to be satisfactory for Cer (Fig. 12). It was less satisfactory for MHC and SM (not shown) as reflected in the quality of curve-fitting (i.e., R2 < 0.75 for SM longer than C18:0, and for C22:0 and C24:0 MHC) or the calculated Ep was greater than 1 (seen with C16:0- and C18:0-SM and all MHC except C22:0 and C24:0), which is not possible. The poorer agreement for MHC and SM than for Cer might be because they had smaller enrichments and did not reach an enrichment plateau during this timeframe.
Fig. 12.
Ceramide isotopic enrichment versus time. The equation at upper left was used to curve-fit ceramide isotopic enrichment data to estimate the fractional turnover rate per unit time (k) and the plateau isotopic enrichment (Ep) for the ceramide N-acyl chain lengths shown. The ceramide isotopic enrichment was calculated as described in Experimental Procedures. Estimated values for k and Ep as well as the correlation coefficients (R2) are shown in Table 1.
Table 1 shows the estimated fractional turnover rates of the metabolite pool per unit time (k) and different isotopic enrichments at plateau (Ep) for the examined N-acyl chain lengths of Cer. These results are consistent with metabolic reactions becoming rate-limiting during the biosynthesis of Cer with very-long N-acyl chains (e.g., the elongation of [M + 16] C16:0-CoA to form [M + 16] C24:0-CoA, together with the quantity of preexisting C24:0-Cer, may underlie the relatively slow isotopic labeling of C24:0-Cer with [U-13C]palmitate).
TABLE 1.
Estimated values for ceramide rate of appearance (Ra), fractional turnover rate per unit time (k), and plateau isotopic enrichment (Ep) in HEK293 cells
| N-acyl chain | 16:0a | 18:0 | 20:0 | 22:0 | 24:1 | 24:0 | 26:1 | 26:0 |
| k | 1.15b | 1.24 | 1.30 | 0.652 | 0.296 | 0.066 | 0.296 | 0.479 |
| Ep | 0.548c | 0.314 | 0.355 | 0.287 | 0.151 | 0.423 | 0.219 | 0.251 |
| Q | 103.2d | 28.0 | 5.9 | 18.6 | 30.7 | 25.7 | 1.3 | 0.9 |
| Ra | 118.7e | 34.7 | 7.6 | 12.1 | 9.1 | 1.7 | 0.4 | 0.4 |
| R | 0.999f | 0.989 | 0.952 | 0.995 | 0.988 | 0.987 | 0.842 | 0.951 |
Ceramide N-acyl chain lengths are designated x:y, where x = number of carbon atoms and y = number of double bonds.
Fractional turnover rate per unit time (h−1).
Isotopic enrichment at plateau/isotopic equilibrium (unitless).
Unlabeled ceramide (12C) quantities at 6 h (pmol/mg protein).
The rate of appearance of ceramide calculated as Ra = k × Q (pmol/mg protein × h).
Using the estimated values of k and the quantities of unlabeled Cer at 6 h (Q) for each N-acyl chain length, the rate of appearance of Cer (Ra) was determined by the relationship k × Q = Ra, as shown in Table 1. The Ra of C16:0-Cer was ∼119 pmol/mg protein × h using this approach, which is similar to the 135 pmol/mg protein × h estimate obtained by quantitating C16:0-Cer (and its MHC and SM metabolites), followed by correction for C16:0-CoA labeling.
Extending this rationale to very long chain N-acyl SPs, addition of the biosynthetic rates estimated for all of the N-acyl chain lengths of Cer observed in HEK293 cells using the exponential growth curve-fitting approach (Table 1) gives a total de novo SP biosynthetic rate of 185 pmol/mg protein × h, or about ∼1.6-fold higher than the estimated biosynthetic rate for just the C16:0 SP, under these conditions.
Additional comments regarding the use of [U-13C]palmitate for studies of de novo sphingolipid biosynthesis
Lipidomic analysis provides the quantities of different SP subspecies present in cells under particular circumstances, but it does not reveal the origin (i.e., from de novo biosynthesis, turnover, and/or recycling). As illustrated by this study, additional information can be obtained using [U-13C]palmitate as a precursor combined with LC-ESI-MS/MS for analysis of the four isotopologues and isotopomers of each N-acyl SP category of interest (4), especially if combined with analysis of the isotopic enrichment of the precursor fatty acyl-CoAs (10). Consideration of these factors gives a more accurate picture of de novo sphingolipid biosynthesis than has heretofore been possible.
At the same time, there are inherent limitations to such approximations. One of the possible limitations is that adding 0.1 mM [U-13C]palmitate tripled the quantity of total palmitoyl-CoA in the cells (Fig. 7B), even though this concentration is within the physiological norm (35). This might not be an innocuous perturbation because palmitoyl-CoA can affect gene regulation (36, 37), ion transport (38), and SP biosynthesis (39, 40). An alternative approach might be to use a stable isotope-labeled precursor for endogenous palmitate biosynthesis, such as [1,2-13C]acetate (which would necessitate a more complex analysis of the data) (41–43), or to use labeled serine, although that has the disadvantage that it only shifts the m/z of the labeled SP by a few amu (not to mention that serine also participates in multiple metabolic pathways).
Another potential limitation is selection of an optimal time course. These studies chose a time course that minimized complications from “scrambling” of the stable isotope-labeled precursor (e.g., by β-oxidation of U-13C-palmitate to 13C-acetate that mixes with 12C-acetate from other sources and appears in 13C-palmitate with an amu shift other than 16). This was sufficient to isotopically label some (but not all) SP in these cells, but it uncovered some puzzling changes, such as the apparent turnover of SM. Further investigation will be needed to understand these observations, and it will be interesting to see which results are similar and different for other cell types.
Supplementary Material
Footnotes
Abbreviations:
- Cer
- ceramide
- CerS
- Cer synthases
- DES
- desaturases
- DHCer
- dihydroceramide
- GalCer
- galactosylceramide
- GlcCer
- glucosylceramide
- MHC
- monohexosylceramide
- MRM
- multiple reaction monitoring
- PLaseD
- phospholipase D
- r
- fraction of total quantity represented by monoisotopic ion
- SP
- sphingolipid
- SphK
- sphingosine kinases
- SPT
- serine palmitoyltransferase
The online version of this article (available at http://www.jlr.org) contains supplementary data in the form of two figures and fours tables.
As stated, this reflects the appearance of newly synthesized Cer per se, not the total amount of Cer made by the cells, since the latter includes downstream metabolites, which will be discussed later.
After these studies were begun, we found a modification of the usual SM analysis method that gives backbone information (4).
REFERENCES
- 1.Merrill A. H., Jr, Wang M. D., Park M., Sullards M. C. 2007. (Glyco)sphingolipidology: an amazing challenge and opportunity for systems biology. Trends Biochem. Sci. 32: 457–468. [DOI] [PubMed] [Google Scholar]
- 2.Pruett S. T., Bushnev A., Hagedorn K., Adiga M., Haynes C. A., Sullards M. C., Liotta D. C., Merrill A. H., Jr 2008. Biodiversity of sphingoid bases (“sphingosines”) and related amino alcohols. J. Lipid Res. 49: 1621–1639. [DOI] [PMC free article] [PubMed] [Google Scholar]
- 3.Haynes C. A., Allegood J. C., Park H., Sullards M. C. 2009. Sphingolipidomics: methods for the comprehensive analysis of sphingolipids. J. Chromatogr. B Analyt. Technol. Biomed. Life Sci. 877: 2696–2708. [DOI] [PMC free article] [PubMed] [Google Scholar]
- 4.Shaner R. L., Allegood J. C., Park H., Wang E., Kelly S., Haynes C. A., Sullards M. C., Merrill A. H., Jr 2009. Quantitative analysis of sphingolipids for lipidomics using triple quadrupole and quadrupole linear ion trap mass spectrometers. J. Lipid Res. 50: 1692–1707. [DOI] [PMC free article] [PubMed] [Google Scholar]
- 5.Wolfe R., Chinkes D. 2005. Isotope Tracers in Metabolic Research: Principles and Practice of Kinetic Analysis. 2nd edition John Wiley & Sons, Hoboken, NJ. [Google Scholar]
- 6.Pewzner-Jung Y., Ben-Dor S., Futerman A. H. 2006. When do Lasses (longevity assurance genes) become CerS (ceramide synthases)?: insights into the regulation of ceramide synthesis. J. Biol. Chem. 281: 25001–25005. [DOI] [PubMed] [Google Scholar]
- 7.Tserng K. Y., Griffin R. 2004. Studies of lipid turnover in cells with stable isotope and gas chromatograph-mass spectrometry. Anal. Biochem. 325: 344–353. [DOI] [PubMed] [Google Scholar]
- 8.Tserng K. Y., Griffin R. 2003. Quantitation and molecular species determination of diacylglycerols, phosphatidylcholines, ceramides, and sphingomyelins with gas chromatography. Anal. Biochem. 323: 84–93. [DOI] [PubMed] [Google Scholar]
- 9.Berdyshev E. V., Gorshkova I. A., Usatyuk P., Zhao Y., Saatian B., Hubbard W., Natarajan V. 2006. De novo biosynthesis of dihydrosphingosine-1-phosphate by sphingosine kinase 1 in mammalian cells. Cell. Signal. 18: 1779–1792. [DOI] [PubMed] [Google Scholar]
- 10.Haynes C. A., Allegood J. C., Sims K., Wang E. W., Sullards M. C., Merrill A. H., Jr 2008. Quantitation of fatty acyl-coenzyme A molecular species in mammalian cells by liquid chromatography-electrospray ionization tandem mass spectrometry (LC-ESI MS/MS). J. Lipid Res. 49: 1113–1125. [DOI] [PMC free article] [PubMed] [Google Scholar]
- 11.Wei J., Yerokun T., Leipelt M., Haynes C. A., Radhakrishna H., Momin A., Kelly S., Park H., Wang E., Carton J. M., et al. 2009. Serine palmitoyltransferase subunit 1 is present in the endoplasmic reticulum, nucleus and focal adhesions, and functions in cell morphology. Biochim. Biophys. Acta. 1791: 746–756. [DOI] [PMC free article] [PubMed] [Google Scholar]
- 12.Smith E. R., Merrill A. H., Obeid L. M., Hannun Y. A. 2000. Effects of sphingosine and other sphingolipids on protein kinase C. Methods Enzymol. 312: 361–373. [DOI] [PubMed] [Google Scholar]
- 13.Venkataraman K., Riebeling C., Bodennec J., Riezman H., Allegood J. C., Sullards M. C., Merrill A. H., Jr, Futerman A. H. 2002. Upstream of growth and differentiation factor 1 (uog1), a mammalian homolog of the yeast longevity assurance gene 1 (LAG1), regulates N-stearoyl-sphinganine (C18-(dihydro)ceramide) synthesis in a fumonisin B1-independent manner in mammalian cells. J. Biol. Chem. 277: 35642–35649. [DOI] [PubMed] [Google Scholar]
- 14.Mashek D. G., McKenzie M. A., Van Horn C. G., Coleman R. A. 2006. Rat long chain acyl-CoA synthetase 5 increases fatty acid uptake and partitioning to cellular triacylglycerol in McArdle-RH7777 cells. J. Biol. Chem. 281: 945–950. [DOI] [PubMed] [Google Scholar]
- 15.Li L. O., Mashek D. G., An J., Doughman S. D., Newgard C. B., Coleman R. A. 2006. Overexpression of rat long chain acyl-coa synthetase 1 alters fatty acid metabolism in rat primary hepatocytes. J. Biol. Chem. 281: 37246–37255. [DOI] [PubMed] [Google Scholar]
- 16.Marszalek J. R., Kitidis C., Dirusso C. C., Lodish H. F. 2005. Long-chain acyl-CoA synthetase 6 preferentially promotes DHA metabolism. J. Biol. Chem. 280: 10817–10826. [DOI] [PubMed] [Google Scholar]
- 17.Wang Y., Botolin D., Christian B., Busik J., Xu J., Jump D. B. 2005. Tissue-specific, nutritional, and developmental regulation of rat fatty acid elongases. J. Lipid Res. 46: 706–715. [DOI] [PMC free article] [PubMed] [Google Scholar]
- 18.Lagali P. S., Liu J., Ambasudhan R., Kakuk L. E., Bernstein S. L., Seigel G. M., Wong P. W., Ayyagari R. 2003. Evolutionarily conserved ELOVL4 gene expression in the vertebrate retina. Invest. Ophthalmol. Vis. Sci. 44: 2841–2850. [DOI] [PubMed] [Google Scholar]
- 19.Moreau C., Froment P., Tosca L., Moreau V., Dupont J. 2006. Expression and regulation of the SCD2 desaturase in the rat ovary. Biol. Reprod. 74: 75–87. [DOI] [PubMed] [Google Scholar]
- 20.Man W. C., Miyazaki M., Chu K., Ntambi J. M. 2006. Membrane topology of mouse stearoyl-CoA desaturase 1. J. Biol. Chem. 281: 1251–1260. [DOI] [PubMed] [Google Scholar]
- 21.Wang J., Yu L., Schmidt R. E., Su C., Huang X., Gould K., Cao G. 2005. Characterization of HSCD5, a novel human stearoyl-CoA desaturase unique to primates. Biochem. Biophys. Res. Commun. 332: 735–742. [DOI] [PubMed] [Google Scholar]
- 22.Ohno Y., Suto S., Yamanaka M., Mizutani Y., Mitsutake S., Igarashi Y., Sassa T., Kihara A. 2010. ELOVL1 production of C24 acyl-CoAs is linked to C24 sphingolipid synthesis. Proc. Natl. Acad. Sci. USA. 107: 18439–18444. [DOI] [PMC free article] [PubMed] [Google Scholar]
- 23.Yasuda S., Nishijima M., Hanada K. 2003. Localization, topology, and function of the LCB1 subunit of serine palmitoyltransferase in mammalian cells. J. Biol. Chem. 278: 4176–4183. [DOI] [PubMed] [Google Scholar]
- 24.Hanada K., Kumagai K., Yasuda S., Miura Y., Kawano M., Fukasawa M., Nishijima M. 2003. Molecular machinery for non-vesicular trafficking of ceramide. Nature. 426: 803–809. [DOI] [PubMed] [Google Scholar]
- 25.Bionda C., Portoukalian J., Schmitt D., Rodriguez-Lafrasse C., Ardail D. 2004. Subcellular compartmentalization of ceramide metabolism: MAM (mitochondria-associated membrane) and/or mitochondria? Biochem. J. 382: 527–533. [DOI] [PMC free article] [PubMed] [Google Scholar]
- 26.Halter D., Neumann S., van Dijk S. M., Wolthoorn J., de Maziere A. M., Vieira O. V., Mattjus P., Klumperman J., van Meer G., Sprong H. 2007. Pre- and post-Golgi translocation of glucosylceramide in glycosphingolipid synthesis. J. Cell Biol. 179: 101–115. [DOI] [PMC free article] [PubMed] [Google Scholar]
- 27.Burger K. N., van der Bijl P., van Meer G. 1996. Topology of sphingolipid galactosyltransferases in ER and Golgi: transbilayer movement of monohexosyl sphingolipids is required for higher glycosphingolipid biosynthesis. J. Cell Biol. 133: 15–28. [DOI] [PMC free article] [PubMed] [Google Scholar]
- 28.Uchida Y., Hama H., Alderson N. L., Douangpanya S., Wang Y., Crumrine D. A., Elias P. M., Holleran W. M. 2007. Fatty acid 2-hydroxylase, encoded by FA2H, accounts for differentiation-associated increase in 2-OH ceramides during keratinocyte differentiation. J. Biol. Chem. 282: 13211–13219. [DOI] [PubMed] [Google Scholar]
- 29.Johnstone K. A., Diakogiannaki E., Dhayal S., Morgan N. G., Harries L. W. 2011. Dysregulation of Hnf1b gene expression in cultured Beta-cells in response to cytotoxic fatty acid. JOP. 12: 6–10. [PubMed] [Google Scholar]
- 30.Krogmann A., Staiger K., Haas C., Gommer N., Peter A., Heni M., Machicao F., Haring H. U., Staiger H. 2011. Inflammatory response of human coronary artery endothelial cells to saturated long-chain fatty acids. Microvasc. Res. 81: 52–59. [DOI] [PubMed] [Google Scholar]
- 31.Sun Y., Ren M., Gao G. Q., Gong B., Xin W., Guo H., Zhang X. J., Gao L., Zhao J. J. 2008. Chronic palmitate exposure inhibits AMPKalpha and decreases glucose-stimulated insulin secretion from beta-cells: modulation by fenofibrate. Acta Pharmacol. Sin. 29: 443–450. [DOI] [PubMed] [Google Scholar]
- 32.Guo W., Wong S., Xie W., Lei T., Luo Z. 2007. Palmitate modulates intracellular signaling, induces endoplasmic reticulum stress, and causes apoptosis in mouse 3T3–L1 and rat primary preadipocytes. Am. J. Physiol. Endocrinol. Metab. 293: E576–E586. [DOI] [PubMed] [Google Scholar]
- 33.Merrill A. H., Jr, Wang E., Innis W. S., Mullins R. 1985. Increases in serum sphingomyelin by 17 beta-estradiol. Lipids. 20: 252–254. [DOI] [PubMed] [Google Scholar]
- 34.Mao C. S., Bassilian S., Lim S. K., Lee W. N. 2002. Underestimation of gluconeogenesis by the [U-(13)C(6)]glucose method: effect of lack of isotope equilibrium. Am. J. Physiol. Endocrinol. Metab. 282: E376–E385. [DOI] [PubMed] [Google Scholar]
- 35.Patterson B. W., Zhao G., Elias N., Hachey D. L., Klein S. 1999. Validation of a new procedure to determine plasma fatty acid concentration and isotopic enrichment. J. Lipid Res. 40: 2118–2124. [PubMed] [Google Scholar]
- 36.Black P. N., Faergeman N. J., DiRusso C. C. 2000. Long-chain acyl-CoA-dependent regulation of gene expression in bacteria, yeast and mammals. J. Nutr. 130: 305S–309S. [DOI] [PubMed] [Google Scholar]
- 37.Hertz R., Magenheim J., Berman I., Bar-Tana J. 1998. Fatty acyl-CoA thioesters are ligands of hepatic nuclear factor-4alpha. Nature. 392: 512–516. [DOI] [PubMed] [Google Scholar]
- 38.Hamming K. S., Riedel M. J., Soliman D., Matemisz L. C., Webster N. J., Searle G. J., MacDonald P. E., Light P. E. 2008. Splice variant-dependent regulation of beta-cell sodium-calcium exchange by acyl-coenzyme As. Mol. Endocrinol. 22: 2293–2306. [DOI] [PMC free article] [PubMed] [Google Scholar]
- 39.Merrill A. H., Jr, Wang E., Mullins R. E. 1988. Kinetics of long-chain (sphingoid) base biosynthesis in intact LM cells: effects of varying the extracellular concentrations of serine and fatty acid precursors of this pathway. Biochemistry. 27: 340–345. [DOI] [PubMed] [Google Scholar]
- 40.Hu W., Bielawski J., Samad F., Merrill A. H., Jr, Cowart L. A. 2009. Palmitate increases sphingosine-1-phosphate in C2C12 myotubes via upregulation of sphingosine kinase message and activity. J. Lipid Res. 50: 1852–1862. [DOI] [PMC free article] [PubMed] [Google Scholar]
- 41.Hellerstein M. K., Neese R. A. 1999. Mass isotopomer distribution analysis at eight years: theoretical, analytic, and experimental considerations. Am. J. Physiol. 276: E1146–E1170. [DOI] [PubMed] [Google Scholar]
- 42.Hellerstein M. K., Schwarz J. M., Neese R. A. 1996. Regulation of hepatic de novo lipogenesis in humans. Annu. Rev. Nutr. 16: 523–557. [DOI] [PubMed] [Google Scholar]
- 43.Hellerstein M. K., Neese R. A. 1992. Mass isotopomer distribution analysis: a technique for measuring biosynthesis and turnover of polymers. Am. J. Physiol. 263: E988–E1001. [DOI] [PubMed] [Google Scholar]
- 44.Maceyka M., Sankala H., Hait N. C., Le Stunff H., Liu H., Toman R., Collier C., Zhang M., Satin L. S., Merrill A. H., Jr, et al. 2005. SphK1 and SphK2, sphingosine kinase isoenzymes with opposing functions in sphingolipid metabolism. J. Biol. Chem. 280: 37118–37129. [DOI] [PubMed] [Google Scholar]
- 45.Reiss U., Oskouian B., Zhou J., Gupta V., Sooriyakumaran P., Kelly S., Wang E., Merrill A. H., Jr, Saba J. D. 2004. Sphingosine-phosphate lyase enhances stress-induced ceramide generation and apoptosis. J. Biol. Chem. 279: 1281–1290. [DOI] [PubMed] [Google Scholar]
- 46.Hanada K. 2003. Serine palmitoyltransferase, a key enzyme of sphingolipid metabolism. Biochim. Biophys. Acta. 1632: 16–30. [DOI] [PubMed] [Google Scholar]
- 47.Imgrund S., Hartmann D., Farwanah H., Eckhardt M., Sandhoff R., Degen J., Gieselmann V., Sandhoff K., Willecke K. 2009. Adult ceramide synthase 2 (CERS2)-deficient mice exhibit myelin sheath defects, cerebellar degeneration, and hepatocarcinomas. J. Biol. Chem. 284: 33549–33560. [DOI] [PMC free article] [PubMed] [Google Scholar]
- 48.Spassieva S. D., Mullen T. D., Townsend D. M., Obeid L. M. 2009. Disruption of ceramide synthesis by CerS2 down-regulation leads to autophagy and the unfolded protein response. Biochem. J. 424: 273–283. [DOI] [PMC free article] [PubMed] [Google Scholar]
- 49.Mizutani Y., Kihara A., Igarashi Y. 2006. LASS3 (longevity assurance homologue 3) is a mainly testis-specific (dihydro)ceramide synthase with relatively broad substrate specificity. Biochem. J. 398: 531–538. [DOI] [PMC free article] [PubMed] [Google Scholar]
- 50.Lahiri S., Futerman A. H. 2005. LASS5 is a bona fide dihydroceramide synthase that selectively utilizes palmitoyl-CoA as acyl donor. J. Biol. Chem. 280: 33735–33738. [DOI] [PubMed] [Google Scholar]
Associated Data
This section collects any data citations, data availability statements, or supplementary materials included in this article.


