Abstract
Actin oxidation is known to result in changes in cytoskeleton organization and dynamics. Actin oxidation is clinically relevant since it occurs in the erythrocytes of sickle cell patients and may be the direct cause of the lack of morphological plasticity observed in irreversibly sickled red blood cells (ISCs). During episodes of crisis, ISCs accumulate C284-C373 intra-molecularly disulfide bonded actin, which reduces actin filament dynamics. Actin cysteines 284 and 373 (285 and 374 in yeast) are conserved, suggesting that they play an important functional role. We have been investigating the physiological roles of these cysteines using the model eukaryote S. cerevisiae in response to oxidative stress load. During acute oxidative stress, all of the F-actin in wild type cells collapses into a few puncta that we call oxidized actin bodies (OABs). In contrast, during acute oxidative stress the actin cytoskeleton in Cys-to-Ala actin mutants remains polarized longer, OABs are slower to form, and the cells recover more slowly than wild type cells, suggesting that the OABs play a protective role. Live cell imaging revealed that OABs are large, immobile structures that contain actin binding proteins and that can form by the fusion of actin cortical patches. We propose that actin’s C285 and C374 may help to protect the cell from oxidative stress arising from normal oxidative metabolism and contribute to the cell’s general adaptive response to oxidative stress.
Introduction
Reactive oxygen species (ROS) are produced as a consequence of oxidative metabolism (Turrens, 2003; Toledano et al., 2004). These ROS include superoxide (O2•−), hydrogen peroxide (H2O2), and hydroxyl radical (OH•−), which are distinct in their selective reactivity with DNA, lipids and proteins in cells (Winterbourn and Metodiewa, 1999). Proteins, in turn, differ in their reactivity towards various ROS (Poole et al., 2004). Despite the damage that ROS can cause to proteins, they may also function as important signaling molecules in the cell with functions ranging from cell growth signaling to cell aging and apoptosis, depending on their relative intracellular concentrations (Giorgio et al., 2007). Among the various amino acids that can be targeted by ROS, cysteine residues are the most susceptible, with the degree of reactivity depending on the accessibility of the cysteine residue in question and its redox microenvironment (Poole et al., 2004). Cysteine residues are generally not directly reactive with hydrogen peroxide at physiological pH, but are prone to oxidation by hydrogen peroxide either as a result of their conversion to an anionic form or via their association with transition metals (Ignarro, 2000).
One important way in which ROS, specifically hydrogen peroxide, can modulate cellular functions in mammalian cells is through the modification of the actin cytoskeleton (Goldschmidt-Clermont and Moldovan, 1999; Clempus and Griendling, 2006). For example, Hertelendi et al. (Hertelendi et al., 2008) have shown that oxidatively stressed human cardiomyocytes accumulate oxidized actin and proteomics studies in human peripheral blood mononuclear cells have identified actin as a target of oxidation (Laragione et al., 2003). Several studies have characterized the effects of actin oxidation after peroxide treatment on the regulation of actin polymerization in vitro and in vivo. In vitro, treatment of actin with 5–20 mM hydrogen peroxide inhibited actin polymerization (DalleDonne et al., 1995; Milzani et al., 1997). In vivo, hydrogen peroxide treatment of cells caused cytoskeletal rearrangements, including F-actin fragmentation and an amassment that correlated with gross cell morphological changes such as membrane blebbing (Dalle-Donne et al., 2001). Transmission electron microscopy revealed that the F-actin accumulating under these conditions consists of actin filament bundles (Hinshaw et al., 1991). Different cell types vary in their sensitivity to hydrogen peroxide depending on the oxidative environment to which a given cell is accustomed (Huot et al., 1997).
As in other proteins, the cysteines in actin are some of the most susceptible targets of oxidation (Dalle-Donne et al., 2001) and their oxidative modification is the likely cause of cytoskeletal rearrangements in mammalian cells upon hydrogen peroxide treatment (Hinshaw et al., 1991; Omann et al., 1994; Mocali et al., 1995; Fiorentini et al., 1999). Cysteine 374 is the most reactive of actin cysteines (Takashi, 1979) as it is frequently found glutathionylated (Dalle-Donne et al., 2003) and oxidized (Milzani et al., 2000) in different mammalian cell types. Crystallization of hydrogen peroxide treated actin has shown that a C374-C374 intermolecular disulfide bond can form under such conditions (Lassing et al., 2007), preventing polymerization.
One of the best-studied examples of actin oxidation is observed in the erythrocytes of sickle cell patients. Sickle cell anemia can be considered a disease of redox imbalance (Coyle and Puttfarcken, 1993; Goodman, 2007). ROS accumulation and low levels of reduced glutathione are characteristic of sickle cell red blood cells and this redox imbalance leads to actin cysteine oxidation (Goodman, 2004). Irreversibly sickled red blood cells (ISCs) contribute to vaso-occlusion during crisis events and contain high levels of intra-molecularly disulfide bonded s-actin (C284-C373) (Shartava et al., 1995; Bencsath et al., 1996; Shartava et al., 1997). This modification strongly correlates with the inability of F-actin to de-polymerize at 37 °C and also with the lack of morphological plasticity of irreversibly sickled red blood cells (Shartava et al., 1997).
Redox imbalance can result from either an accumulation of ROS or a decrease in the cell antioxidant defense systems. Many of these defense systems are conserved from yeast to mammalian cells and are specifically involved in converting disulfide-bonded proteins back to their free sulfhydryl forms. Glutathione, a low molecular weight thiol, is the most abundant and prominent system in detoxifying ROS and reversing cysteine oxidation (Meister and Anderson, 1983; Gilbert, 1990). The glutaredoxin and thioredoxin systems also participate in reducing disulfide bonded proteins (Lopez-Mirabal and Winther, 2008). Consistent with the role of the cytoskeleton as a redox-sensitive system, we have found that many of these “redox” genes show complex haploinsufficient interactions with actin, and yeast strains with deletions of these genes show actin defects characterized by a hyperstabilized appearance of actin and altered cell morphology (Haarer et al., 2007).
The present study focuses on the ability of the actin cytoskeleton to help protect the cell from oxidative stress. Under high levels of oxidative stress, the actin cytoskeleton appears to play a protective role accompanied by the collapse of the actin cytoskeleton into oxidation-induced actin bodies (OABs) that sequester actin and its associated proteins into immobile and non-dynamic structures.
Materials and Methods
Strains and media
Table 1 lists all strains used in this study. All strains are in the S288C background. Media, growth conditions, sporulation and genetic techniques utilized were as described (Amberg et al., 2005).
Table 1.
Saccharomyces cerevisiae strains used in this study.
| Name | Genotype | Source |
|---|---|---|
| SVY12xBY4741 | MATa/α ura3Δ0/ura3Δ0 leu2Δ0/leu2Δ0 his3Δ1/his3Δ1 met15Δ0/MET15 act1Δ0::natR/ACT1 | This study |
| DAY111 | MATa ura3–52 leu2Δ1trp1Δ63 his3Δ200 | D. Amberg |
| MDY74 | MATa ura3Δ0 leu2Δ0 met15Δ0 his3Δ1 act1C17,217A::HIS3 | This study |
| MDY80 | MATa ura3Δ0 leu2Δ0 met15Δ0 his3Δ1 act1285,374A::HIS3 | This study |
| MDY78 | MATa ura3Δ0 leu2Δ0 met15Δ0 his3Δ1 act1C17,217,285,374A::HIS3 | This study |
| SAC6-GFP | MATa ura3Δ0 leu2Δ0 met15Δ0 his3Δ1 SAC6-GFP::HIS3 | Huh et al., 2003 |
| ABP140-GFP | MATa ura3Δ0 leu2Δ0 met15Δ0 his3Δ1 ABP140-GFP::HIS3 | Huh et al., 2003 |
Multiple Cys-to-Ala mutations were constructed by overlap/fusion PCR as described (Amberg et al., 1995). The plasmid pRB1456, containing ACT1 with a HIS3 cassette inserted at a BclI site 292 base pairs down from the ACT1 stop codon, was utilized as a template for all PCR reactions. All primers utilized in primary PCR reactions for all mutant actin alleles are shown in Table 2, and the sequences of those primers are shown in Table 3. Final fusion PCR products were amplified using the DAo-ACT1–50 and DAo-ACT1–53 primers and the primary PCR products as templates. Fusion PCR products were gel-purified and transformed into the ACT1::natR heterozygous S288C strain SVY12xBY4741 using high efficiency lithium acetate transformation (Amberg et al., 2005). His+ transformants were selected and screened for sensitivity to nourseothricin (NAT), sporulated and dissected to isolate haploids bearing the Cys-to-Ala actin alleles. In all cases the actin alleles were sequenced to confirm that only the desired mutations were present.
Table 2.
Primer pairs used in the construction of the ACT1 cysteine-to-alanine actin mutants.
| Mutant actin allele | Fragment number | PCR primer pair |
|---|---|---|
| C17,217A | 1 | DAo-ACT1–50; MDo-ACT1–2 |
| 2 | MDo-ACT1–1; MDo-ACT1–4 | |
| 3 | MDo-ACT1–3; DAo-ACT1–53 | |
| C285,374A | 1 | DAo-ACT1–50; DAo-ACT1–54 |
| 2 | DAo-ACT1–55; DAo-ACT1–51 | |
| 3 | DAo-ACT1–52; DAo-ACT1–53 | |
| C17,217,285,374A | 1 | DAo-ACT1–50; MDo-ACT1–2 |
| 2 | MDo-ACT1–1; MDo-ACT1–4 | |
| 3 | MDo-ACT1–3; DAo-ACT1–54 | |
| 4 | DAo-ACT1–55; DAo-ACT1–51 | |
| 5 | DAo-ACT1–53; DAo-ACT1–52 |
Table 3.
Primer sequences.
| Primer | Primer sequence |
|---|---|
| DAo-ACT1–50 | 5′ -GAT CCT TTC CTT CCC AAT CTC - 3′ |
| DAo-ACT1–51 | 5′ -AGA TTA GAA AGC CTT GTG AAC GAT AGA TGG - 3′ |
| DAo-ACT1–52 | 5′ -CAC CAC AAG GCT TTC TAA TCT CTG CTT TTG TGC -3″ |
| DAo-ACT1–53 | 5′ -CCC AGA AAC AAA GGG TAT GAG - 3′ |
| DAo-ACT1–54 | 5′ -ATC GAC ATC AGC CTT CAT GAT GGA GTT GTA AGT - 3′ |
| DAo-ACT1–55 | 5′ -ATC ATG AAG GCT GAT GTC GAT GTC CGT AAG GAA -3′ |
| MDo-ACT1–1 | 5′ -AAC GGT TCT GGT ATG GCT AAA GCC GGT TTT GCC GGT GAC - 3′ |
| MDo-ACT1–2 | 5′ -TAA CTA TTG CCA AGA CCA TAC CGA TTT - 3′ |
| MDo-ACT1–3 | 5′ -ATC AAG GAA AAA CTA GCT TAC GTC GCC TTG GAC TTC GAA - 3′ |
| MDo-ACT1–4 | 5′ -GCA CTG TAG TTC CTT TTT GAT CGA ATG - 3′ |
Cell cultures for imaging
Live cells were imaged in sealed chambers on pads of 25% gelatin in minimal media as described by Wu et al. (2003), with modifications. To prepare gelatin pads, 0.25 g of gelatin (Sigma catalog #G2500) was added to 1 ml minimal synthetic medium and dissolved at 65°C; ~50 μl of the heated gelatin solution was added onto a glass slide, immediately covered with another slide, clipped together and allowed to solidify. The glass/gelatin sandwich was pried open just before the cell suspension was added. To prepare gelatin pads containing 2.9 mM H2O2, peroxide was added to the heated gelatin solution just before making the pads.
For live cell imaging, wild type or Cys-to-Ala mutant cells expressing Sac6p-GFP were grown for ~3.5 h in synthetic complete minimal medium to exponential phase to OD595 0.2–0.5. For microscopy, a 1 ml aliquot was removed from the culture, cells were pelleted at 5,000 rpm for 1 min in a microfuge, 900 μl of supernatant were removed and cells were gently resuspended in the remaining 100 μl of media. Four μl of cells were pipetted onto a gelatin pad and covered with a coverslip, which was sealed along the edges with Valap (1:1:1 vaseline:lanolin:paraffin).
Cells were treated with 2.9 mM hydrogen peroxide either in culture for 30–60 min before imaging, or in concentrated suspension in imaging chambers just before and during imaging. To treat cells in culture, H2O2 was added to a final concentration of 2.9 mM for 30–60 min, the cells were pelleted, re-suspended in 100 μl of the remaining media and then pipetted onto a gelatin pad containing 2.9 mM H2O2. To treat cells directly in imaging chambers, H2O2 was added to a concentration of 2.9 mM to a final 100 ul concentrated suspension of untreated cells immediately before pipetting cells onto gelatin pad containing 2.9 mM H2O2.
Live cell imaging and data analysis
Live cells were imaged using an UltraView VoX spinning disk confocal system (Perkin Elmer Inc., Waltham, MA), installed on a Nikon TiE microscope equipped with a Nikon 100x, 1.4NA Plan Apo objective (Nikon/MVI, Avon, MA), outfitted with a Hamamatsu C9100-50 EMCCD camera (Hamamatsu, Bridgewater, NJ) and controlled by Volocity software (Improvision, Waltham, MA). Acquisition parameters included no binning, 50% 488 nm laser power and gain (sensitivity) setting of 100. Two-dimensional time-lapse movies in a single confocal section were acquired at the rate of 2 frames per second with an exposure time of 50 ms per frame. Three-dimensional time-lapse series of Z-stacks consisting of 13 confocal sections through the entire depth of the cell at the intervals of 0.6 μm were collected at the rate of 1 Z-stack every 2 seconds and an exposure time of 50 ms per each section (~1–1.5 s per Z-stack). The total duration of each movie was 1 min.
Live cell imaging data were analyzed in Image J (http://rsbweb.nih.gov/ij/). The lifetimes and the fluorescence intensities of Sac6-GFP positive structures (patches and OABs) were analyzed from 2D frames acquired at 1 min intervals in a single confocal section through the middle of untreated or H2O2-treated small to medium-budded cells. The lifetimes were scored according to whether a given structure remained in the field for less than 20 s, for 20–59 s (labeled 20–60 s in the Figure), or for the entire duration of the movie (>60 s).
Fluorescence intensities and areas of Sac6-GFP structures and cytoplasmic background intensity were measured in the 12th frame (5.5 s) of each movie, a time point when cell auto-fluorescence under GFP illumination was almost completely eliminated by photobleaching. The total fluorescence intensity for each Sac6-GFP structure was calculated according to the formula: (Patch Mean Intensity - Cytoplasmic Mean Intensity) x Patch Area. Patches that were either out of focus, showed a fusion event, or were too close to other patches were not scored. Between 40–50 patches were scored for each condition.
Rhodamine-phalloidin staining
For actin staining of H2O2 -treated cells, cells were grown to mid-log phase, either left untreated or treated with 2.9 mM H2O2 for 0–60 min, and then fixed and rhodamine-phalloidin stained (Amberg et al., 2005) at indicated time points. For actin staining of GFP-fusion integrants, Abp140p-GFP and Sac6p-GFP integrants (Huh et al., 2003) were grown to mid-log phase in YPD, fixed by the addition of 10% formaldehyde to a final concentration of 4% for 10 min and subjected to rhodamine-phalloidin staining (Amberg et al., 2005). The longer fixation in the protocol was omitted to preserve the fluorescence of the GFP fusion proteins.
For the H2O2 and Lat-B treatment experiments, yeast cultures were diluted from fresh overnight cultures and grown for 3.5 h to approximately 2×10⁷ cells/ml. These cultures were either left untreated or treated with 2.9 mM H2O2 for 1h. Then, 900 μl aliquots of untreated or peroxide-treated cells were removed and treated for 10 min with either 300 μM Latrunculin-B (Sigma-Aldrich) from a 20 mM stock solution in DMSO or an equivalent volume of DMSO. The cells were then fixed in 4% formaldehyde and processed for rhodamine-phalloidin staining as previously described (Amberg et al., 2005).
For quantification of OABs, the epifluorescence images of rhodamine-phalloidin stained cells were acquired using an Orca-ER Hamamatsu camera on a Zeiss Imager.Z1 microscope equipped with a 100X/1.4NA objective and controlled by Axiovision software. The number of fluorescent spots in the mother cell body of 50 small and medium-budded cells were quantified. Mother cells were chosen for quantification because actin cortical patches are least concentrated in the mother cell body at these phases of the cell cycle. This was repeated three independent times, and the averages and standard deviations were calculated for all strains.
For 3D reconstruction of OABs in rhodamine-phalloidin stained cells, single Z-stacks spanning the entire depth of the cells were collected at 0.3 μm intervals on an Ultraview VoX spinning disk confocal system described above. Three-dimensional projections were prepared in Image J and stereo pairs were generated from 9° rotations of the image projections. Mounting fixed cells for microscopy resulted in a slight compression of the mother cell bodies (Figure 1, movies S1A,B) but this did not interfere with distinguishing cortical versus internal structures.
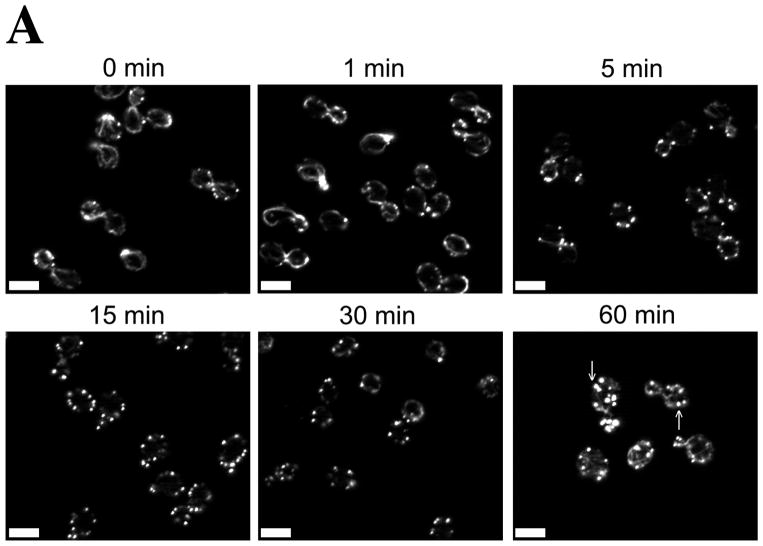
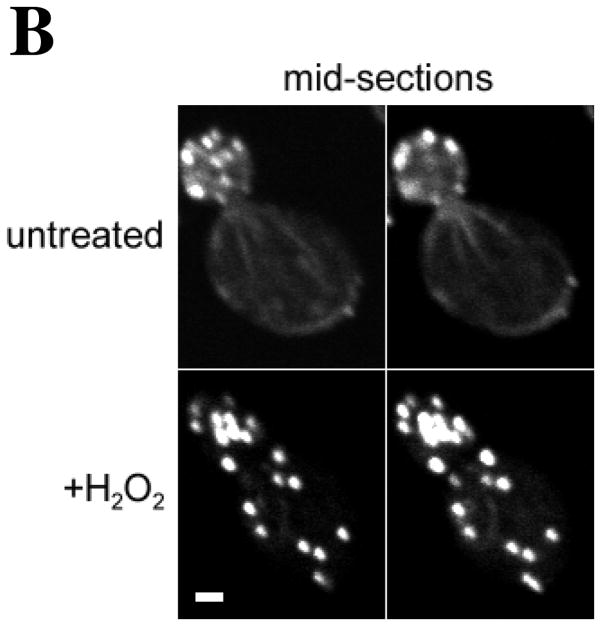
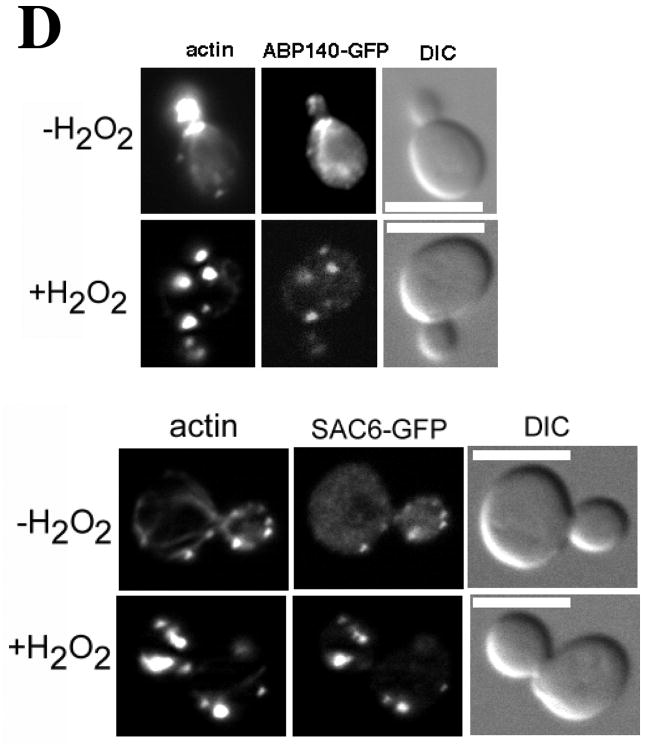
Figure 1. Centrally located Oxidized Actin Bodies (OABs) form rapidly after hydrogen peroxide treatment.
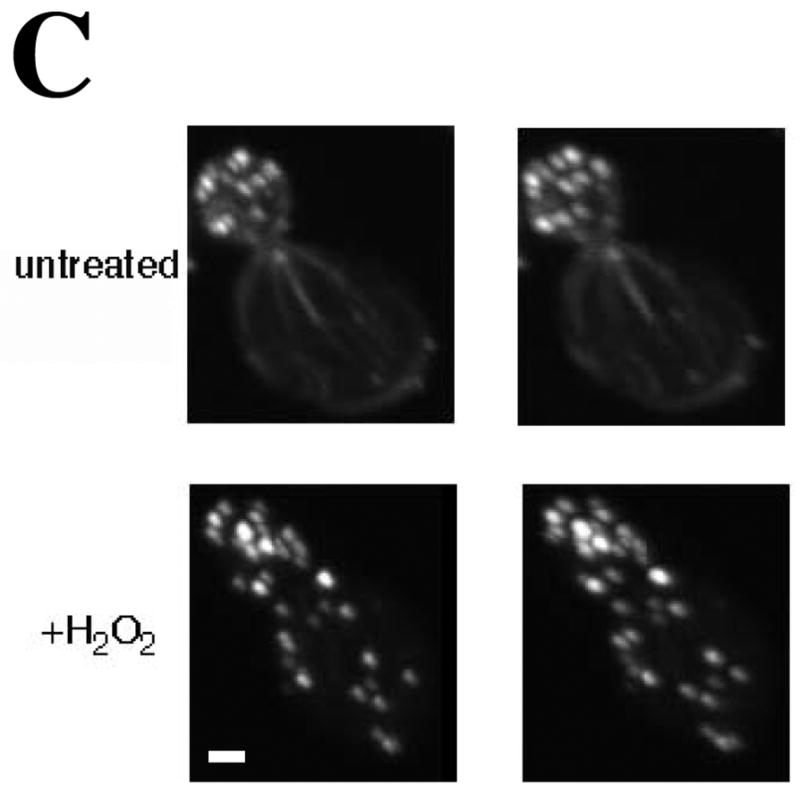
(A) Time course of OAB formation. Cells were treated with 2.9 mM H2O2 and at the indicated times, fixed and stained with rhodamine-phalloidin. Arrows indicate OABs. Scale bars, 5 μm. (B) Central Z-sections 12 (left) and 13 (right) from a total of 25 sections that were collected at 0.3 μm intervals from cells untreated or treated for 1 h with 2.9 mM H2O2. Scale bar, 1 μm. (C) Stereo image pairs of the cells shown in (B) generated from 3D reconstructions made from Z-stacks spanning the entire cell depth. Scale bar, 1 μm. (D) Co-localization of Apb140p and Sac6p with actin in OABs. Cells expressing GFP fusions to Abp140p and Sac6p were treated with 2.9 mM H2O2 for 1 h, fixed for 10 min and stained with rhodamine-phalloidin. Scale bars, 5 μm.
Actin purification and in vitro detection of actin oxidation
The actin cysteine mutant, act1C17,217Ap, was purified as described by Clark et al.(2006) with one main modification: After elution from the DNase I column the protein sample was split and dialyzed overnight in G-buffer (10 mM Tris-Cl pH 7.5, 0.02 mM CaCl2, 0.5 mM ATP) in the presence or the absence of 0.2 mM DTT. 40 μl of 2μM actin (no DTT) was then separated on a non-reducing 8% gel; gels were stained with SYPRO RUBY (Bio-Rad) or Coomassie. Reduced actin samples were prepared by adding β-mercaptoethanol to a final concentration of 50mM to actin dialyzed in the absence of DTT, then analyzed on 8% reducing or non-reducing PAGE gels.
Growth curve collection and analysis
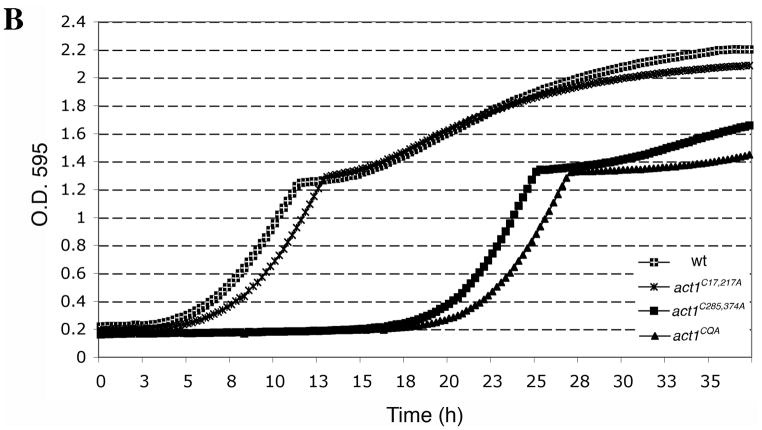
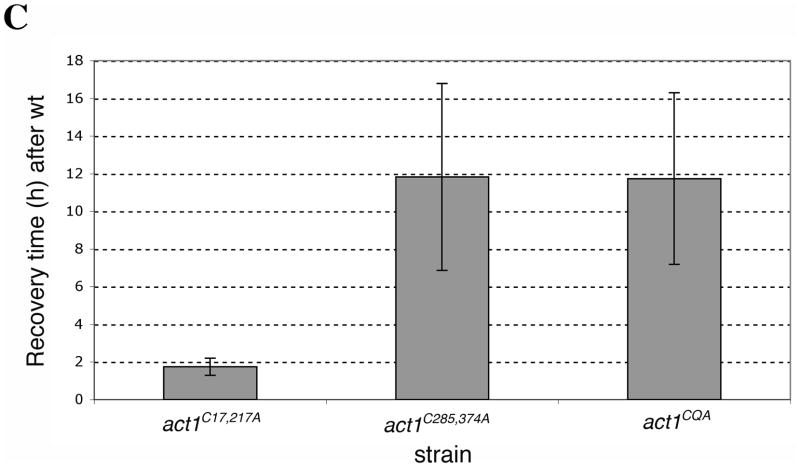
Prior to treatment with H2O2, 2×10⁶ cells/ml were inoculated into 750 μl of YPD medium in Bio-One Cell Star 48 well plates (Greiner Bio-One North America, Inc, Monroe, NC) and grown at 30°C for 3.5 h in a TECAN infinite F200 shaking incubator microplate reader (TECAN, Inc., Mannedorf, Switzerland), taking OD595 readings at 15-min intervals. At 3.5 h (T=0), 24.9μl of 88 mM H2O2 in YPD was added to the 750 μl cultures in each well and optical readings were collected every 15 min for approximately 37 h. This experiment was repeated at least three times. Figure 6B shows a representative curve for untreated and treated cells. The recovery time (T1/2) was calculated as the time it took for each strain to reach half of the OD595 reading at diauxic shift (calculated by obtaining the OD595 reading at the diauxic shift, subtracting the OD595 at T=0, dividing by 2 and measuring the corresponding time it took for that strain to reach this OD595 from the growth curve. To show the difference of recovery times between mutant and wild type strains (Figure 6C) the recovery time of the wild type sample was subtracted from the recovery times of mutants. The results of six different data sets were averaged for the act1C17,217A strain and for three different data sets for all other strains. The results are displayed as the mean ± the standard deviation for each data set.
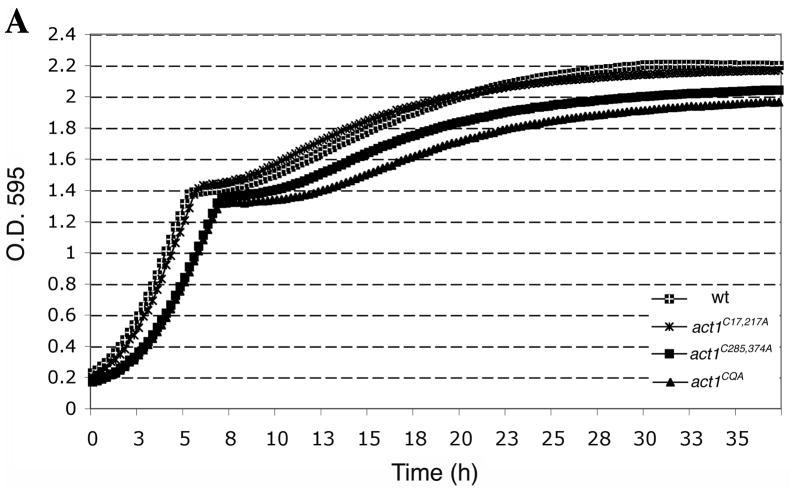
Figure 6. Actin cysteines are required for efficient recovery from oxidative stress.
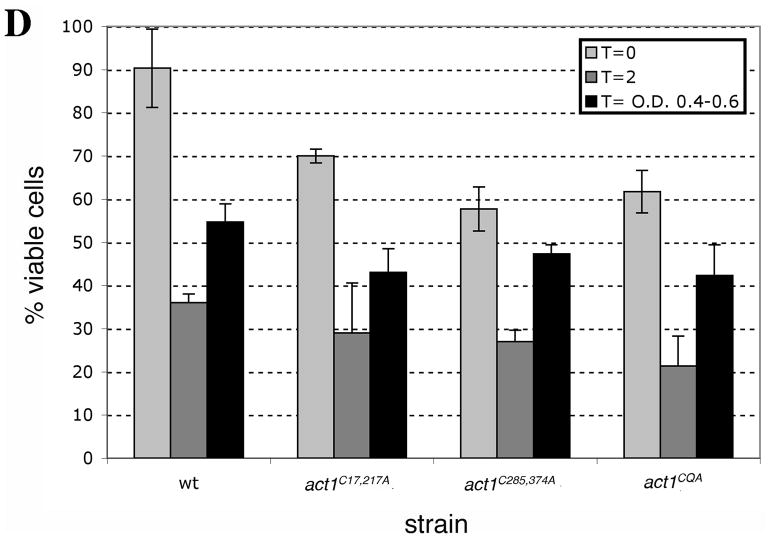
Representative growth curves monitored by OD595 for wild type and mutant cells grown in (A) YPD and (B) YPD plus 2.9 mM H2O2. Untreated and treated cultures were seeded from starter cultures after an initial 3.5 h of logarithmic growth in YPD. Cultures were incubated and monitored in a TECAN Infinite F200. (C) Comparison of the recovery time for actin cysteine mutants. The recovery time was measured as the time interval from starting the culture (t=0) till the time each culture reached half of the OD595 reading at the diauxic shift. To illustrate the delay in recovery of mutants, bars in the graph show the recovery times subtracted for the recovery time observed for wild type cells. Values represent averages ± S.D. from at least three different experiments. (D) Comparison of the percent of cell viability for wild type and mutant strains before addition of 2.9 mM H2O2 (T=0, light gray), 2 h post-H2O2 addition (dark gray) and at a time point between OD 595 0.4–0.6 after recovery (black). Values are means ± S.D.
Viability assays
As described for growth curve collection, cells were grown and treated in 2.9 mM H2O2 and the viabilities of all strains were calculated immediately before (T=0) and 2h after (T=2) H2O2 addition and at a time-point where cell growth had reached a point between 0.4 and 0.6 OD595 units. Cell viability was calculated by diluting cultures and plating on YPD to determine the number of colony forming units and total cell density was determined by direct microscopic count. Cell viability was calculated as: (the number of colony forming units/total number of cells) x100. The experiment was performed at least three times for all yeast strains and results are shown as the average of the data obtained from each experiment. Standard deviations are shown on all graphs. For viability assays utilizing N-acetylcysteine, cells were treated with 31 mM N-acetylcysteine for 5.5 h while growing logarithmically in liquid YPD. Dilutions were made and cells were plated onto YPD agar.
LC/MS/MS Analysis
Liquid chromatography (LC) in line with tandem mass spectrometry (MS/MS) was performed using a Surveyor high-performance liquid chromatography system connected through a PepFinder kit (with peptide trap and 99:1 flow splitter) to a LCQ DECA XP ion trap mass spectrometer with a nanospray ionization source (Thermo Electron, San Jose, CA). Prior to mass spectrometry analysis, a protein separated by SDS-PAGE was digested by trypsin. In-gel tryptic digestion was performed using a commercial kit (Pierce) according to the manufacturer’s protocol. The peptides of the digested protein (10 μl) were separated by reverse-phase chromatography on a Pico-Frit BioBasic C18 column (New Objectives, 0.075 mm ID) at 0.7 μl/min flow rate. 0.1% formic acid in water and in acetonitrile was used as buffer A and B, respectively. The gradient was started and kept for 10 min at 0% B, then ramped to 60% B in 60 min, and finally ramped to 90% B in 15 min. Data-dependent analysis was performed to acquire MS and MS/MS spectra of eluted peptides. Each acquired MS/MS spectrum was searched against the NCBI non-redundant protein sequence database “nr.fasta” (March, 2008) using SEQUEST software within the BioWorks 3.3 software package (Thermo Electron). The database search was restricted to 700–3500 molecular mass tryptic peptides of yeast (S. cerevisiae) origin. Up to two missed trypsin cleavage sites were allowed with differential modification of cysteine residues. The peptide identification criteria were as follows: Xcorr score of at least 1.9, 2.5 and 3.0 for singly, doubly, and triply charged peptides, respectively; dCn score of at least 0.1; and the probability of a false positive match of 0.005 or less. The MS/MS spectra acquired for the singly and doubly charged peptides with MH+=972.4 (m/z=972.42) and M2H+=973.4 (m/z=486.7), respectively, were manually compared to the predicted MS/MS spectrum.
Results
Oxidized Actin Bodies (OABs) are filamentous actin cytoskeletal structures that form within minutes of acute oxidative stress
In yeast, filamentous actin is found in actin cortical patches and actin cables (Amberg, 1998). We observed that upon hydrogen peroxide induced oxidative stress, the actin cytoskeleton rearranges into depolarized filamentous structures that appear to be larger than actin patches (Figure 1). We termed these filamentous, actin-containing structures Oxidized Actin Bodies (OABs). OABs were detected as early as 5 minutes after exposure to hydrogen peroxide, and increased in size and number throughout the first hour of treatment (Figure 1A). To compare the relative proximity of OABs to the cell surface, we collected Z-stacks spanning the entire depth of the cells that were either treated with 2.9 mM H2O2 for 1 h or left untreated. In the central sections through the middle of the cells (Figure 1B), in contrast to actin patches in untreated cells, OABs were frequently located in the interior of the cell and were not purely cortical in nature. These findings can best be appreciated by observing stereo images (Figure 1C) and rotations of three-dimensional reconstructions of untreated and H2O2-treated cells (supplemental Video S1A and S1B).
To determine the origin of OABs, we examined effects of peroxide treatment on localization of several GFP-labeled markers of actin patches and actin cables in cells stained with rhodamine-phalloidin after a short 10 min formaldehyde fixation step designed to preserve GFP fluorescence. Abp140p is a non-essential protein that localizes to both actin cortical patches and actin cables (Asakura T, 1998) and is routinely used to examine dynamics of actin cables (Yang and Pon, 2002). In our hands, Abp140p-GFP localized predominantly with actin patches and to a lesser degree with actin cables (Figure 1D). Upon peroxide treatment, cables completely disappeared and Abp140p-GFP co-localized with OABs. Four GFP-tagged actin patch markers including the endocytic adaptor Pan1p, the Arp2 subunit of the Arp2/3 complex, the Arp2/3 complex activator Abp1p (Wendland and Emr, 1998; Goode et al., 2001), and yeast fimbrin Sac6p (Adams et al., 1991) all localized to cortical actin patches in untreated cells and co-localized with OABs after peroxide treatment (Figure 1D and our unpublished observations). The localization of actin patch components in OABs suggests that OABs might form from pre-existing actin patches.
OABs resist LatB-induced actin disassembly
In order to test for the stability of oxidized actin bodies, we added the actin monomer-binding and sequestering drug, Latrunculin-B (LAT-B) to cultures of cells that had formed OABs. LAT-B, similar to LAT-A, induces disassembly of in vivo dynamic actin networks by monomer sequestration (Spector et al., 1983; Morton et al., 2000). We observed that upon Lat-B treatment F-actin persisted within OABs in cells that were pre-treated with H2O2, whereas actin filamentous structures completely disappeared from control cells that were not treated with H2O2 (Figure 2). However, LAT-B treatment reduced the size and intensity of OABs, suggesting the presence of a less dynamic F-actin core within OABs. We hypothesize that OABs may serve a protective role by sequestering actin and its associated proteins from further attack by ROS and preventing continued polarized growth until the cells have recovered from the oxidative stress.
Figure 2. Actin filaments within OABs are stable.
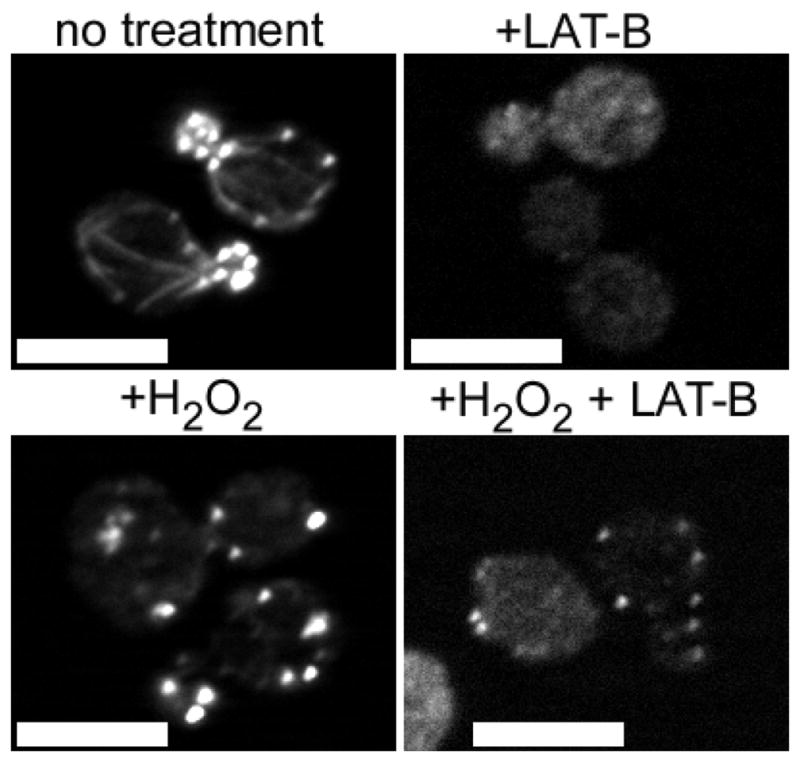
Wild type cells were untreated (top) or treated with 2.9 mM H2O2 for 1 h (bottom) and then treated with 300 μM LAT-B (right) or an equivalent volume of DMSO (left) for 10 min. Cells were then fixed and processed for rhodamine-phalloidin staining. Scale bars, 5 μm.
OABs are stable structures that form from cortical actin patches
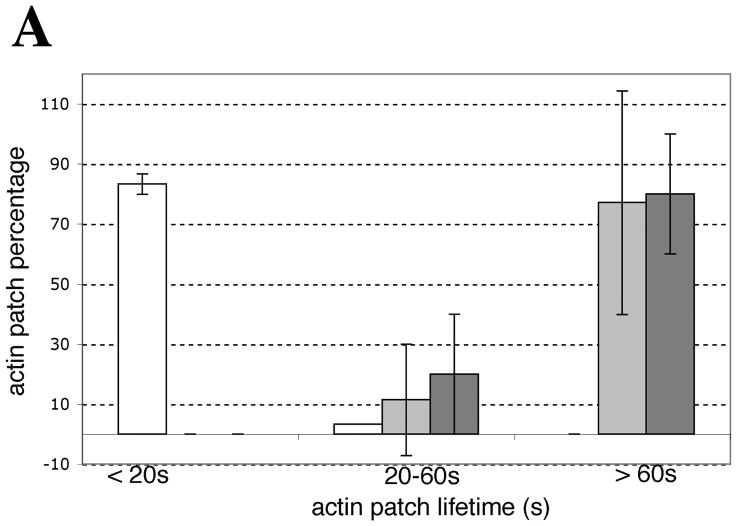
We utilized a Sac6p-GFP expressing strain to monitor how actin patch lifetime and movements differed from OABs in living cells imaged on a spinning disk confocal microscope. Sac6-GFP-expressing cells were either treated with H2O2 or left untreated. We also compared H2O2 treatment that took place directly on a gelatin-containing pad versus treatment with H2O2 in culture. Actin patches move rapidly at speeds of up to 1 μm/s (Doyle and Botstein, 1996; Young et al., 2004) and exhibit motions over both short and long distances within the cell (Waddle et al., 1996). Furthermore, actin cortical patches have been shown to have lifetimes between 10–20 s (Carlsson et al., 2002). In agreement with these data, we found that over 80% of actin patches in untreated cells have a lifetime of less than 20 s in 1-min time-lapse movies (Figure 3A). In contrast, ~80% of actin patches/OABs of cells that had been treated with H2O2, either in culture or directly on the gelatin pad, had a lifetime of greater than 60 s, with a smaller fraction of actin patches that had lifetimes of 20–60 s and no patches with lifetimes of less than 20 s. This indicated that H2O2 dramatically slowed the dynamics of actin patches. The same actin patches/OABs that were quantified for lifetime were also scored for movement (Table 4). Consistent with actin patch lifetime data, 80.6 % of the cortical patches of untreated cells showed some inward movement within the time frame that they were visible, whereas only 3% and 20% of patches/OABs in gelatin and in-culture-treated cells, respectively, showed any movement within the time frames that they were visible. Videos S2A (untreated) and S2B (H2O2-treated) show Sac6p-GFP movements over the course of one minute.
Figure 3. In contrast to actin cortical patches, OABs are large, immobile and long-lived structures.
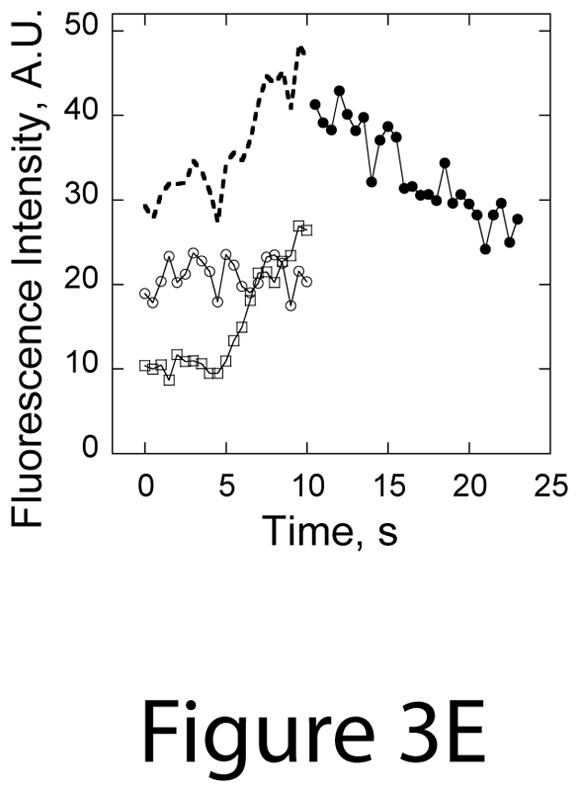
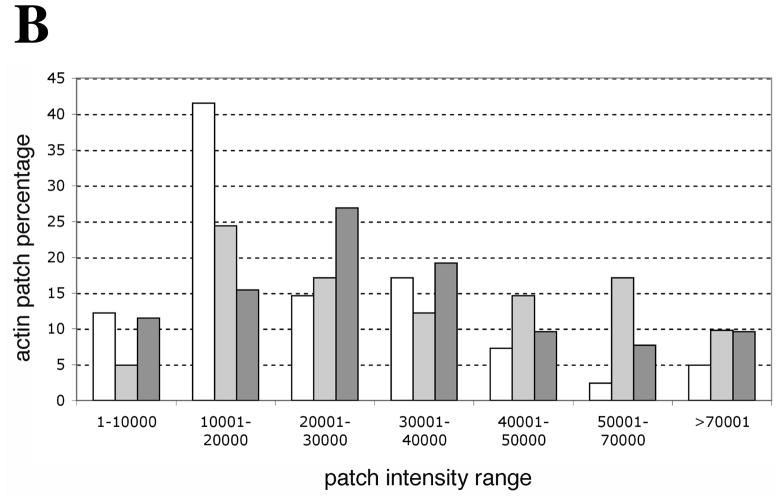
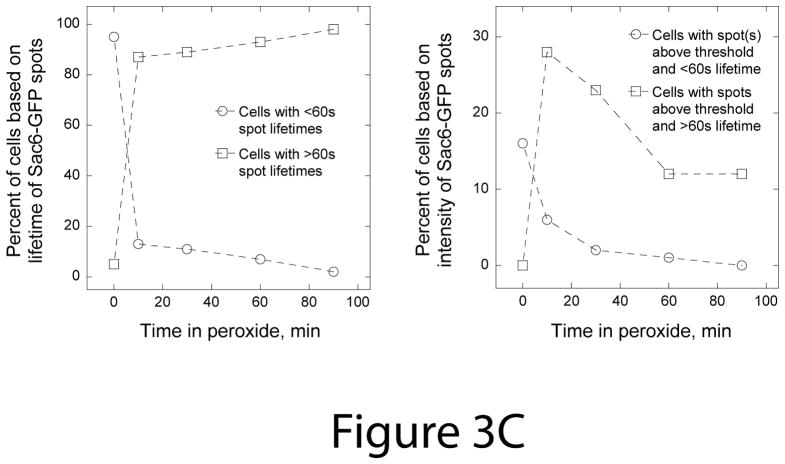
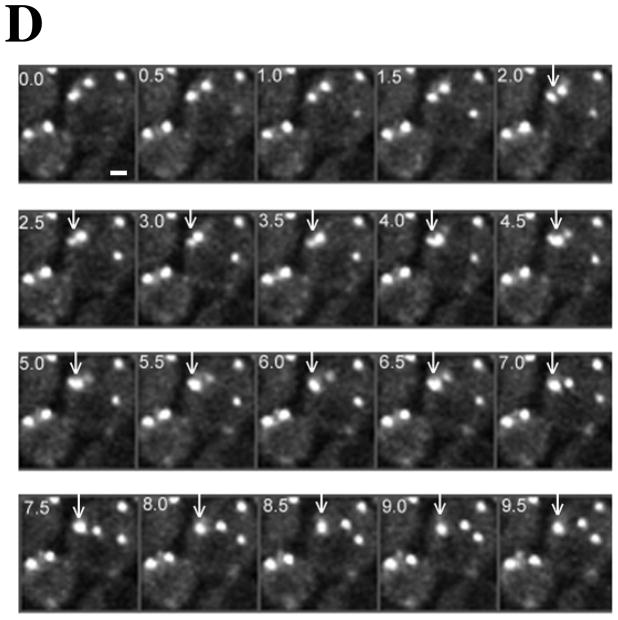
Comparison of (A) lifetimes and (B) fluorescence intensities of Sac6p-GFP in patches in untreated cells (white bars) or in OABs in cells that were treated with 2.9 mM H2O2 directly on a gelatin pad for 5–15 min (light gray bars) or in culture for 30 min (dark grey bars). Patch lifetimes and fluorescence intensities were measured from images obtained every 0.5 s for 60 s in a single confocal section through the middle of the cells. Values were binned as indicated; A.U., arbitrary units. (C) Plots of percent of cells with Sac6-GFP spots with >60 s and <60s lifetimes (plot on the left) and percent of cells with Sac6-GFP spots with intensities over threshold and >60 s and <60s lifetimes (plot on the right) in untreated cells and after the addition of 2.9 mM H2O2. (D) Montage of spinning disk confocal images collected every 0.5 s in a single section through the middle of an H2O2-treated cell expressing Sac6p-GFP. Arrows point out an example of the fusion of actin patches into a larger OAB. Note that the majority of Sac6p-GFP structures remain stable and exhibit limited motion over the course of the 9.5 s. Scale bar, 1 μm. (E) Plot of Sac6-GFP fluorescence intensities during the OAB fusion event shown in Panel C. The open squares and open circles represent intensities of the two patches prior to fusion at the 10 second mark, the dashed line shows the sum of patch intensities prior to fusion, and the closed circles represent intensities of the OAB subsequent to fusion.
Table 4.
Quantification of actin patch/OAB movements.
| % That Moved | % That did not move | |
|---|---|---|
| Untreated | 80%+/−6% | 19%+/−6% |
| Treated on gelatin pads | 3%+/−6% | 97+/−6% |
| Treated in liquid culture | 20%+/−20% | 80%+/−20% |
Actin patches of cells that were untreated, treated with 2.9 mM H2O2 on a gelatin pad, or treated in culture with 2.9 mM H2O2 were scored according to whether or not a given patch moved during observation.
Percentages are shown along with standard deviations.
We also compared the sizes of OABs to actin patches by measuring the relative fluorescence intensities of Sac6-GFP-labelled OABs in peroxide-treated cells versus Sac6-GFP-labelled actin patches in untreated cells. As seen in Figure 3B, over 50% of the patches of untreated cells had intensities under 20,000 (arbitrary) intensity units and only 15% had intensities above 40,000 units. In contrast, the distribution of patch/OAB intensities changed upon H2O2 treatment on gelatin pads such that 29% of patches/OABs were below 20,000 and 41% displayed a patch intensity distribution of over 40,000 units. Comparable to H2O2 treatment on gelatin pads, 27% of in-culture treated cells showed an intensity distribution under 20,000 with 27% showing an intensity distribution of over 40,000. These results suggest that H2O2 treatment blocks actin patch dynamics and that the arrested patches may grow in intensity, forming OABs by continued F-actin assembly on free ends.
We used lifetimes and intensities of Sac6-GFP spots to monitor the time course of OAB formation in response to the addition of 2.9 mM peroxide (Figure 3C). We measured the percent of cells that contained at least one Sac6-GFP structure with greater than 60 second lifetime and the percent of cells that contained at least one Sac6-GFP structure with intensity above a threshold value set higher than the maximum intensities of well-separated Sac6-GFP patches. Before H2O2 addition, only 5% of cells had Sac6-GFP patches with apparent lifetimes greater than 60 s and 16% of cells had Sac6-GFP spots with intensities above the threshold but all of these spots disappeared in less than 60 s. These structures in untreated cells likely represent closely adjacent patches. In contrast, 10 minutes after H2O2 addition 87% of cells had at least one Sac6-GFP spot with a lifetime over 60 s and 28% of cells had Sac6-GFP spots with intensities above threshold and lifetimes over 60 s. At later time points, the percent of cells containing Sac6-GFP spots with greater than 60 s lifetimes gradually increased to over 95% while the percent of cells containing stable Sac6-GFP spots with intensities over threshold decreased to 12 % 60–90 minutes after H2O2 addition. Once formed, some of the OABs persisted for longer than 10 minutes (Supplemental Video S3).
In time-lapse movies of peroxide treated cells, we captured several fusion events where two arrested patches fused to form less mobile OABs (see the montage in Figure 3D and Supplemental Video S4). We quantified the fluorescence signal over time for the patch fusion event indicated in Figure 3D with arrows and plotted this data in Figure 3E. As can be seen, the fluorescence intensity following fusion (closed circles) is approximately that expected from the sum (dashed line) of fluorescence intensities for the two patches prior to fusion (open circles and open squares). This suggests that patch fusion events may contribute to the formation and enlargement of OABs, a process that may be facilitated by continued F-actin assembly on free ends within the OABs and stabilized through association with actin-binding proteins such as Sac6p (fimbrin) and the Arp2/3 complex.
Actin cysteines 285 and 374 contribute to the formation of oxidized actin bodies (OABs)
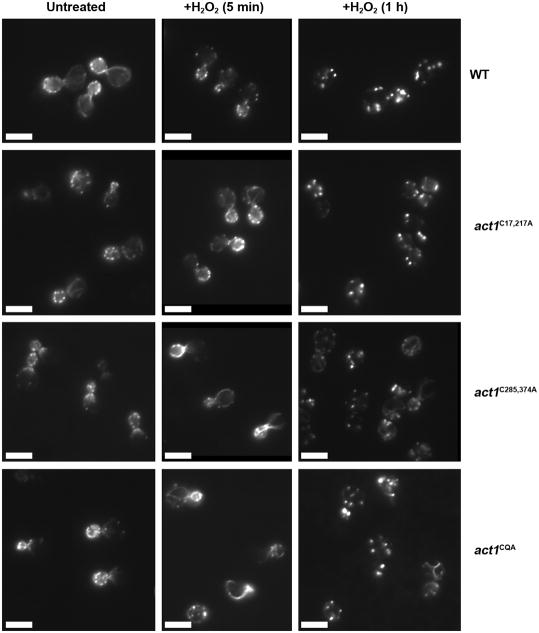
To test whether actin cysteines are involved in the formation of OABs, we stained peroxide treated wild type or act1C17,217A, act1C285,374A and act1C17,217,285,374A (also referred to as the quadruple actin cysteine mutant, act1CQA) mutant cells with rhodamine-phalloidin. We found that upon peroxide treatment the wild type cells and the act1C17,217A mutant formed OABs, but that the act1C285,374A and act1CQA mutants were partially impaired in their ability to form OABs (Figure 4). By rhodamine-phalloidin staining, OABs in act1C285,374A and act1CQA mutants appeared dimmer and less numerous than in wild type cells.
Figure 4. Actin cysteines 285 and 374 contribute to OAB formation.
Cells were treated with 2.9 mM H2O2 for 5 min or 1 h as indicated, fixed, rhodamine-phalloidin stained and examined by fluorescence microscopy. Representative cells from untreated vs. treated cultures are shown for wild type and the indicated cysteine-to-alanine mutants. Scale bars, 5 μm.
Addition of peroxide also caused depolarization of actin structures in wild type cells. In order to quantify these observations, we counted the number of patches or OABs in 100 mother cells at the small and medium-bud stages (N=3). Wild type mother cells contained 1.3 ± 0.2 spots before peroxide treatment but accumulated 4.1 ± 1.0 spots after a 1 h H2O2 treatment. Similarly, the act1C17,217A mother cells had 1.4 (+/− 0.4) spots before treatment and 4.5 +/− 0.4 spots after a 1 h H2O2 treatment. In contrast, in the act1C285,374A mutant the number of spots remained unchanged after peroxide treatment. The untreated act1C285,374A mother cells contained 1.8 ± 0.3 actin spots, probably due to a slight depolarization of actin in this mutant After 1 h H2O2 treatment the act1C285,374A mother cells had 2.1 ± 0.5 spots, similar to untreated cells.
Interestingly, we found that H2O2 caused elongation and stabilization of the characteristically short actin cables that are associated with actins carrying the C374A mutation. This was evident as early as 5 min after H2O2 addition, at which point most actin filaments in wild type and act1C17,217A cells had disappeared (Figure 4). Thus, the persistence of filamentous actin structures and the reduced formation of OABs suggest that C285 and C374 of actin contribute to the generation and maturation of OABs.
Actin can spontaneously oxidize on C285 and C374 in vitro
To determine if actin cysteines can become disulfide-bonded in vitro either intra- or inter-molecularly, we removed the dithiothreitol from a solution of purified act1 C17,217Ap mutant actin by dialysis. The resulting actin largely ran as a doublet on non-reducing gels, but when the reducing agent β-mercaptoethanol was added, the doublet disappeared and the actin ran as a single, slower migrating band (Figure 5A). This indicated that actin can be spontaneously oxidized in the absence of DTT.
Figure 5. Actin can spontaneously oxidize on C285 and C374 residues in vitro.

(A) act1C17,217Ap under non-reducing conditions (lane 1) runs as a doublet at ~42 KDa, whereas under reducing conditions (β-mercaptoethanol addition; lane 2) it runs as a single band that co-migrates with the upper band in the non-reducing sample. (B) Visualization of act1C17,217Ap separated on an 8% gel under non-reducing conditions shows higher molecular weight oligomers that indicate the formation of intermolecular disulfide bonds (see arrows) involving cysteine 285 and/or cysteine 374. The open arrowhead indicates intra-molecularly disulfide-bonded actin that was observed under these conditions.
Using mass spectrometry analysis, we tested if the faster migrating band of oxidized actin in fact contained a C285-C374 intra-molecular disulfide bond, similar to that found in the oxidized actin of irreversibly sickled red blood cells (Bencsath et al., 1996). Upon complete digestion with trypsin, actin generates the set of tryptic peptides including C285DVDVR and C-terminal C374F. A disulfide bond between C285 and C374 would result in a C285(F) - C374DVDVR peptide instead of two separate peptides. The C285(F) - C374DVDVR peptide may form singly charged molecular ions with MH+= 972.42 (m/z=972.42) and doubly charged ions with M2H+= 973.42 (m/z=486.71). None of the unmodified tryptic peptides of actin have similar (± 4 amu) masses. The standard MS/MS spectrum predicted for C#DVDVR peptide, where C# is a cysteine 285 modified with a C374F peptide through a disulfide bond, consists of the following fragment ions of b and y series: b1 (C#, MH+=370.11), b2 (C#D, MH+=485.14, b3 (C#DV, MH+=584.21), b4 (C#DVD, MH+=699.24), b5 (C#DVDV, MH+=798.31), y1 (R, MH+=175.11), y2 (VR, MH+= 274.18), y3 (DVR, MH+= 389.21), y4 (VDVR, MH+= 488.28), and y5 (DVDVR, MH+= 603.31). In addition, fragmentation at the C374-F peptide bond may produce the fragment ions C-CDVDVR (MH+=807.34) and F (MH+=166.08), and fragmentation at the C285-C374 disulfide bond may produce the fragment ions CF (MH+=267.09) and CDVDVR (MH+=706.32). LC/MS/MS analysis of the tryptic digest of the oxidized actin band confirmed that the analyzed protein was actin (sequence coverage over 60%). The analyzed tryptic peptides included molecular ions with m/z=972.42 ± 0.2 and m/z=486.71±0.2 corresponding to singly (MH+) and doubly (M2H+) charged peptides; the peptides were eluted from the RP column and analyzed by the mass spectrometer for over 30 sec between 27 and 28 minutes. The MS/MS spectra acquired for these two ions included all fragment ions predicted for the C285(F) - C374DVDVR peptide, except the b1 ion. The result strongly suggested the presence of C285(F) - C374DVDVR peptide in the tryptic digest of oxidized actin and, thus, the presence of disulfide bond between C285 and C374 of oxidized actin.
We observed that higher molecular weight dimers and fainter multimers spontaneously form from act1C17,217Ap upon removal of DTT (see arrows, Figure 5B), suggesting that actin’s C285 and/or C374 can participate in the formation of intermolecular disulfide bonds as well resulting in higher order oligomers. Similarly, both higher and lower molecular weight bands were observed for non-reduced wild-type actin and act1C285,374Ap actins, but not for act1CQAp actin (Figure S1). These results support the notion that actin cysteines could play an important role in the formation of disulfide-bond-stabilized higher-order structures.
Actin cysteines 285 and 374 are required for rapid recovery from oxidative stress
In order to assess the sensitivity of the actin cysteine mutants to oxidative stress, we grew mutant and control strains in YPD, added H2O2 at T=0 and monitored growth recovery over a period of 37 h. While the untreated strains had very similar growth rates (Figure 6A), upon addition of H2O2 the strains manifested distinct differences between times of growth rate recovery (Figure 6B). We quantified different data sets and represented the T1/2 mean for all of these strains, defined as the time it took for all strains to reach 50% of the OD595 at the point of the diauxic shift (Figure 6C). That the diauxic shift is the point at which yeast have consumed most of the glucose via fermentative growth and continue growing more slowly through aerobic respiratory growth on ethanol, a byproduct of glucose fermentation. For all strains, H2O2 treatment caused a lag phase where cell growth was halted and then resumed at a later time. To test whether it was necessary to maintain H2O2 throughout the length of the experiment, we washed out the H2O2 after 1 h of incubation. We found that washed cells showed a shorter lag time (approximately 5 h faster recovery time) than those cells continuously exposed to hydrogen peroxide throughout the length of the experiment, arguing for the persistence of H2O2 in the medium (our unpublished observations). The act1C285,374A double mutant strain, as compared to wild type, possessed a particularly long lag time (~14 h) from the point of H2O2 addition (T=0) until the point of recovery under conditions in which H2O2 remained in the medium. Furthermore, the recovery of the act1C285,374A double mutant strain was significantly delayed compared to that of the act1C285A single mutant strain (data not shown). The observation that the act1C285,374A mutant strain exhibited a longer delay than the act1C285A mutant strain suggests that both cysteines have roles in facilitating recovery from oxidative stress. Interestingly, the act1C17,217A mutant showed a growth recovery delay that was only 2 h longer than observed for wild type, indicating that actin’s cysteines 17 and 217 play a minor role in the growth response to H2O2.
All mutants had similar slopes of growth during the growth recovery period between OD595 0.4–0.6 (data not shown), suggesting that growth rate differences could not account for the differences between these strains. We reasoned that the mechanism governing growth recovery at early time points, between OD595 0.4–0.6, could be described by either a delay in the resumption of growth or a loss of viability upon H2O2 addition and throughout the recovery phase. Because all cells lost a comparable percentage of viable cells post-H2O2 addition (Figure 6D), loss of viability does not explain the differences in the longer recovery times of the act1C285,374A and act1CQA cultures. In contrast, the data favor a hypothesis that the observed longer recovery times reflect the time it takes for the remaining viable cells to re-enter the cell cycle.
Actin cysteines may help to protect against cellular ROS
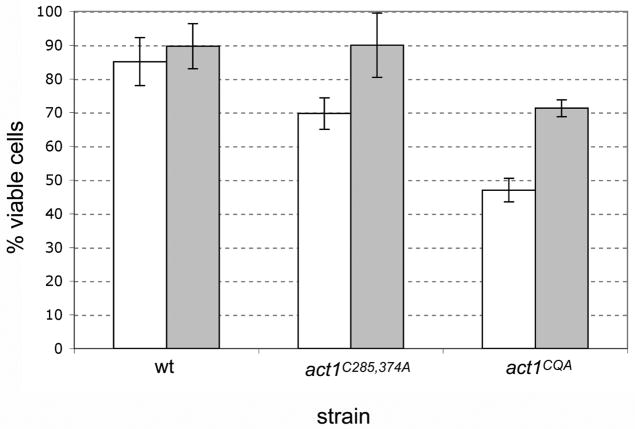
We asked whether the lower viabilities observed in the act1C285,374A and act1CQA mutant strains in the absence of H2O2 might be attributable to an antioxidant imbalance within the cell. To address this question, we grew the act1C285,374A and act1CQA mutants in YPD media with or without the antioxidant N-acetylcysteine (NAC) and determined the percentages of viable cells. In the presence of NAC, the viability of the act1C285,374A strain increased from 70% to 90% while the act1CQA strain’s viability increased from 48% to 71% (Figure 7). These findings are consistent with the possibility that actin cysteines 285 and 374 help to detoxify some of the cellular ROS load. In combination with the observation that the mutants are extremely sensitive to exogenous oxidative stress (Figure 6), these data support our model that these cysteines may help control intracellular ROS levels under normal physiological circumstances and that impairment of this function leads to reductions in cell viability.
Figure 7. Actin cysteines C285 and C374 act as a protective ROS buffer.
Logarithmically growing cells were grown in the absence (white bars) or presence (gray bars) of N-acetylcysteine for 5.5 h, cells were serially diluted, plated and cell viability was determined based on colony-forming units/total number of cells (n=3).
Discussion
The actin cytoskeleton is highly responsive to diverse internal and external signals. For example, actin reorganization occurs in yeast upon the sensing of mating pheromone (Read et al., 1992), and the application of hyperosmotic (Chowdhury et al., 1992; Yuzyuk et al., 2002), heat (Lillie and Brown, 1994; Delley and Hall, 1999), or oxidative stresses. Typically, environmental stress induces a rapid disassembly/depolarization of the actin cytoskeleton, followed by an adaptive phase that is required for subsequent re-assembly of a polarized cytoskeleton and resumption of polarized growth. Similar observations, in particular for oxidative stress, have been made in mammalian systems (Hinshaw et al., 1991; Zhu et al., 2005).
As described here, the response of the actin cytoskeleton to a fairly severe external oxidative stress (2.9 mM H2O2) differs from the response to either osmotic or heat stress in that a unique structure is formed (the oxidized actin bodies) and the adaptation phase is much more prolonged. Furthermore, hyperosmotic and heat stress require the presence of MAP kinase cascades to transmit stress signals to actin (Beck et al., 2001). In contrast, activation of a MAPK cascade has not been shown to be required for the depolarization of actin upon the addition of hydrogen peroxide (Vilella et al., 2005). Our results suggest that actin reorganization in response to oxidative stress is in part regulated intrinsically via the oxidation of actin cysteine residues. Similar F-actin containing structures have been described in stationary phase yeast cells (Sagot et al., 2006) and ROS have been shown to accumulate in yeast cells grown to stationary phase (Laun et al., 2001; Gourlay and Ayscough, 2005). However, we and others have shown that actin cysteines are dispensable for the formation of these stationary phase actin bodies (our unpublished data and Isabelle Sagot, personal communication). Although OABs and stationary phase actin bodies are superficially similar in appearance, the mechanisms and regulation of their formation are likely quite different.
Since actin organization and function is tightly regulated by the association of actin binding proteins, a key question is how these associated proteins behave during oxidative stress. In vitro studies have indicated that actin oxidation generally inhibits the association of actin binding proteins with actin. For example, filaments formed from G-actin treated with H2O2 are unable to bind to filament cross-linking proteins such as filamin and α-actinin (DalleDonne et al., 1995) and are unable to bind the small actin regulatory factor profilin (Lassing et al., 2007). In contrast, previous in vivo studies (Zhu et al., 2005), as well as results presented here, suggest that oxidative stress can maintain, and may enhance, interactions of some actin binding proteins (ABPs) with F-actin. The actin binding proteins that remain associated with OABs include the actin cross-linking proteins Abp140p and Sac6p (see Figure 1), the Arp2/3 activators Abp1p and Pan1p, and the Arp2p subunit of the Arp2/3 complex (our unpublished observations). Because many of these proteins participate in the regulation of Arp2/3 complex-dependent actin assembly within cortical actin patches, their presence in OABs suggests that the OABs may be derived from actin patches, thus implicating the Arp2/3 complex in the regulation of actin nucleation within OABs. This hypothesis is consistent with our time-lapse experiments showing that patch fusion events participate in OAB elaboration (see Figure 3D). In contrast, neither the formin Bni1p nor its activator Aip3p/Bud6p are found within OABs, suggesting that formin-mediated actin nucleation is not involved in OAB formation (our unpublished observations). We are currently unsure of the functional importance of ABP association with OABs. It could merely be the consequence of a high density of binding sites for actin binding proteins. Alternatively, OABs may function to protect actin-binding proteins from oxidative damage or as a ready reserve of precursors for the rapid reassembly of cytoskeletal structures during the recovery phase.
Although OABs may in part form from the fusion of cortical patches, our live cell time-lapse experiments tracking the behavior of GFP-Sac6p clearly showed that OABs display distinctly different behaviors than actin cortical patches. First, three-dimensional analysis by optical sectioning shows that OABs are frequently located in the interior of the cell as opposed to the cell cortex. Second, OABs are persistent, stable structures. Many of the OABs do not show significant amounts of movement and certainly not the kind of rapid and directed movement (inward from the cortex) that cortical patches display during endocytic internalization (Waddle et al., 1996; Carlsson et al., 2002). Furthermore, OABs appear to be larger than cortical patches and their greater staining with rhodamine-phalloidin or with Sac6-GFP indicates they contain a higher amount of F-actin than cortical patches. Lastly, the OABs appear to be more resistant to LatB-induced disassembly than cortical patches, although LatB does appear to reduce the size and intensity of the OABs. This suggests that OABs contain a stable core, possibly formed from cross-linked actin filaments, and that this core acts as a “super-nucleation center” that generates a peripheral halo of F-actin capable of disassembly and turnover. Collectively these results support our hypothesis that OABs are performing a protective function by sequestering actin cytoskeletal components and thereby preventing continued growth and endocytosis during severe oxidative stress. We have noted that diamide and menadione also cause the formation of actin-containing OAB-like structures with a time course similar to that seen with H2O2 treatment (see Figure S2), leading us to believe that OABs are a general protective response to wide-ranging forms of oxidative stress.
Our observations support a central role of the actin cytoskeleton in the protection of cells from oxidative stress and the regulation of the oxidative stress response. In wild type cells growing aerobically, the modest amounts of ROS that are produced can lead to actin oxidation, contributing to the maintenance of low levels of cellular ROS. Under conditions of acute oxidative stress, actin appears to play an important role in sensing and protecting against ROS. Actin and its accessory proteins are sequestered into oxidized actin bodies that we propose play several protective roles, including: 1) To protect actin and its associated proteins from further oxidative damage, 2) To prevent continued growth and endocytosis until the cells have recovered, and 3) To provide a ready source of cytoskeletal precursors for the re-assembly of the actin cytoskeleton during the recovery phase.
Supplementary Material
Acknowledgments
We thank Patty Kane and Ying Huang for helpful discussions and ideas. We are thankful to all members of the Amberg laboratory, in particular Brian Haarer, for helpful input. This research was supported by National Institutes of Health Grant GM-56189.
References
- Adams AE, Botstein D, Drubin DG. Requirement of yeast fimbrin for actin organization and morphogenesis in vivo. Nature. 1991;354:404–408. doi: 10.1038/354404a0. [DOI] [PubMed] [Google Scholar]
- Amberg DC. Three-dimensional imaging of the yeast actin cytoskeleton through the budding cell cycle. Molecular biology of the cell. 1998;9:3259–3262. doi: 10.1091/mbc.9.12.3259. [DOI] [PMC free article] [PubMed] [Google Scholar]
- Amberg DC, Botstein D, Beasley EM. Precise gene disruption in Saccharomyces cerevisiae by double fusion polymerase chain reaction. Yeast (Chichester, England) 1995;11:1275–1280. doi: 10.1002/yea.320111307. [DOI] [PubMed] [Google Scholar]
- Amberg DC, Burke DJ, Strathern JN. Methods in Yeast Genetics: A Cold Spring Harbor Laboratory Course Manual. Cold Spring Harbor Laboratory Press; Cold Spring Harbor: 2005. [Google Scholar]
- Asakura TST, Nagano F, Satoh H, Obaishi H, Nishioka H, Imamura H, Hotta K, Tanaka K, Nakanishi H, Takai Y. Isolation and Characterization of a novel actin filament-binding protein from Sacchharomyces cerevisiae. Oncogene. 1998;16:121–130. doi: 10.1038/sj.onc.1201487. [DOI] [PubMed] [Google Scholar]
- Beck T, Delley PA, Hall MN. Control of the actin cytoskeleton by extracellular signals. Results and problems in cell differentiation. 2001;32:231–262. doi: 10.1007/978-3-540-46560-7_16. [DOI] [PubMed] [Google Scholar]
- Bencsath FA, Shartava A, Monteiro CA, Goodman SR. Identification of the disulfide-linked peptide in irreversibly sickled cell beta-actin. Biochemistry. 1996;35:4403–4408. doi: 10.1021/bi960063n. [DOI] [PubMed] [Google Scholar]
- Carlsson AE, Shah AD, Elking D, Karpova TS, Cooper JA. Quantitative analysis of actin patch movement in yeast. Biophysical journal. 2002;82:2333–2343. doi: 10.1016/S0006-3495(02)75579-3. [DOI] [PMC free article] [PubMed] [Google Scholar]
- Chowdhury S, Smith KW, Gustin MC. Osmotic stress and the yeast cytoskeleton: phenotype-specific suppression of an actin mutation. The Journal of cell biology. 1992;118:561–571. doi: 10.1083/jcb.118.3.561. [DOI] [PMC free article] [PubMed] [Google Scholar]
- Clark MG, Teply J, Haarer BK, Viggiano SC, Sept D, Amberg DC. A genetic dissection of Aip1p’s interactions leads to a model for Aip1p-cofilin cooperative activities. Molecular biology of the cell. 2006;17:1971–1984. doi: 10.1091/mbc.E05-10-0956. [DOI] [PMC free article] [PubMed] [Google Scholar]
- Clempus RE, Griendling KK. Reactive oxygen species signaling in vascular smooth muscle cells. Cardiovascular research. 2006;71:216–225. doi: 10.1016/j.cardiores.2006.02.033. [DOI] [PMC free article] [PubMed] [Google Scholar]
- Coyle JT, Puttfarcken P. Oxidative stress, glutamate, and neurodegenerative disorders. Science (New York, NY) 1993;262:689–695. doi: 10.1126/science.7901908. [DOI] [PubMed] [Google Scholar]
- Dalle-Donne I, Giustarini D, Rossi R, Colombo R, Milzani A. Reversible S-glutathionylation of Cys 374 regulates actin filament formation by inducing structural changes in the actin molecule. Free radical biology & medicine. 2003;34:23–32. doi: 10.1016/s0891-5849(02)01182-6. [DOI] [PubMed] [Google Scholar]
- Dalle-Donne I, Rossi R, Milzani A, Di Simplicio P, Colombo R. The actin cytoskeleton response to oxidants: from small heat shock protein phosphorylation to changes in the redox state of actin itself. Free radical biology & medicine. 2001;31:1624–1632. doi: 10.1016/s0891-5849(01)00749-3. [DOI] [PubMed] [Google Scholar]
- DalleDonne I, Milzani A, Colombo R. H2O2-treated actin: assembly and polymer interactions with cross-linking proteins. Biophysical journal. 1995;69:2710–2719. doi: 10.1016/S0006-3495(95)80142-6. [DOI] [PMC free article] [PubMed] [Google Scholar]
- Delley PA, Hall MN. Cell wall stress depolarizes cell growth via hyperactivation of RHO1. The Journal of cell biology. 1999;147:163–174. doi: 10.1083/jcb.147.1.163. [DOI] [PMC free article] [PubMed] [Google Scholar]
- Doyle T, Botstein D. Movement of yeast cortical actin cytoskeleton visualized in vivo. Proceedings of the National Academy of Sciences of the United States of America. 1996;93:3886–3891. doi: 10.1073/pnas.93.9.3886. [DOI] [PMC free article] [PubMed] [Google Scholar]
- Fiorentini C, Falzano L, Rivabene R, Fabbri A, Malorni W. N-acetylcysteine protects epithelial cells against the oxidative imbalance due to Clostridium difficile toxins. FEBS letters. 1999;453:124–128. doi: 10.1016/s0014-5793(99)00706-1. [DOI] [PubMed] [Google Scholar]
- Gilbert HF. Molecular and cellular aspects of thiol-disulfide exchange. Advances in enzymology and related areas of molecular biology. 1990;63:69–172. doi: 10.1002/9780470123096.ch2. [DOI] [PubMed] [Google Scholar]
- Giorgio M, Trinei M, Migliaccio E, Pelicci PG. Hydrogen peroxide: a metabolic by-product or a common mediator of ageing signals? Nature reviews. 2007;8:722–728. doi: 10.1038/nrm2240. [DOI] [PubMed] [Google Scholar]
- Goldschmidt-Clermont PJ, Moldovan L. Stress, superoxide, and signal transduction. Gene expression. 1999;7:255–260. [PMC free article] [PubMed] [Google Scholar]
- Goode BL, Rodal AA, Barnes G, Drubin DG. Activation of the Arp2/3 complex by the actin filament binding protein Abp1p. The Journal of cell biology. 2001;153:627–634. doi: 10.1083/jcb.153.3.627. [DOI] [PMC free article] [PubMed] [Google Scholar]
- Goodman SR. The irreversibly sickled cell: a perspective. Cellular and molecular biology (Noisy-le-Grand, France) 2004;50:53–58. [PubMed] [Google Scholar]
- Goodman SRaJC. Damage to the Red Blood Cell Membrance in Sickle Cell Disease. In: Pace B, editor. Renaissance of Sickle Cell Disease Research in the Genome Era. London: Imperial College Press; 2007. p. 357. [Google Scholar]
- Gourlay CW, Ayscough KR. The actin cytoskeleton: a key regulator of apoptosis and ageing? Nature reviews. 2005;6:583–589. doi: 10.1038/nrm1682. [DOI] [PubMed] [Google Scholar]
- Haarer B, Viggiano S, Hibbs MA, Troyanskaya OG, Amberg DC. Modeling complex genetic interactions in a simple eukaryotic genome: actin displays a rich spectrum of complex haploinsufficiencies. Genes & development. 2007;21:148–159. doi: 10.1101/gad.1477507. [DOI] [PMC free article] [PubMed] [Google Scholar]
- Hertelendi Z, Toth A, Borbely A, Galajda Z, van der Velden J, Stienen GJ, Edes I, Papp Z. Oxidation of myofilament protein sulfhydryl groups reduces the contractile force and its Ca2+ sensitivity in human cardiomyocytes. Antioxidants & redox signaling. 2008;10:1175–1184. doi: 10.1089/ars.2007.2014. [DOI] [PubMed] [Google Scholar]
- Hinshaw DB, Burger JM, Beals TF, Armstrong BC, Hyslop PA. Actin polymerization in cellular oxidant injury. Archives of biochemistry and biophysics. 1991;288:311–316. doi: 10.1016/0003-9861(91)90200-3. [DOI] [PubMed] [Google Scholar]
- Huh WK, Falvo JV, Gerke LC, Carroll AS, Howson RW, Weissman JS, O’Shea EK. Global analysis of protein localization in budding yeast. Nature. 2003;425:686–691. doi: 10.1038/nature02026. [DOI] [PubMed] [Google Scholar]
- Huot J, Houle F, Marceau F, Landry J. Oxidative stress-induced actin reorganization mediated by the p38 mitogen-activated protein kinase/heat shock protein 27 pathway in vascular endothelial cells. Circulation research. 1997;80:383–392. doi: 10.1161/01.res.80.3.383. [DOI] [PubMed] [Google Scholar]
- Ignarro LJ. Nitric Oxide: Biology and Pathobiology. Academic press; San Diego: 2000. [Google Scholar]
- Laragione T, Bonetto V, Casoni F, Massignan T, Bianchi G, Gianazza E, Ghezzi P. Redox regulation of surface protein thiols: identification of integrin alpha-4 as a molecular target by using redox proteomics. Proceedings of the National Academy of Sciences of the United States of America. 2003;100:14737–14741. doi: 10.1073/pnas.2434516100. [DOI] [PMC free article] [PubMed] [Google Scholar]
- Lassing I, Schmitzberger F, Bjornstedt M, Holmgren A, Nordlund P, Schutt CE, Lindberg U. Molecular and structural basis for redox regulation of beta-actin. Journal of molecular biology. 2007;370:331–348. doi: 10.1016/j.jmb.2007.04.056. [DOI] [PubMed] [Google Scholar]
- Laun P, Pichova A, Madeo F, Fuchs J, Ellinger A, Kohlwein S, Dawes I, Frohlich KU, Breitenbach M. Aged mother cells of Saccharomyces cerevisiae show markers of oxidative stress and apoptosis. Mol Microbiol. 2001;39:1166–1173. [PubMed] [Google Scholar]
- Lillie SH, Brown SS. Immunofluorescence localization of the unconventional myosin, Myo2p, and the putative kinesin-related protein, Smy1p, to the same regions of polarized growth in Saccharomyces cerevisiae. The Journal of cell biology. 1994;125:825–842. doi: 10.1083/jcb.125.4.825. [DOI] [PMC free article] [PubMed] [Google Scholar]
- Lopez-Mirabal HR, Winther JR. Redox characteristics of the eukaryotic cytosol. Biochimica et biophysica acta. 2008;1783:629–640. doi: 10.1016/j.bbamcr.2007.10.013. [DOI] [PubMed] [Google Scholar]
- Meister A, Anderson ME. Glutathione. Annual review of biochemistry. 1983;52:711–760. doi: 10.1146/annurev.bi.52.070183.003431. [DOI] [PubMed] [Google Scholar]
- Milzani A, DalleDonne I, Colombo R. Prolonged oxidative stress on actin. Archives of biochemistry and biophysics. 1997;339:267–274. doi: 10.1006/abbi.1996.9847. [DOI] [PubMed] [Google Scholar]
- Milzani A, Rossi R, Di Simplicio P, Giustarini D, Colombo R, DalleDonne I. The oxidation produced by hydrogen peroxide on Ca-ATP-G-actin. Protein Sci. 2000;9:1774–1782. doi: 10.1110/ps.9.9.1774. [DOI] [PMC free article] [PubMed] [Google Scholar]
- Mocali A, Caldini R, Chevanne M, Paoletti F. Induction, effects, and quantification of sublethal oxidative stress by hydrogen peroxide on cultured human fibroblasts. Experimental cell research. 1995;216:388–395. doi: 10.1006/excr.1995.1049. [DOI] [PubMed] [Google Scholar]
- Morton WM, Ayscough KR, McLaughlin PJ. Latrunculin alters the actin-monomer subunit interface to prevent polymerization. Nature cell biology. 2000;2:376–378. doi: 10.1038/35014075. [DOI] [PubMed] [Google Scholar]
- Omann GM, Harter JM, Burger JM, Hinshaw DB. H2O2-induced increases in cellular F-actin occur without increases in actin nucleation activity. Archives of biochemistry and biophysics. 1994;308:407–412. doi: 10.1006/abbi.1994.1057. [DOI] [PubMed] [Google Scholar]
- Poole LB, Karplus PA, Claiborne A. Protein sulfenic acids in redox signaling. Annual review of pharmacology and toxicology. 2004;44:325–347. doi: 10.1146/annurev.pharmtox.44.101802.121735. [DOI] [PubMed] [Google Scholar]
- Read EB, Okamura HH, Drubin DG. Actin- and tubulin-dependent functions during Saccharomyces cerevisiae mating projection formation. Molecular biology of the cell. 1992;3:429–444. doi: 10.1091/mbc.3.4.429. [DOI] [PMC free article] [PubMed] [Google Scholar]
- Sagot I, Pinson B, Salin B, Daignan-Fornier B. Actin bodies in yeast quiescent cells: an immediately available actin reserve? Molecular biology of the cell. 2006;17:4645–4655. doi: 10.1091/mbc.E06-04-0282. [DOI] [PMC free article] [PubMed] [Google Scholar]
- Shartava A, Korn W, Shah AK, Goodman SR. Irreversibly sickled cell beta-actin: defective filament formation. American journal of hematology. 1997;55:97–103. doi: 10.1002/(sici)1096-8652(199706)55:2<97::aid-ajh8>3.0.co;2-y. [DOI] [PubMed] [Google Scholar]
- Shartava A, Monteiro CA, Bencsath FA, Schneider K, Chait BT, Gussio R, Casoria-Scott LA, Shah AK, Heuerman CA, Goodman SR. A posttranslational modification of beta-actin contributes to the slow dissociation of the spectrin-protein 4.1-actin complex of irreversibly sickled cells. The Journal of cell biology. 1995;128:805–818. doi: 10.1083/jcb.128.5.805. [DOI] [PMC free article] [PubMed] [Google Scholar]
- Spector I, Shochet NR, Kashman Y, Groweiss A. Latrunculins: novel marine toxins that disrupt microfilament organization in cultured cells. Science (New York, NY) 1983;219:493–495. doi: 10.1126/science.6681676. [DOI] [PubMed] [Google Scholar]
- Takashi R. Fluorescence energy transfer between subfragment-1 and actin points in the rigor complex of actosubfragment-1. Biochemistry. 1979;18:5164–5169. doi: 10.1021/bi00590a021. [DOI] [PubMed] [Google Scholar]
- Toledano MB, Delaunay A, Monceau L, Tacnet F. Microbial H2O2 sensors as archetypical redox signaling modules. Trends in biochemical sciences. 2004;29:351–357. doi: 10.1016/j.tibs.2004.05.005. [DOI] [PubMed] [Google Scholar]
- Turrens JF. Mitochondrial formation of reactive oxygen species. The Journal of physiology. 2003;552:335–344. doi: 10.1113/jphysiol.2003.049478. [DOI] [PMC free article] [PubMed] [Google Scholar]
- Vilella F, Herrero E, Torres J, de la Torre-Ruiz MA. Pkc1 and the upstream elements of the cell integrity pathway in Saccharomyces cerevisiae, Rom2 and Mtl1, are required for cellular responses to oxidative stress. The Journal of biological chemistry. 2005;280:9149–9159. doi: 10.1074/jbc.M411062200. [DOI] [PubMed] [Google Scholar]
- Waddle JA, Karpova TS, Waterston RH, Cooper JA. Movement of cortical actin patches in yeast. The Journal of cell biology. 1996;132:861–870. doi: 10.1083/jcb.132.5.861. [DOI] [PMC free article] [PubMed] [Google Scholar]
- Wendland B, Emr SD. Pan1p, yeast eps15, functions as a multivalent adaptor that coordinates protein-protein interactions essential for endocytosis. The Journal of cell biology. 1998;141:71–84. doi: 10.1083/jcb.141.1.71. [DOI] [PMC free article] [PubMed] [Google Scholar]
- Winterbourn CC, Metodiewa D. Reactivity of biologically important thiol compounds with superoxide and hydrogen peroxide. Free radical biology & medicine. 1999;27:322–328. doi: 10.1016/s0891-5849(99)00051-9. [DOI] [PubMed] [Google Scholar]
- Wu JQ, Kuhn JR, Kovar DR, Pollard TD. Spatial and temporal pathway for assembly and constriction of the contractile ring in fission yeast cytokinesis. Dev Cell. 2003;5:723–734. doi: 10.1016/s1534-5807(03)00324-1. [DOI] [PubMed] [Google Scholar]
- Yang HC, Pon LA. Actin cable dynamics in budding yeast. Proceedings of the National Academy of Sciences of the United States of America. 2002;99:751–756. doi: 10.1073/pnas.022462899. [DOI] [PMC free article] [PubMed] [Google Scholar]
- Young ME, Cooper JA, Bridgman PC. Yeast actin patches are networks of branched actin filaments. The Journal of cell biology. 2004;166:629–635. doi: 10.1083/jcb.200404159. [DOI] [PMC free article] [PubMed] [Google Scholar]
- Yuzyuk T, Foehr M, Amberg DC. The MEK kinase Ssk2p promotes actin cytoskeleton recovery after osmotic stress. Molecular biology of the cell. 2002;13:2869–2880. doi: 10.1091/mbc.02-01-0004. [DOI] [PMC free article] [PubMed] [Google Scholar]
- Zhu D, Tan KS, Zhang X, Sun AY, Sun GY, Lee JC. Hydrogen peroxide alters membrane and cytoskeleton properties and increases intercellular connections in astrocytes. Journal of cell science. 2005;118:3695–3703. doi: 10.1242/jcs.02507. [DOI] [PubMed] [Google Scholar]
Associated Data
This section collects any data citations, data availability statements, or supplementary materials included in this article.


