Abstract
During image guided interventional procedures, superior resolution and image quality is critically important. Operating the MAF in the new High Definition (HD) fluoroscopy mode provides high resolution and increased contrast-to-noise ratio. The MAF has a CCD camera and a 300 micron cesium iodide x-ray convertor phosphor coupled to a light image intensifier (LII) through a fiber-optic taper. The MAF captures 1024 × 1024 pixels with an effective pixel size of 35 microns, and is capable of real-time imaging at 30 fps. The HD mode uses the advantages of higher exposure along with a small focal spot effectively improving the contrast-to-noise ratio (CNR) and the spatial resolution. The Control Acquisition Processing and Image Display System (CAPIDS) software for the MAF controls the LII gain. The interventionalist can select either fluoroscopic or angiographic modes using the two standard foot pedals. When improved image quality is needed and the angiography footpedal is used for HD mode, the x-ray machine will operate at a preset higher exposure rate using a small focal spot, while the CAPIDS will automatically adjust the LII gain to achieve proper image brightness. HD mode fluoroscopy and roadmapping are thus achieved conveniently during the interventional procedure. For CNR and resolution evaluation we used a bar phantom with images taken in HD mode with both the MAF and a Flat Panel Detector (FPD). It was seen that the FPD could not resolve more than 2.8 lp/mm whereas the MAF could resolve more than 5 lp/mm. The CNR of the MAF was better than that of the FPD by 60% at lower frequencies and by 600% at the Nyquist frequency of the FPD. The HD mode has become the preferred mode during animal model interventions because it enables detailed features of endovascular devices such as stent struts to be visualized clearly for the first time. Clinical testing of the MAF in HD mode is imminent.
I. Introduction
Image guided interventional procedures involve use of low profile devices such as microstents. These devices are placed in catheters and passed through arteries. Placement of these devices must be done accurately for high success rates. High-resolution fluoroscopic images generally provide the image guidance. For higher resolution and improved contrast to noise ratio (CNR) increased dose to the patient, and use of a smaller focal spot are required. By using a unique high-resolution detector, the Micro-Angiographic Fluoroscope, a manually controlled x-ray source, and a dedicated image display system, we can achieve higher resolution, higher CNR and lower noise by conveniently switching between the x-ray foot-pedals that control standard fluoroscopy and angiography or HD mode.
II. Methods and Materials
A. Micro Angiographic Fluoroscope
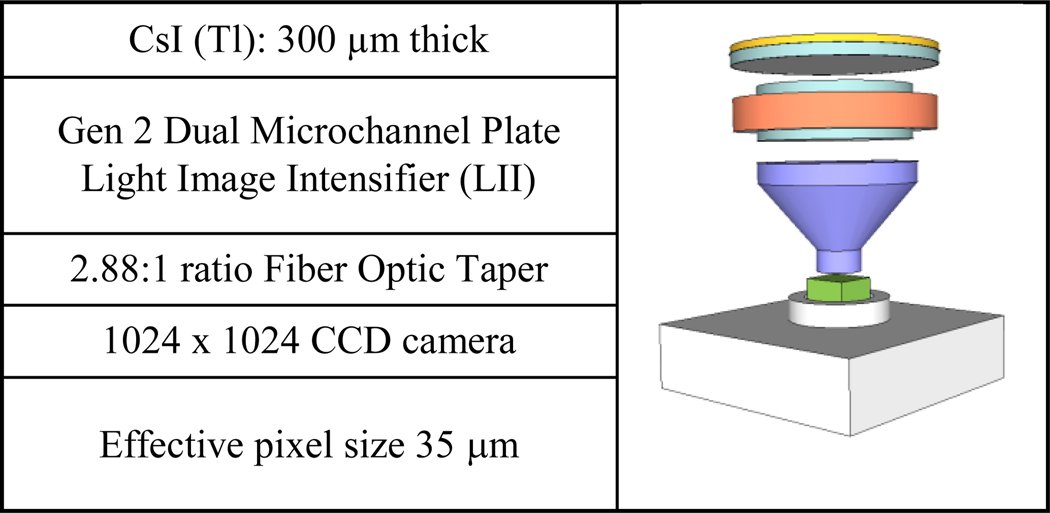
The MAF is a CCD based x-ray detector. The CCD camera is a 1024×1024 array of 12 µm size pixels. A 300 µm thick structured CsI(Tl) coupled to a Gen 2 Dual Microchannel Plate LII. The LII equips the camera with a large variable gain which can be controlled dynamically by a custom developed software. (CAPIDS) The LII is coupled to the CCD camera through a 2.88:1 ratio fiber optic taper, thus giving the MAF an effective pixel size of 35 µm. (Fig 1)
Fig. 1.
Schematic of Micro Angiographic Fluoroscope
B. Control, Acquisition, Processing and Image Display System (CAPIDS)
CAPIDS is the software which interfaces with the MAF to acquire and display images. It also controls the gain of the LII. An Automatic Gain Control (AGC) mode adjusts the LII gain keeping the digital number in a preset range independent of the detector exposure.
C. High Definition Mode (HD Mode)
Normal fluoroscopy uses the medium focal spot (0.5 mm) to reduce tube wear. The HD mode uses a small focal spot (0.3 mm) for better resolution, and higher dose rate to reduce the noise thus achieving increased CNR. Though the exposure rate is higher, it has been shown that the effective dose for the MAF is lower than that for a conventional 20×20 cm field of view flat panel detector2. The HD mode is meant to be used during critical portions of an interventional procedure, such as during the actual stent deployment.
III. Procedure
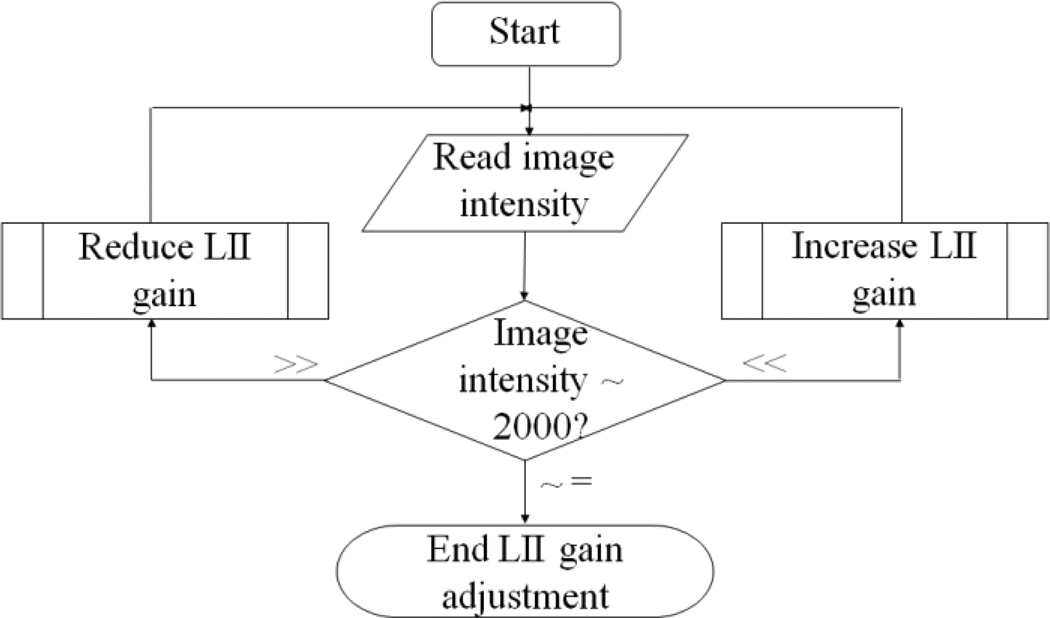
The x-ray generator has fluoroscopy and angiography modes that can be activated by pressing one of two different foot-pedals. The angiography mode is set up to use the small focal spot and 3 to 4 times the mAs of normal fluoroscopy mode. CAPIDS is set up to acquire images seamlessly for either mode. The interventionalist initially uses the conventional Flat Panel Detector (FPD) in fluoroscopy mode to position the catheter and, when better pictures are required, the MAF is inserted and the angiography foot-pedal is depressed for HD mode. The x-ray tube now operates at the higher exposure rate using the small focal spot while CAPIDS keeps on acquiring images continuously. We designed the system so that, when the receptor exposure increases and the digital numbers increase, the LII gain will automatically be reduced thus maintaining proper image brightness and maintaining the continuity of the image acquisition. This is represented by the flow chart in Fig 2.
Fig. 2.
Flow chart for LII gain adjustment
IV. Results and Conclusion
A. Contrast to Noise Ratio evaluation
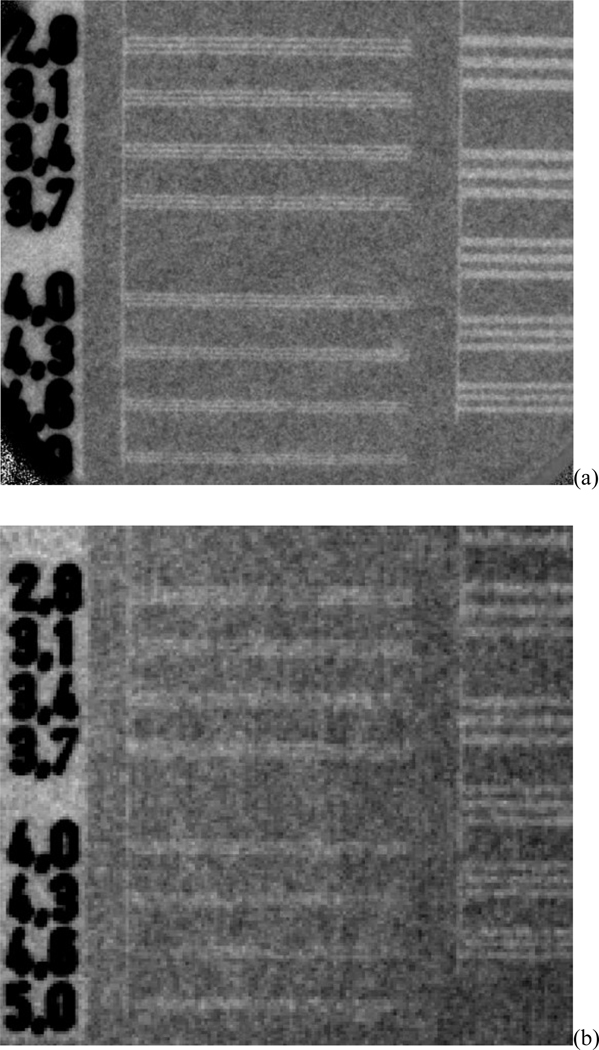
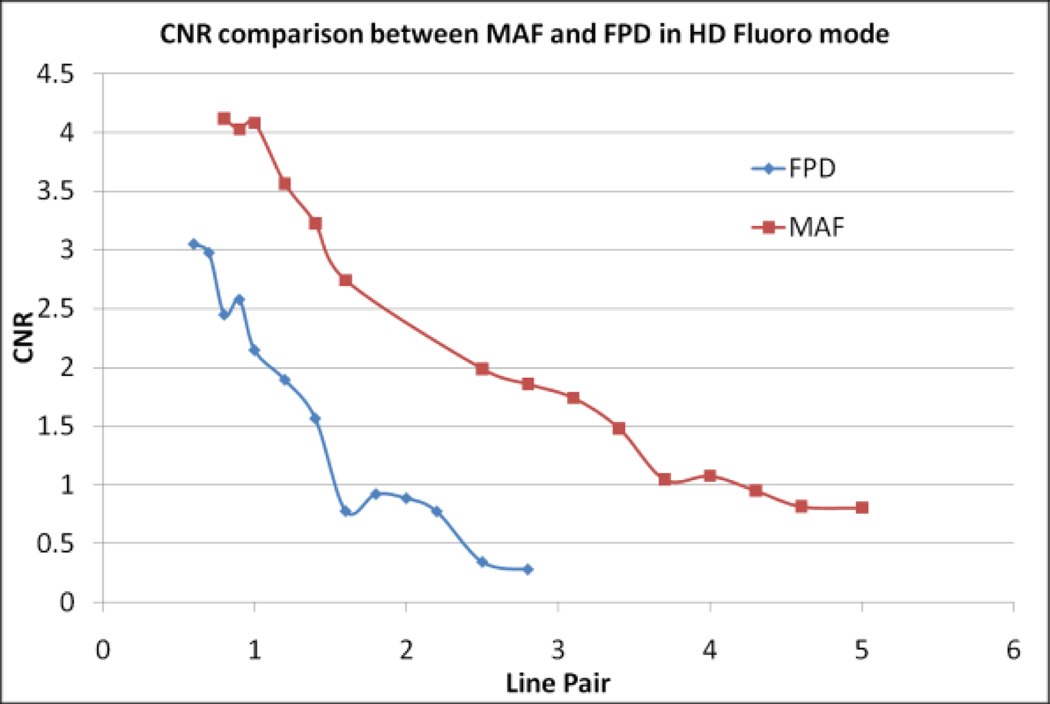
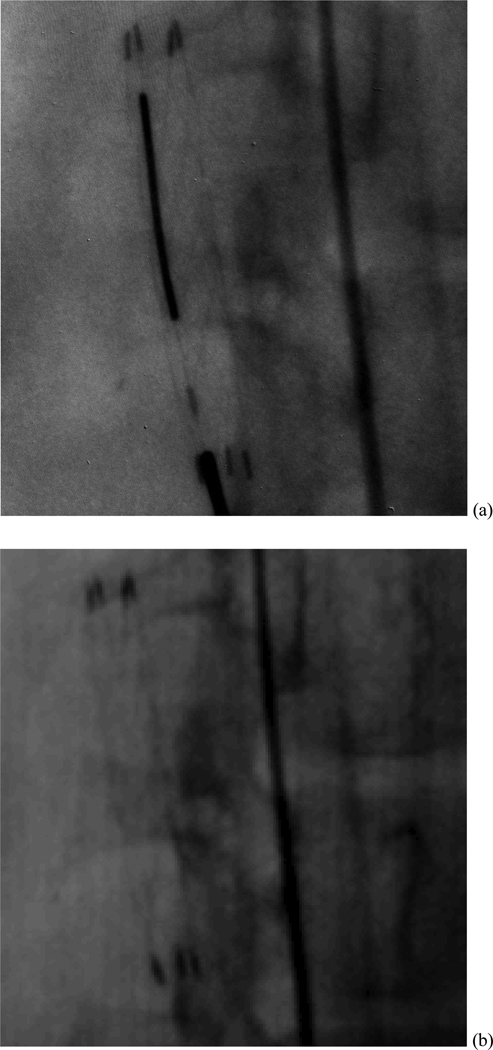
Images of a bar phantom were taken with the FPD and MAF in HD mode. Relative contrast was measured as the signal difference between the bar (bright lines) and the region between the bars (dark line) relative to the background level. Noise is measured as the variance of the background region. Comparing Fig 3 (a) and (b), the FPD is limited to 2.8 lp/mm whereas, the MAF can resolve 5 lp/mm. Fig 4 shows the CNR comparison between FPD and MAF as a function of bar frequency. At lower frequencies, the CNR of the images taken with the MAF is about 60% better than the FPD and at higher frequencies it is better by about 600%. The lower CNR at low frequencies for the FPD is due to the fact that it has an anti-scatter grid which absorbs primary x-rays whereas the MAF does not have a grid because of reduced scatter expected with its small field of view. After 2.8 lp/mm, the FPD does not resolve the bars.
Fig. 3.
HD mode x-ray images of bar phantom using (a) MAF (b) FPD
Fig. 4.
CNR comparison of MAF and FPD in HD mode
The MAF was used in HD mode to successfully place stents in rabbit carotid arteries that are 2–3mm in diameter. Fig 5(a) shows one of the HD mode frames taken with the MAF of the same stent in the same rabbit. Fig 5 (b) shows a zoomed view of a stent in a rabbit taken with the FPD in angio (HD) mode. It can be seen that the 80 micron stent struts are more clearly visualized with the MAF.
Fig. 5.
HD mode x-ray images of a stent in a rabbit using (a) MAF (b) FPD
The HD mode has become the preferred mode during animal model interventions because it enables detailed features of endovascular devices such as stent struts to be visualized clearly for the first time. The clinical testing of the MAF is currently successfully continuing.
Acknowledgments
This work received support from: NIH Grants R01EB002873 and R01EB008425
Appendix
A. CNR calculation
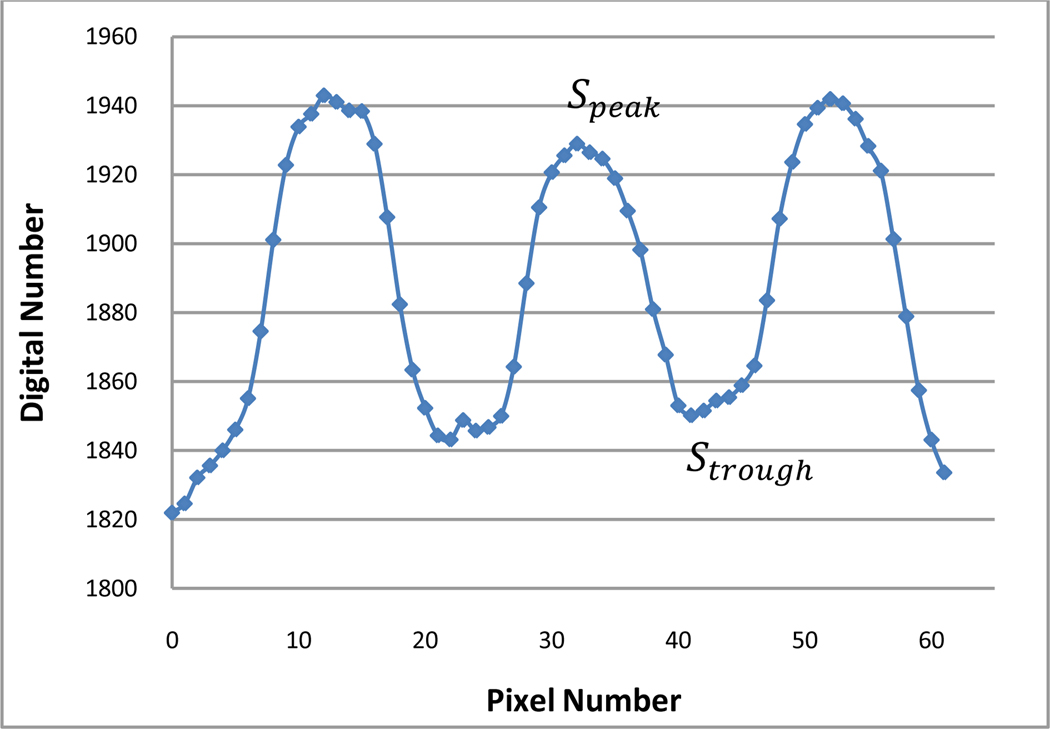
The CNR is calculated on the image of bar phantom. A line profile is drawn across each line pair. The line profile shows peaks and troughs as shown in Fig 6.
Fig. 6.
Line profile across a line pair group
Relative contrast is given by
Where Sbkg is the mean value of a uniform background region in the image.
Noise is given by
Where σ is the standard deviation of the background region.
Thus CNR is
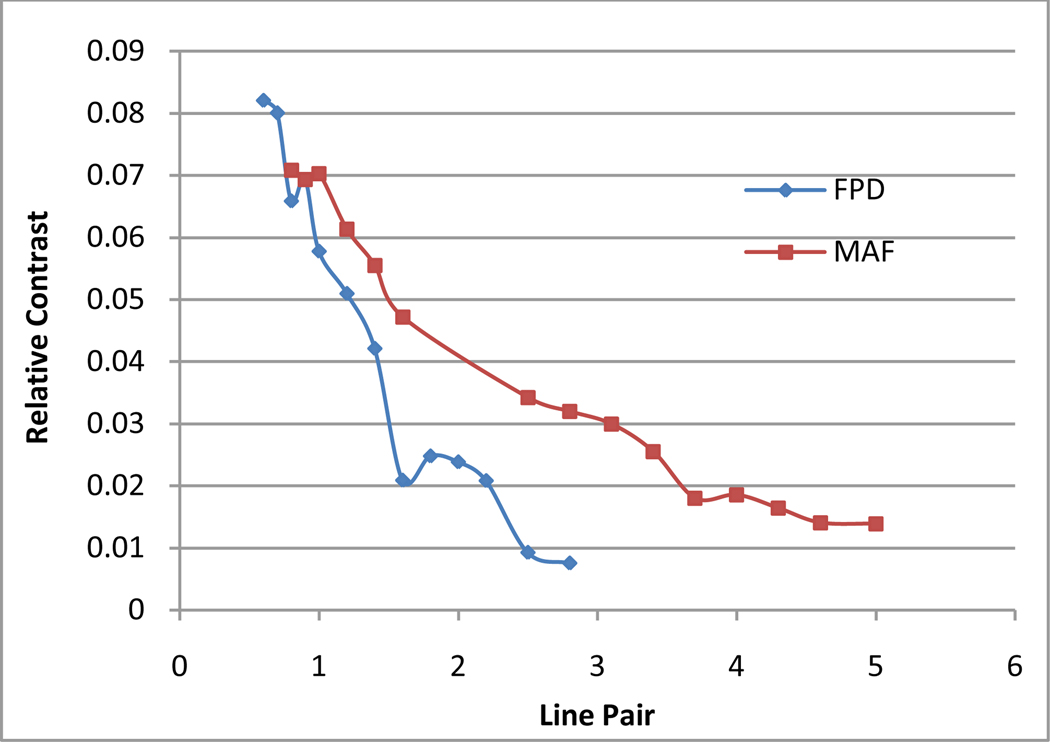
Fig 7 shows the comparison between contrast values for the MAF and FPD. It can be seen that both the detectors show similar contrast performance at lower frequencies, but the MAF shows better contrast at higher frequencies. Also, comparing the figures 4 and 7, we can see that the grid used with FPD, does not affect the relative contrast value (fig 7) but degrades the CNR for the FPD.
Fig. 7.
Relative contrast comparison between MAF and FPD
Contributor Information
Ashish Panse, Email: aspanse@buffalo.edu, Medical Physics program at the University at Buffalo (SUNY).
C. N. Ionita, Toshiba Stroke Research Center (UB-TSRC) at the University at Buffalo (SUNY).
W. Wang, Medical Physics program at the University at Buffalo (SUNY).
S. K. Natarajan, UB-TSRC and Department of Neurosurgery at the University at Buffalo (SUNY).
A. Jain, Toshiba Stroke Research Center (UB-TSRC) at the University at Buffalo (SUNY).
D. R. Bednarek, Radiology at the University at Buffalo (SUNY).
S. Rudin, SUNY Distinguished Professor and Co-Director, Imaging Division of the UB-TSRC at the University at Buffalo (SUNY).
References
- 1.Wang Weiyuan, Ionita Ciprian N, Keleshis Christos, Kuhls-Gilcrist Andrew, Jain Amit, Bednarek Daniel, Rudin Stephen. Progress in the Development of a new Angiography Suite including the High Resolution Micro-Angiographic Fluoroscope (MAF), a Control, Acquisition, Processing, and Image Display System (CAPIDS), and a New Detector Changer Integrated into a Commercial C-Arm Angiography Unit to Enable Clinical Use. Proc. SPIE. 2010 doi: 10.1117/12.844909. In print. [DOI] [PMC free article] [PubMed] [Google Scholar]
- 2.Gill Kamaljeet, Bednarek Daniel, Rudin Stephen. Evaluation of Effective Dose in Region-of-Interest Neuroimaging AAPM (2010) Poster SU-GG-I-74. Med. Phys. 2010;37:3118. [Google Scholar]


