

Abstract
Vibrational reporters have shown significant promise as sensitive probes of local environments in proteins and nucleic acids. The utility of two potential vibrational probes, the cyanate and azide groups in phenyl cyanate and 3-azidopyridine, respectively, has been hindered by accidental Fermi resonance. Anharmonic coupling, between the fundamental –OCN or –N3 asymmetric stretch vibration with a near resonant combination band, results in an extremely broad and complex absorption profile for each of these probes. A total of eight phenyl cyanate and six 3-azidopyridine isotopomers were synthesized and studied. Isotopic editing effectively modulated the accidental Fermi resonance — the absorption profiles of several isotopomers were greatly simplified while others remained complex. The origins of the observed profiles are discussed. Addition of a single neutron to the middle atom of the oscillator converted the absorption profile to essentially a single band resulting from either the cyanate or azide asymmetric stretch vibration.
Keywords: Phenyl Cyanate, 3-Azidopyridine, IR spectroscopy, Isotopic editing, Anharmonic Coupling, Vibrational Probes
The use of vibrational reporters as sensitive and site-specific probes of local environments in proteins and nucleic acids has become an important biophysical technique in the past decade. 1-20 The rise of 2D IR methods has made vibrational probes even more attractive because of the increased sensitivity and the ability to investigate molecular dynamics afforded by this technique. 3,12-14,21-24 The vibrational Stark effect of these probes has also been utilized to extract information about local electric fields in proteins. 25
Synthetic methodologies are available for the incorporation of small two- or three-atom probes such as azides, nitriles, and thiocyanates into small peptides, large proteins, and nucleic acids. 1,4,17,19,26-29 These three vibrational probes have proven particularly useful because they absorb in the relatively transparent spectral window between the carbonyl and C-H stretching regions, that is, from approximately 1900 to 2700 cm−1. The development of additional probes, including the cyanate group30 and carbon-deuterium bonds,31,32 is under investigation specifically because they also absorb in this region. Although this region of the infrared spectrum is free from competing allowed (within the harmonic approximation) fundamental transitions, it does contain many dark overtone or combination states because of the plethora of absorbances in the fingerprint region (500-1500 cm−1). Thus, it is quite common to observe complex absorption profiles for azides, 20,33-35 nitriles,36 and cyanates30,37 likely due to strong anharmonic couplings (e.g., accidental Fermi resonance) between the fundamental transition and these overtone or combination states.
The FTIR spectrum of phenyl cyanate in Figure 1A shows at least three absorbance bands in the –OCN asymmetric stretching region. Based upon the position of the bands and literature precedent, 30 we assign the band with the largest relative intensity at 2278.0 cm−1 to the cyanate asymmetric stretch. Similarly, the linear IR spectrum of 3-azidopyridine in the azide asymmetric stretching region shows at least three components with the strongest feature at 2135.3 cm−1. In agreement with previous work, we assign this feature to the azide asymmetric stretch. 35 These complex absorbance profiles present several problems for the practical implementation of these FTIR probes to study local biomolecular environments. Ideally, the linear IR spectrum for each of these probes would show a single absorbance band resulting from the –OCN or –N3 asymmetric stretch whose position and width would systematically depend on its local environment. The complex absorption profile observed for both of these molecules is dependent upon local environment, however observed spectral shifts could be the result of multiple factors. 30,35 For instance, observed changes in the absorption profile could be the result of solvent-induced frequency shifts of the cyanate or azide asymmetric stretch and/or the combination band(s) in addition to changes in the strength of the anharmonic coupling between these modes. The deconvolution of the observed shifts into these two effects requires 2D IR spectroscopy. 30,35
Figure 1.

A. FTIR absorbance spectra of phenyl cyanate (PhOCN) in the cyanate asymmetric stretching region. B. FTIR absorbance spectrum of 3-azidopyridine (PyrNNN) in the azide asymmetric stretching region. Both molecules were dissolved in tetrahydrofuran (THF) and the spectra were recorded at 298 K. The maximum absorbance of each spectrum has been normalized to unity. The DFT optimized structure of each molecule at the B3PW91/6-31++G(d,p) level is shown in the insets.
Here, we have attempted to increase the utility of the cyanate and azide asymmetric stretch in phenyl cyanate and 3-azidopyridine, respectively, as effective vibrational reporters of local environment using either linear or 2D IR spectroscopy by modulating the accidental Fermi resonance present in both molecules. One of the principal requirements for accidental Fermi resonance is that the transitions involved have similar energies. 36,38-40 Therefore, our strategy involved altering the energy of the cyanate and azide asymmetric stretch and/or the energy of the near resonant combination band by the addition of a neutron to one or more of the atoms of the probe and/or to the ring atoms. Isotopic substitution is the least intrusive change possible and because of the relationship between reduced mass and vibrational frequency it will modulate vibrational energies of modes involving motion of the labeled atoms. This perturbation could also potentially modulate the accidental Fermi resonance and thus the absorption profile of each probe. Several synthetic routes were developed (see Supporting Information) to allow selective isotopic labeling of key atoms in the molecules. Thus, multiple isotopomers of phenyl cyanate and 3-azidopyridine were synthesized and characterized to determine the optimal isotopic labeling strategy to simplify the absorption profile of each of these potentially effective vibrational reporters of local environment.
Phenyl Cyanate
Hochstrasser et al.30 postulated that the accidental Fermi resonance in phenyl cyanate involves the anharmonic coupling between the cyanate asymmetric stretch and a combination band. The combination band is thought to be composed of the COC stretching mode and a second mode involving COC and ring motions. 30 Therefore our isotopic strategy first focused on modulating the energy of the fundamental cyanate asymmetric stretch through 13C or 15N labeling of this group. Secondly, we sought to modulate the energies of the vibrations involved in the combination band by deuteration of the ring. Finally, multiple combinations of cyanate and ring isotopic labeling were employed to determine if multiple or single isotopic labels were most effective at simplifying the complex absorption profile resulting from the accidental Fermi resonance.
The cyanate region of the FTIR spectra of unlabeled phenyl cyanate and seven isotopomers are shown in Figure 2. Figure 2A includes the FTIR absorbance spectrum of unlabeled phenyl cyanate and three isopomers designed to shift the cyanate asymmetric stretch. Specifically, 15N, 13C, or 13C15N labeling of the cyanate group generated the isotopomers PhOC15N, PhO13CN, and PhO13C15N, respectively. Similar to the unlabeled PhOCN, the FTIR spectrum of PhOC15N showed a complex IR absorption profile consisting of at least three spectral components. However, the highest frequency component of the PhOCN profile had the largest intensity, while the lowest frequency component (2218.7 cm−1) of the PhOC15N profile had the largest intensity. Assigning the cyanate stretch to the band with largest relative intensity results in a 59 cm−1 red shift of the cyanate asymmetric stretch in PhOC15N relative to PhOCN. The direction of this experimental shift is expected based upon the change in the reduced mass of the oscillator.
Figure 2.

FTIR absorbance spectra of isotopomers of phenyl cyanate in the cyanate asymmetric stretching region recorded at 298 K in THF. The maximum absorbance of each spectrum has been normalized to unity and the spectra have been offset for comparison. Panel A includes the IR spectra of PhOCN, PhOC15N, PhO13CN, and PhO13C15N. The IR spectra of D5-PhOCN, D5-PhOC15N, D5-PhO13CN, and D5-PhO13C15N are shown in Panel B.
In order to increase the energy difference between the –OCN stretch and the combination band, the –OCN asymmetric stretching frequency was modulated by 13C and 13C15N labeling of the cyanate group. A greatly simplified absorbance profile results with essentially one band at 2198.5 and 2178.7 cm−1 for PhO13CN and PhO13C15N, respectively. The accidental Fermi resonance has been effectively modulated as the strength of the anharmonic coupling was significantly reduced. 2D IR measurements are required to fully access the strength of any remaining anharmonic coupling. 30 Regardless, the presence of essentially a single IR absorbance band renders these two isotopomers as practical linear IR probes of local environments as illustrated by the sensitivity of the cyanate asymmetric stretching frequency of PhO13CN to solvent (see Supporting Information).
An alternative strategy to modulate the accidental Fermi resonance in PhOCN is to alter the energy of the near resonant combination band. Since the combination band is postulated to involve ring motions, the aromatic ring of phenyl cyanate was deuterated. The FTIR absorbance spectra of D5-PhOCN in the cyanate region is shown in Figure 2B. Deuteration of the ring results in a simpler absorption profile compared to PhOCN providing further support that ring motion is involved in the near resonant combination band. However, the profile still consists of multiple bands with the largest component occurring at 2259.2 cm−1. Although deuteration of the ring appears to modulate the complicating accidental Fermi resonance, this isotopic labeling strategy is less desirable than labeling the cyanate group since C-D stretching vibrations also occur in the spectral region of interest. Consequently, the cyanate group was labeled in addition to ring deuteration to shift the cyanate stretch away from potentially interfering C-D vibrations.
The FTIR spectrum of D5-PhOC15N shows a simpler absorption profile compared to D5-PhOCN although the line shape of the main spectral band at 2239.0 cm−1 does shows some asymmetry. The FTIR spectra of D5-PhO13CN and D5-PhO13C15N result in complex absorption profiles rivaling the complexity of the absorption profile of PhOCN. Each of these isotopomers clearly modulated the accidental Fermi resonance, as evidenced by the differences of the absorption profiles in the cyanate region. However, none of the deuterated isotopomers resulted in an absorption profile as simple as those observed for PhO13CN and PhO13C15N.
3-Azidopyridine
Isotopic labeling was also employed to modulate the accidental Fermi resonance present in the FTIR spectrum of 3-azidopyridine in the azide asymmetric stretching region as shown in Figure 3. 35 Similar to phenyl cyanate, the nitrogen atoms involved in the azide asymmetric stretch or the ring hydrogens of 3-azidopyridine were selectively isotopically labeled to increase the energy difference between the azide asymmetric stretch vibration and the interfering combination band. The labeling of the azide group was performed to shift the azide asymmetric stretch while the ring deuteration was intended to modulate the energy of the near resonant combination band. Additionally, 15N labeling of the internal nitrogen atom of the azide group was expected to modulate the energy of the –N3 asymmetric stretch and potentially the near resonant combination band.
Figure 3.

FTIR absorbance spectra of PyrNNN, D4-PyrNNN, Pyr15NNN, PyrNN15N, PyrN15NN and PyrN15N15N in the azide asymmetric stretching region recorded at 298 K in THF. The maximum absorbance of each spectrum has been normalized to unity and the spectra were offset for comparison.
The absorption profile for D4-PyrNNN shown in Figure 3 contains two primary spectral components at 2106.9 and 2122.8 cm−1 with the latter band having the larger intensity. The separation between these two components is significantly less than the separation between the lowest and highest frequency components of the IR absorption profile of PyrNNN. This change in band position and separation suggests that ring deuteration did modulate the accidental Fermi resonance present in this spectral window although a single absorbance band for the –N3 asymmetric stretch was not obtained.
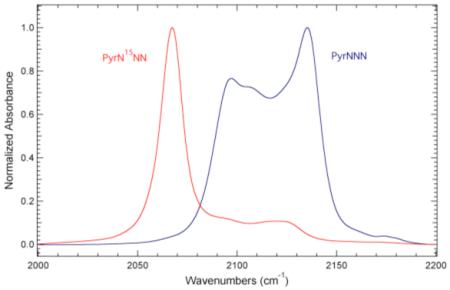
Figure 3 also shows the FTIR absorbance spectra of Pyr15NNN, PyrNN15N, PyrN15NN, and PyrN15N15N in the azide region. These isotopomers label the three nitrogen atoms that are involved in the azide asymmetric stretch vibration, either individually or in combination with another label. The azide asymmetric stretching frequency (taken to be the band with the largest intensity) for Pyr15NNN, PyrNN15N, PyrN15NN, and PyrN15N15N occurs at 2121.1, 2080.3, 2067.3, and 2044.2 cm−1, respectively. The direction of these observed shifts relative to PyrNNN is expected based upon changes in the reduced mass of the oscillator. These data clearly demonstrate that 15N isotopic labeling of the azide group shifts the azide asymmetric stretching frequency and subsequently modulates the accidental Fermi resonance.
The IR absorption profile of each of these 15N isotopomers is simpler than unlabeled 3-azidopyridine. Specifically, the absorption profiles for Pyr15NNN, PyrN15NN, and PyrN15N15N consist of essentially one band due to the azide asymmetric stretch vibration, while the spectrum of PyrNN15N consists of multiple spectral components. The observed intensity profile for PyrNN15N is similar to PhOC15N where the band with the largest intensity is on the low frequency side of the absorption profile, which is opposite of the relative intensity profile of the spectral components present in PyrNNN and PhOCN.
Comparing the two systems, it was observed that adding a neutron to either the middle or a combination of the middle and terminal atoms of the three-atom oscillator resulted in a linear IR absorbance spectrum consisting of essentially a single absorbance band resulting from the asymmetric vibration of the cyanate or the azide group. The success of this isotopic labeling strategy is likely due to the significant shift of the energy of the fundamental cyanate or azide asymmetric stretch away from the interfering combination band. This possibility was supported by DFT calculations, at the B3PW91/6-31++G(d,p) level, of the anharmonic fundamental frequencies, overtones, and combination bands (see Supporting Information for details). Specifically, the DFT calculations revealed 13 overtone or combination bands within 35 cm−1 of the cyanate asymmetric stretch vibration of phenyl cyanate. Similarly, 10 overtone or combination bands were calculated to be within 35 cm−1 of the azide asymmetric stretch vibration of 3-azidopyridine. The overtone and combination bands in phenyl cyanate and 3-azidopyridine primarily involve ring motions although one of the combination bands includes the COC or CNN stretch, respectively, consistent with previous studies. 30,35 Upon isotopic labeling of the middle or the middle and terminal atoms of the cyanate group, the energy difference between the cyanate asymmetric stretch vibration and all of the overtone and combination bands increased significantly. Isotopic labeling of the middle or the middle and terminal atoms of the azide group resulted in a significant increase in the energy difference between the azide asymmetric stretch vibration and eight of the overtone and combination bands. This difference is due to a significant shift in the energy of the cyanate and azide asymmetric stretch vibration, since the energies of the overtone and combination bands remain relatively constant.
This labeling strategy coupled with ring deuteration in phenyl cyanate resulted in a complex absorption profile even though the cyanate asymmetric stretch was significantly shifted in energy compared to PhOCN. In these cases, the combination band may have shifted in energy upon ring deuteration thereby remaining in near resonance with the fundamental –OCN stretch. Alternatively, the shifted fundamental cyanate stretch may have become in near resonance with other combination or overtone bands present in this spectral window. An additional potential complicating factor with the deuterated isotopomers is the presence of C-D stretching vibrations in this region.
The origin of the simplification in the IR absorption profile of Pyr15NNN in the azide region is likely different than PyrN15NN and PyrN15N15N. The modulation of accidental Fermi resonance in Pyr15NNN is probably due to a shift in one of the vibrational modes involved in the near resonant combination band (since isotopic labeling of the internal nitrogen atom of the azide group results only in a marginal shift of the azide asymmetric stretch vibration) and/or a significant decrease in the strength of the anharmonic coupling between the fundamental azide asymmetric stretch vibration and the near resonant combination band.
Conclusions
Isotopic editing was shown to effectively modulate the accidental Fermi resonance present in the –OCN and –N3 region for unlabeled phenyl cyanate and 3-azidopyridine, respectively. This modulation was evident by changes in the complex absorption profiles present in this spectral window for both molecules. The labeling strategy sought to alter the energy of the fundamental –OCN or –N3 asymmetric stretch vibration and/or the energy of the near resonant combination band to simplify the resulting IR absorption profile. Several isotopomers of each molecule resulted in essentially a single IR absorbance band due to the cyanate or azide asymmetric stretch vibration. Adding a single neutron to the middle atom or a neutron to each of the middle and terminal atoms of the three-atom cyanate or azide group resulted in this simplification. Additionally 15N labeling of the internal nitrogen atom of the azide group of 3-azidopyridine resulted in an absorption profile consisting of a single band. This result suggests that a 17O isotopic variant of phenyl cyanate may also yield a single absorbance band. The presence of essentially one absorbance band corresponding to either the –OCN or –N3 asymmetric stretch for these isotopomers greatly expands the practical utilization of FTIR spectroscopy with these vibrational reporters.
The methodology of utilizing isotopic editing to enhance the practical use of linear FTIR vibrational probes has the potential to be generally applicable to systems that suffer from complicated absorption profiles due to accidental Fermi resonance. However, synthetic limitations could potentially impact the use of this methodology in some systems and isotopic labeling may not result in significant simplifications of IR absorption profiles resulting from accidental Fermi resonance interactions in all systems.38 Regardless, isotopic editing was shown to be a highly effective means to modulate the accidental Fermi resonance in two systems containing a sensitive three-atom vibrational reporter of local environments.
Supplementary Material
Acknowledgment
We are grateful to Carol Strausser for assistance in the editing of the manuscript, Lisa Mertzman for obtaining materials and supplies, and Beth Buckwalter for acquiring NMR spectra. This work was supported by the NIH (R15GM093330) to SHB/EEF and NSF (CHE-1053946) to SHB.
Footnotes
Supporting Information. Synthetic methods for phenyl cyanate and 3-azidopyridine, FTIR experimental methods, solvent dependence of the FTIR absorbance spectrum of PhO13CN, DFT computational details, and eigenvector projections of the cyanate and azide asymmetric stretch vibration in phenyl cyanate and 3-azidopyridine, respectively. This material is available free of charge via the internet at http://pubs.acs.org.
References
- (1).Getahun Z, Huang CY, Wang T, De Leon B, DeGrado WF, Gai F. Using Nitrile-Derivatized Amino Acids as Infrared Probes of Local Environment. J. Am. Chem. Soc. 2003;125:405–411. doi: 10.1021/ja0285262. [DOI] [PubMed] [Google Scholar]
- (2).Suydam IT, Boxer SG. Vibrational Stark Effects Calibrate the Sensitivity of Vibrational Probes for Electric Fields in Proteins. Biochemistry. 2003;42:12050–12055. doi: 10.1021/bi0352926. [DOI] [PubMed] [Google Scholar]
- (3).Kim YS, Hochstrasser RM. Applications of 2D IR Spectroscopy to Peptides, Proteins, and Hydrogen-Bond Dynamics. J. Phys. Chem. B. 2009;113:8231–8251. doi: 10.1021/jp8113978. [DOI] [PMC free article] [PubMed] [Google Scholar]
- (4).Schultz KC, Supekova L, Ryu Y, Xie J, Perera R, Schultz PG. A Genetically Encoded Infrared Probe. J. Am. Chem. Soc. 2006;128:13984–13985. doi: 10.1021/ja0636690. [DOI] [PubMed] [Google Scholar]
- (5).Decatur SM. Elucidation of Residue-Level Structure and Dynamics of Polypeptides via Isotope-Edited Infrared Spectroscopy. Acc. Chem. Res. 2006;39:169–175. doi: 10.1021/ar050135f. [DOI] [PubMed] [Google Scholar]
- (6).Brewer SH, Song BB, Raleigh DP, Dyer RB. Residue Specific Resolution of Protein Folding Dynamics Using Isotope-Edited Infrared Temperature Jump Spectroscopy. Biochemistry. 2007;46:3279–3285. doi: 10.1021/bi602372y. [DOI] [PubMed] [Google Scholar]
- (7).Ye SX, Zaitseva E, Caltabiano G, Schertler GFX, Sakmar TP, Deupi X, Vogel R. Tracking G-Protein-Coupled Receptor Activation using Genetically Encoded Infrared Probes. Nature. 2010;464:1386–1389. doi: 10.1038/nature08948. [DOI] [PubMed] [Google Scholar]
- (8).Taskent-Sezgin H, Chung JA, Banerjee PS, Nagarajan S, Dyer RB, Carrico I, Raleigh DP. Azidohomoalanine: A Conformationally Sensitive IR Probe of Protein Folding, Protein Structure, and Electrostatics. Angew. Chem., Int. Ed. 2010;49:7473–7475. doi: 10.1002/anie.201003325. [DOI] [PMC free article] [PubMed] [Google Scholar]
- (9).Oh KI, Lee JH, Joo C, Han H, Cho M. β-Azidoalanine as an IR Probe: Application to Amyloid Aβ(16-22) Aggregation. J. Phys. Chem. B. 2008;112:10352–10357. doi: 10.1021/jp801558k. [DOI] [PubMed] [Google Scholar]
- (10).McMahon HA, Alfieri KN, Clark CAA, Londergan CH. Cyanylated Cysteine: A Covalently Attached Vibrational Probe of Protein-Lipid Contacts. J. Phys. Chem. Lett. 2010;1:850–855. doi: 10.1021/jz1000177. [DOI] [PMC free article] [PubMed] [Google Scholar]
- (11).Smith EE, Linderman BY, Luskin AC, Brewer SH. Probing Local Environments with the Infrared Probe: L-4-Nitrophenylalanine. J. Phys. Chem. B. 2011;115:2380–2385. doi: 10.1021/jp109288j. [DOI] [PubMed] [Google Scholar]
- (12).Hill SE, Bandaria JN, Fox M, Vanderah E, Kohen A, Cheatum CM. Exploring the Molecular Origins of Protein Dynamics in the Active Site of Human Carbonic Anhydrase II. J. Phys. Chem. B. 2009;113:11505–11510. doi: 10.1021/jp901321m. [DOI] [PMC free article] [PubMed] [Google Scholar]
- (13).Ganim Z, Chung HS, Smith AW, Deflores LP, Jones KC, Tokmakoff A. Amide I Two-Dimensional Infrared Spectroscopy of Proteins. Acc. Chem. Res. 2008;41:432–441. doi: 10.1021/ar700188n. [DOI] [PubMed] [Google Scholar]
- (14).Maekawa H, De Poli M, Toniolo C, Ge NH. Couplings between Peptide Linkages across a 3(10)-Helical Hydrogen Bond Revealed by Two-Dimensional Infrared Spectroscopy. J. Am. Chem. Soc. 2009;131:2042–2043. doi: 10.1021/ja807572f. [DOI] [PubMed] [Google Scholar]
- (15).Lindquist BA, Furse KE, Corcelli SA. Nitrile Groups as Vibrational Probes of Biomolecular Structure and Dynamics: An Overview. Phys. Chem. Chem. Phys. 2009;11:8119–8132. doi: 10.1039/b908588b. [DOI] [PubMed] [Google Scholar]
- (16).Silverman LN, Pitzer ME, Ankomah PO, Boxer SG, Fenlon EE. Vibrational Stark Effect Probes for Nucleic Acids. J. Phys. Chem. B. 2007;111:11611–11613. doi: 10.1021/jp0750912. [DOI] [PMC free article] [PubMed] [Google Scholar]
- (17).Krummel AT, Zanni MT. Evidence for Coupling between Nitrile Groups Using DNA Templates: A Promising New Method for Monitoring Structures with Infrared Spectroscopy. J. Phys. Chem. B. 2008;112:1336–1338. doi: 10.1021/jp711558a. [DOI] [PubMed] [Google Scholar]
- (18).Watson MD, Gai XS, Gillies AT, Brewer SH, Fenlon EE. A Vibrational Probe for Local Nucleic Acid Environments: 5-Cyano-2′-Deoxyuridine. J. Phys. Chem. B. 2008;112:13188–13192. doi: 10.1021/jp8067238. [DOI] [PubMed] [Google Scholar]
- (19).Gai XS, Fenlon EE, Brewer SH. A Sensitive Multispectroscopic Probe for Nucleic Acids. J. Phys. Chem. B. 2010;114:7958–7966. doi: 10.1021/jp101367s. [DOI] [PubMed] [Google Scholar]
- (20).Gai XS, Coutifaris BA, Brewer SH, Fenlon EE. A Direct Comparison of Azide and Nitrile Vibrational Probes. Phys. Chem. Chem. Phys. 2011;13:5926–5930. doi: 10.1039/c0cp02774j. [DOI] [PMC free article] [PubMed] [Google Scholar]
- (21).Cho MH. Coherent Two-Dimensional Optical Spectroscopy. Chem. Rev. 2008;108:1331–1418. doi: 10.1021/cr078377b. [DOI] [PubMed] [Google Scholar]
- (22).Shim SH, Strasfeld DB, Ling YL, Zanni MT. Automated 2D IR Spectroscopy Using a Mid-IR Pulse Shaper and Application of This Technology to the Human Islet Amyloid Polypeptide. Proc. Natl. Acad. Sci. U.S.A. 2007;104:14197–14202. doi: 10.1073/pnas.0700804104. [DOI] [PMC free article] [PubMed] [Google Scholar]
- (23).Zheng J, Kwak K, Fayer MD. Ultrafast 2D IR Vibrational Echo Spectroscopy. Acc. Chem. Res. 2007;40:75–83. doi: 10.1021/ar068010d. [DOI] [PubMed] [Google Scholar]
- (24).Tucker MJ, Gai XS, Fenlon EE, Brewer SH, Hochstrasser RM. 2D IR Photon Echo of Azido-Probes for Biomolecular Dynamics. Phys. Chem. Chem. Phys. 2011;13:2237–2241. doi: 10.1039/c0cp01625j. [DOI] [PMC free article] [PubMed] [Google Scholar]
- (25).Suydam IT, Snow CD, Pande VS, Boxer SG. Electric Fields at the Active Site of an Enzyme: Direct Comparison of Experiment with Theory. Science. 2006;313:200–204. doi: 10.1126/science.1127159. [DOI] [PubMed] [Google Scholar]
- (26).Zhang KC, Diehl MR, Tirrell DA. Artificial Polypeptide Scaffold for Protein Immobilization. J. Am. Chem. Soc. 2005;127:10136–10137. doi: 10.1021/ja051457h. [DOI] [PubMed] [Google Scholar]
- (27).Miyake-Stoner SJ, Miller AM, Hammill JT, Peeler JC, Hess KR, Mehl RA, Brewer SH. Probing Protein Folding Using Site-Specifically Encoded Unnatural Amino Acids as Fret Donors with Tryptophan. Biochemistry. 2009;48:5953–5962. doi: 10.1021/bi900426d. [DOI] [PubMed] [Google Scholar]
- (28).Fafarman AT, Webb LJ, Chuang JI, Boxer SG. Site-Specific Conversion of Cysteine Thiols into Thiocyanate Creates an IR Probe for Electric Fields in Proteins. J. Am. Chem. Soc. 2006;128:13356–13357. doi: 10.1021/ja0650403. [DOI] [PMC free article] [PubMed] [Google Scholar]
- (29).Bradley DH, Hanna MM. Synthesis and Utility of 5-Thiocyanato Deoxyuridine and Uridine Phosphoramidites as Masked Synthons. Tetrahedron Lett. 1992;33:6223–6226. [Google Scholar]
- (30).Tucker MJ, Kim YS, Hochstrasser RM. 2D IR Photon Echo Study of the Anharmonic Coupling in the OCN Region of Phenyl Cyanate. Chem. Phys. Lett. 2009;470:80–84. doi: 10.1016/j.cplett.2009.01.025. [DOI] [PMC free article] [PubMed] [Google Scholar]
- (31).Kinnaman CS, Cremeens ME, Romesberg FE, Corcelli SA. Infrared Line Shape of an Alpha-Carbon Deuterium-Labeled Amino Acid. J. Am. Chem. Soc. 2006;128:13334–13335. doi: 10.1021/ja064468z. [DOI] [PubMed] [Google Scholar]
- (32).Weinkam P, Zimmermann J, Sagle LB, Matsuda S, Dawson PE, Wolynes PG, Romesberg FE. Characterization of Alkaline Transitions in Ferricytochrome c Using Carbon-Deuterium Infrared Probes. Biochemistry. 2008;47:13470–13480. doi: 10.1021/bi801223n. [DOI] [PMC free article] [PubMed] [Google Scholar]
- (33).Lieber E, Rao CNR, Thomas AE, Oftedahl E, Minnis R, Nambury CVN. Infrared Spectra of Acid Azides, Carbamyl Azides and Other Azido Derivatives. Anomalous Splittings of the N3 Stretching Bands. Spectrochim. Acta. 1963;19:1135–1144. [Google Scholar]
- (34).Dyall LK, Kemp JE. Infrared Spectra of Aryl Azides. Aust. J. Chem. 1967;20:1395–1402. [Google Scholar]
- (35).Nydegger MW, Dutta S, Cheatum CM. Two-Dimensional Infrared Study of 3-Azidopyridine as a Potential Spectroscopic Reporter of Protonation State. J. Chem. Phys. 2010;133:134506. doi: 10.1063/1.3483688. [DOI] [PubMed] [Google Scholar]
- (36).Reimers JR, Hall LE. The Solvation of Acetonitrile. J. Am. Chem. Soc. 1999;121:3730–3744. [Google Scholar]
- (37).Reich P, Martin D. Cyansaureester. 4. Molekulspektroskopische Untersuchungen an Cyansaureestern. Chem. Ber. 1965;98:2063–2069. [Google Scholar]
- (38).Bertran JF, Balleste L, Dobrihal L, Sanchez N, Arrieta R. Study of Fermi Resonance by Method of Solvent Variation. Spectrochim. Acta, Part A. 1968;A 24:1765–1776. [Google Scholar]
- (39).Kondratyuk P. Analytical Formulas for Fermi Resonance Interactions in Continuous Distributions of States. Spectrochim. Acta, Part A. 2005;61:589–593. doi: 10.1016/j.saa.2004.05.010. [DOI] [PubMed] [Google Scholar]
- (40).Duncan JL. The Determination of Vibrational Anharmonicity in Molecules from Spectroscopic Observations. Spectrochim. Acta, Part A. 1991;47:1–27. [Google Scholar]
Associated Data
This section collects any data citations, data availability statements, or supplementary materials included in this article.