Abstract
The molecular basis for aging of the kidney is not well understood. MicroRNAs (miRNAs) contribute to processes such as development, differentiation, and apoptosis, but their contribution to the aging process is unknown. Here, we analyzed the miRNA expression profile of young (3-month) and old (24-month) rat kidneys and identified the biologic pathways and genes regulated by differentially expressed miRNAs. We observed upregulation of 18 miRNAs with aging, mainly regulating the genes associated with energy metabolism, cell proliferation, antioxidative defense, and extracellular matrix degradation; in contrast, we observed downregulation of 7 miRNAs with aging, principally targeting the genes associated with the immune inflammatory response and cell-cycle arrest. Bioinformatics analysis suggested that superoxide dismutase 2 (SOD2) and thioredoxin reductase 2 (Txnrd2), located in the mitochondria, are potential targets of miR-335 and miR-34a, respectively. Aging mesangial cells exhibited significant upregulation of miR-335 and miR-34a and marked downregulation of SOD2 and Txnrd2. miR-335 and miR-34a inhibited expression of SOD2 and Txnrd2 by binding to the 3′-untranslated regions of each gene, respectively. Overexpression of miR-335 and miR-34a induced premature senescence of young mesangial cells via suppression of SOD2 and Txnrd2 with a concomitant increase in reactive oxygen species (ROS). Conversely, antisense miR-335 and miR-34a inhibited senescence of old mesangial cells via upregulation of SOD2 and Txnrd2 with a concomitant decrease in ROS. In conclusion, these results suggest that miRNAs may contribute to renal aging by inhibiting intracellular pathways such as those involving the mitochondrial antioxidative enzymes SOD2 and Txnrd2.
Kidney aging is an important clinical problem, not only because normal aging reduces renal function but also because of the high frequency of ESRD, renal cancer, and renal failure in elderly people. Renal aging is of interest as a general model for organ aging because renal function can be quantitatively assessed more readily than that of other organs in clinical practice.1 At the present time, the molecular basis of renal aging is not clearly known. For example, nothing is known of the role of microRNAs (miRNAs) in the aging process of organs.
miRNAs are a novel class of small, regulatory, noncoding RNA molecules that inhibit the expression of multiple genes at the post-transcriptional level. miRNAs have been found to play a crucial role in development, differentiation, apoptosis, and metabolism and are involved in the pathogenesis of many human diseases.2,3 Bioinformatics studies suggest that miRNAs may regulate >60% of all human genes.4,5 Studies have shown that overexpression of miRNA lin-4 increases longevity in Caenorhabditis elegans, whereas loss of lin-4 leads to a reduced lifespan.6 However, it is currently unclear whether miRNAs play an important role during the aging process in higher organisms, and any miRNAs involved in mammalian aging have yet to be identified. In this study, alterations in the level of miRNA expression during kidney aging were investigated using a miRNA chip, the target genes of the differentially expressed miRNAs were predicted using bioinformatics, and a global analysis of the biologic pathways and genes regulated by miRNAs was performed. Furthermore, we investigated whether miR-335 and miR-34a induce renal mesangial cell senescence by inhibiting the functioning of their corresponding target genes, mitochondrial superoxide dismutase 2 (SOD2) and thioredoxin reductase 2 (Txnrd2).
RESULTS
Morphologic Changes in Aged Rat Kidney Tissues
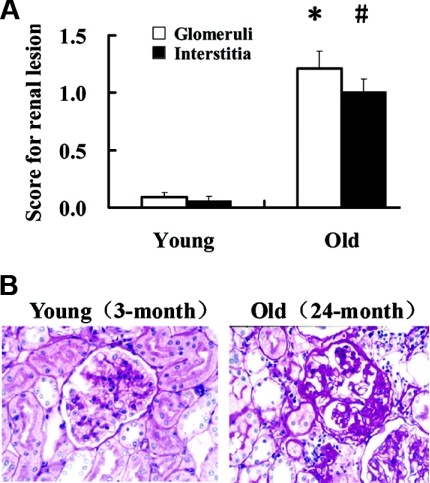
Renal histologic changes in young (3-month) and old (24-month) male Wistar rats were evaluated by periodic acid–Schiff (PAS) staining. Compared with young renal tissues, old renal tissues showed marked pathologic features of aging, including occasional focal segmental glomerular sclerosis, interstitial fibrosis and atrophy of renal tubules, and some inflammatory cell infiltration. Semiquantitative scoring for renal structural changes showed that the lesions in the aged renal tissues were significantly increased compared with those in young kidneys (Figure 1).
Figure 1.
The lesions in the aged renal tissues were significantly increased. (A) Semiquantitative analyses of the renal lesions in aged rats. Glomerular scoring: *P < 0.01 versus young. Interstitial scoring: #P < 0.01 versus young. (B) Histologic analysis of 3- and 24-month rat renal tissues by PAS staining. In some glomeruli, focal segmental glomerular sclerosis may exist occasionally.
Changes in the miRNA Expression Profile in Old Renal Tissues
To investigate whether miRNAs play a significant role in the aging process of organs, a miRNA microfluidic chip was used to analyze the miRNA expression profile in old renal tissues.7 The level of miRNA expression in old kidneys was compared with that in young kidneys. The results (Table 1) showed that 25 miRNAs were significantly differentially expressed during renal aging. Of these, 18 miRNAs exhibited increased expression (the log2 ratio of old/young signal intensity was >2). Among these miRNAs, rno-miR-184, rno-miR-335, and rno-miR-542–3p were upregulated by more than a 4-fold change in the log2 ratio. Only seven miRNAs were significantly downregulated (the log2 ratio was less than −2) in old kidneys. This shows that among these differentially expressed miRNAs, most miRNAs were upregulated during normal renal aging.
Table 1.
The significantly differentially expressed miRNAs in aging kidney
| Upregulated miRNA Name | Fold Change log2 (old/young) | Downregulated miRNA Name | Fold Change log2 (old/young) |
|---|---|---|---|
| rno-miR-184 | 7.00 | rno-miR-347 | −3.47 |
| rno-miR-335 | 4.62 | rno-miR-494 | −2.79 |
| rno-miR-542-3p | 4.18 | rno-miR-290 | −2.60 |
| rno-miR-212 | 3.63 | rno-miR-129 | −2.41 |
| rno-miR-142-5p | 3.34 | rno-miR-378 | −2.27 |
| rno-miR-333 | 3.22 | rno-miR-378a | −2.15 |
| rno-miR-223 | 2.95 | rno-miR-451 | −2.03 |
| rno-miR-340-5p | 2.87 | rno-miR-365 | −1.79 |
| rno-miR-21 | 2.84 | rno-miR-329 | −1.73 |
| rno-miR-708 | 2.80 | rno-miR-339 | −1.72 |
| rno-miR-7a | 2.71 | ||
| rno-miR-132 | 2.69 | ||
| rno-miR-224 | 2.60 | ||
| rno-miR-34a | 2.21 | ||
| rno-miR-34ca | 2.21 | ||
| rno-miR-351 | 2.18 | ||
| rno-miR-141 | 2.04 | ||
| rno-miR-350 | 2.00 |
a represents *.
Confirmation of the Differentially Expressed miRNAs
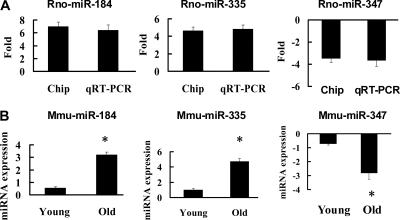
To investigate the reliability of the miRNA microarray results, three miRNAs (rno-miR-184, rno-miR-335, and rno-miR-347) were selected for further verification using quantitative real-time PCR (qRT-PCR). The results showed that all of these miRNAs exhibited statistically significant differential expression between young and old rat renal tissues (Figure 2A). Some rat strains, such as Sprague–Dawley and Fisher 344, often develop chronic progressive nephrosis (CPN), a renal age-dependent phenotype, during the second year of life.8,9 To exclude the possibility that the above-mentioned changes in miRNA levels in old rat kidneys were caused by CPN rather than renal aging, we analyzed the changes in expression levels of miR-184, miR-335, and miR-347 in aged kidneys (24 months old) of mice, which do not develop CPN, using qRT-PCR. The results showed that these miRNAs were also significantly differentially expressed during mouse renal aging (Figure 2B).
Figure 2.
miR-184, miR-335 and miR-347 exhibited differential expressions in (A) aged rats and (B) mice. (A) Fold differences between old and young rat kidneys measured by chip and qRT-PCR. (B) Expression levels of mmu-miR-184, mmu-miR-335, and mmu-miR-347 in the aged mouse kidneys detected by qRT-PCR. n = 5 per miRNA. *P < 0.01 versus young.
Key Biologic Pathways and Genes Regulated by miRNAs in Aged Kidneys
To screen the key miRNAs implicated in the regulation of renal aging and to determine the probable functional roles of these miRNAs, three algorithms (TargetScan, PicTar, and miRanda) were used to further analyze the target genes of the above differentially expressed miRNAs. As expected, each of these miRNAs has a multitude of different target genes; some miRNAs share common mRNA targets, which then have a higher probability of being suppressed by the miRNAs. For example, rno-miR-184, rno-miR-335, and rno-miR-7a upregulated in old kidneys all target the antioxidative SODs.
We then collected these target genes and performed gene ontology (GO) term analysis, including biologic process and molecular function, and Kyoto Encyclopedia of Genes and Genomes (KEGG) pathway analysis using the DAVID gene annotation tool to interpret the biologic functions, biologic processes, and biologic pathways of these miRNA targets. The results of GO and KEGG pathway analyses showed that the miRNAs upregulated in old kidneys mainly target the genes in biologic pathways involved in the antioxidative system (Table 2), energy metabolism (Supplemental Table 1), cell mitosis and proliferation (Supplemental Table 2), and extracellular matrix (ECM) degradation (Supplemental Table 3). Although some of these pathways and genes have been shown to participate in the modulation of the renal aging process, most have never been reported to play a role in renal aging. For example, it has been found that rno-miR-184 targets antioxidative genes such as [copper-zinc] superoxide dismutase and glutathione peroxidase (Gpx) 3, ECM-degradative gene membrane-type matrix metalloproteinase 3, and the longevity-related genes sirtuin 3 and 7. Rno-miR-335 targets the antioxidative genes Gpx 2, mitochondrial SOD2, and thioredoxin-like protein 1. In short, these miRNAs upregulated in old kidneys may play a critical regulatory role during the renal aging process by suppressing the expression of these target genes.
Table 2.
Antioxidation-related miRNAs differentially expressed in old kidney and their target genes
| miRNA Upregulated | Target Gene Symbol | Target Gene Name Predicted |
|---|---|---|
| rno-miR-132, 335, 351 | Gpx2 | Glutathione peroxidase 2 |
| rno-miR-184 | Gpx3 | Glutathione peroxidase 3 |
| rno-miR-223, 21 | Gpx5 | Glutathione peroxidase 5 |
| rno-miR-333 | Gpx6, Gpx7 | Glutathione peroxidase 6, 7 |
| rno-miR-340-5p | Gsta2 | Glutathione S-transferase a2 |
| rno-miR-333 | Gstt1 | Glutathione S-transferase t1 |
| rno-miR-214 | Gstz1, Gstm1 | Glutathione S-transferase z1, m1 |
| rno-miR-335 | SOD2 | Mitochondrial superoxide dismutase |
| rno-miR-184, 7a | SOD3 | Extracellular superoxide dismutase |
| rno-miR-224, 7a | CAT | Catalase |
| rno-miR-335, 708, 542–3p, 7a Txnl1 | Thioredoxin-like protein 1 | |
| rno-miR-224 | Txnl2 | Thioredoxin-like protein 2 |
| rno-miR-132, 142-5p, 708 Txnl5 | Thioredoxin-like protein 5 | |
| rno-miR-132, 212 | Txnrd1 | Thioredoxin reductase 1 |
| rno-miR-708, 34a | Txnrd2 | Mitochondrial thioredoxin reductase 2 |
| rno-miR-334 | Txndc9 | Thioredoxin domain-containing protein 9 |
| rno-miR-34c | Txndc11 | Thioredoxin domain-containing protein 11 |
| rno-miR-34c | Prdx2 | Peroxiredoxin 2 |
| rno-miR-708 | Prdx3 | Peroxiredoxin 3 |
| rno-miR-333, 351 | MT | Metallothionein |
On the other hand, the results from the GO and KEGG pathway analyses indicated that the miRNAs downregulated in senescent kidneys principally target immune and inflammatory response genes (Supplemental Table 4), cell cycle arrest genes such as p21 and p16Ink4a (Supplemental Table 2), and ECM synthesis genes (Supplemental Table 3). Some of these targets have been found to be upregulated in aging renal tissues. Our analyses also revealed that many miRNAs target a common gene. For example, the upregulated miR-335, miR-224, and miR-21 all repress proliferating cell nuclear antigen.
Isolation and Identification of Primary Renal Residential Cells
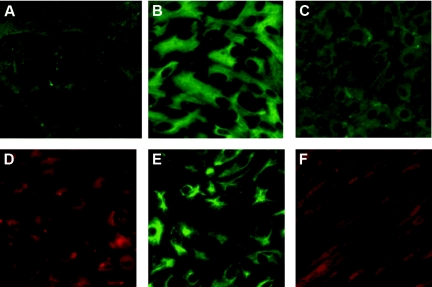
The primary renal cells were isolated, and their purity was identified by means of immunofluorescence staining with antibodies against the specific markers of the renal cells. The results showed that almost all mesangial cells showed positive reaction for desmin and vimentin, markers of the mesangial cells (Figure 3, A and B). The glomerular endothelial and epithelial cells stained positively for their corresponding specific markers, platelet/endothelial cell adhesion molecule-1 (CD31) (Figure 3C) and nephrin (Figure 3D), respectively. The tubular epithelial cells and interstitial fibroblasts respectively showed positive reaction against their corresponding specific markers, cytokeratin 18 (Figure 3E) and fibroblast-specific protein-1 (FSP-1) (Figure 3F).
Figure 3.
The purity of the primary renal cells was identified by immunofluorescence staining. (A and B) The glomerular mesangial cells were stained with antibodies against desmin and vimentin. (C and D) The glomerular endothelial and epithelial cells were stained with antibodies against CD31 and nephrin, respectively. (E and F) The tubular epithelial cells and interstitial fibroblasts were stained with antibodies against cytokeratin 18 and FSP-1, respectively. Green color: fluorescein isothiocyanate-labeled secondary antibodies were used; red color: tetramethyl rhodamine isothiocyanate-labeled secondary antibodies were used.
Expression Levels of miR-335 and miR-34a in the Aging Renal Residential Cells
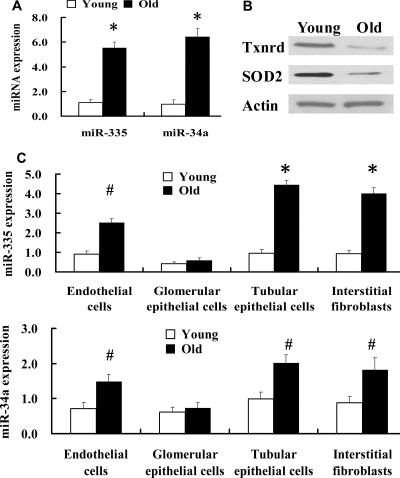
To further establish a role of miRNAs in the senescence of renal mesangial cells, we compared the expression levels of two highly expressed miRNAs (miR-335 and miR-34a) in old versus young rat primary glomerular mesangial cells using qRT-PCR. We found that miR-335 and miR-34a were significantly upregulated in aging mesangial cells (Figure 4A), suggesting that both miRNAs may play a primary role in the aging process of mesangial cells. The expression levels of miR-335 and miR-34a were also analyzed quantitatively in other types of primary renal residential cells isolated from young and old kidneys. As shown in Figure 4C, miR-335 and miR-34a were significantly upregulated in aging tubular epithelial cells and interstitial fibroblasts, upregulated to some extent in aging endothelial cells, and not upregulated significantly in aging glomerular epithelial cells.
Figure 4.
Expressions of miR-335 and miR-34a in aging mesangial cells, endothelial cells, tubular epithelial cells and interstitial fibroblasts were significantly upregulated and expressions of SOD2 and Txnrd2 in aging mesangial cells were downregulated. (A) Expression levels of miR-335 and miR-34a in aging renal mesangial cells were detected by qRT-PCR. n = 5 per miRNA. *P < 0.01 versus young. (B) Levels of SOD2 and Txnrd2 proteins were analyzed by Western blot in aging renal mesangial cells. The graph is representative of three separate experiments. (C) Expression levels of miR-335 and miR-34a were detected by qRT-PCR in the aging glomerular epithelial cells, endothelial cells, tubular epithelial cells, and fibroblasts. n = 5 per miRNA. *P < 0.01 versus young, #P < 0.05 versus young.
Expressions of miR-335 and miR-34a Were Inversely Correlated with Those of Their Potential Target Genes SOD2 and Txnrd2 in Aging Mesangial Cells
The above-mentioned computational analyses for miRNA targets identified homology between miR-335 and the 3′-untranslated regions (UTRs) of the SOD2 mRNA, establishing this gene as a potential molecular target of miR-335. Bioinformatic analyses also revealed that mitochondrial Txnrd (Txnrd2) is a potential target of miR-34a.
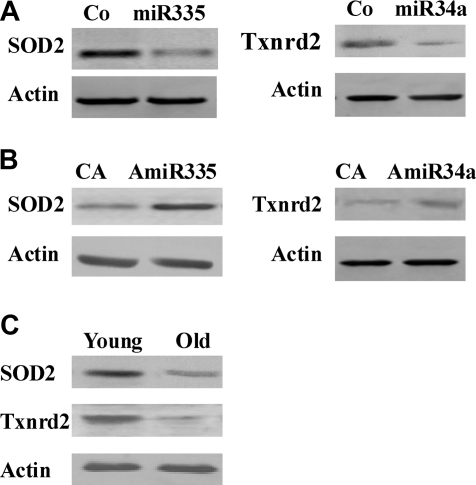
Recent studies have demonstrated that aging is associated with an increase in oxidative damage to biomolecules, which may be due to an insufficiency of antioxidants such as superoxide dismutase (SOD), Gpx, catalase, and Txnrd. For example, it has been shown that overexpression of catalase in mitochondria can extend the lifespan of transgenic mice.10 To verify the correlation between miR-335 and its predicted target gene, we analyzed the expression level of SOD2 in old mesangial cells by Western blot. The results confirmed that, in the same cells, expression of the protein was correspondingly downregulated (Figure 4B), demonstrating that the expression level of the miR-335 target protein was inversely correlated with that of the corresponding miR-335. Similarly, Western blot analysis showed that the expression level of miR-34a was negatively correlated with that of its target gene, Txnrd2, in old mesangial cells (Figure 4B). These results suggest that miR-335 and miR-34a potentially play an important regulatory role in the aging process in mesangial cells.
SOD2 and Txnrd2 are Potential Target Genes of miR-335 and miR-34a, Respectively
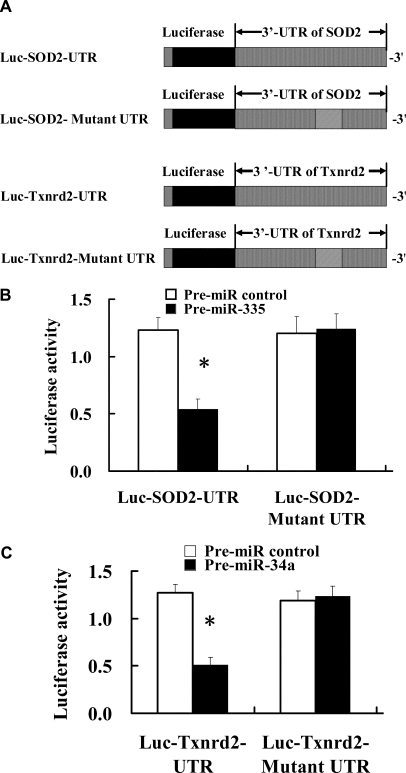
To determine the target genes of miR-335 and miR-34a, we selected SOD2 and Txnrd2 localized in mitochondria as candidate target genes of miR-335 and miR-34a, respectively. The 3′-UTRs of SOD2 and Txnrd2, which respectively contain consensus-binding sequences of miR-335 and miR-34a, were PCR amplified and inserted downstream of the luciferase reporter cDNA gene in the pGL3 vector to construct Luc-SOD2-UTR and Luc-Txnrd2-UTR vectors (Figure 5A) so as to explore the effect of miR-335 and miR-34a on expression of SOD2 and Txnrd2 proteins. The results indicated that cotransfection of premiR-335 and premiR-34a (mimics, to mimic mature miR-335 and miR-34a) with Luc-SOD2-UTR and Luc-Txnrd2-UTR in mesangial cells resulted in 57% and 63% inhibition of luciferase activity, respectively, compared with samples with control miRNA (Figure 5, B and C). To further confirm that miR-335 and miR-34a acted via binding to the 3′-UTRs of SOD2 and Txnrd2, the binding elements in the 3′-UTRs of SOD2 and Txnrd2 were mutated. The results indicate that cotransfection of premiR-335 and premiR-34a with the mutated Luc-3′-UTR constructs (Luc-SOD2-mutant UTR and Luc-Txnrd2-mutant UTR) had no marked effect on luciferase activity (Figure 5, B and C).
Figure 5.
SOD2 and Txnrd2 were potential target genes of miR-335 and miR-34a, respectively. (A) Construction of luciferase-wild-type UTR vectors (Luc-SOD2-UTR and Luc-Txnrd2-UTR) and the corresponding luciferase-mutated UTR vectors (Luc-SOD2-mutant UTR and Luc-Txnrd2-mutant UTR). (B) The effect of miR-335 on luciferase activity in mesangial cells cotransfected with miR-335 mimic (premiR-335) and Luc-SOD2-UTR vector or Luc-SOD2-mutant UTR. *P < 0.05 versus premiR control. (C) The effect of miR-34a on luciferase activity in mesangial cells cotransfected with miR-34a mimic (premiR-34a) and Luc-Txnrd2-UTR vector or Luc-Txnrd2-mutant UTR. *P < 0.05 versus premiR control.
miR-335 and miR-34a Mimics Downregulated Expressions of Endogenous SOD2 and Txnrd2 in Young Mesangial Cells
To further validate the hypothesis that miR-335 and miR-34a negatively regulate expression of SOD2 and Txnrd2, respectively, we transfected young mesangial cells with premiR-335 and premiR-34a or with corresponding control miRNAs. The Western blot revealed that levels of SOD2 and Txnrd2 were significantly decreased in the young cells transfected with premiR-335 and premiR-34a compared with the controls (Figure 6A).
Figure 6.
(A) miR-335 and miR-34a mimics inhibit SOD2 and Txnrd2 expressions in young mesangial cells, and (B) antisense miR-335 and miR-34a increase SOD2 and Txnrd2 expressions in aging mesangial cells. Co, miRNA control; CA, antisense miRNA control; miR335 and miR34a, miR-335 and miR-34a mimics, respectively; AmiR335 and AmiR34a, antisense miR-335 and miR-34a inhibitors, respectively. (C) Analysis of expression levels of SOD2 and Txnrd2 by Western blot in aged renal tissues. The graph is representative of three separate experiments.
Antisense miR-335 and miR-34a Upregulated Expressions of SOD2 and Txnrd2 in Aging Mesangial Cells
Next, we transfected aging mesangial cells with antisense miR-335 and miR-34a inhibitors or with corresponding control miRNAs. The Western blots demonstrated that after transfection with antisense miR-335 and miR-34a, the expression levels of SOD2 and Txnrd2 were significantly increased in aging cells compared with the controls (Figure 6B). To strengthen the significance of these in vitro results, the expression levels of the candidate genes SOD2 and Txnrd2 regulated by miR-335 and miR-34a were observed in aging rat renal tissues in vivo. The results revealed that both genes were downregulated in the aged kidneys in vivo (Figure 6C).
miR-335 and miR-34a Mimics Induced Premature Senescent Phenotypes in Young Mesangial Cells
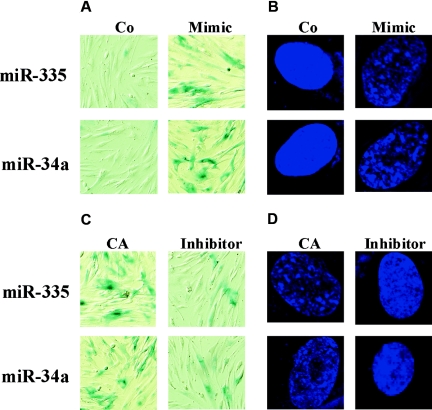
To investigate the role of miR-335 and miR-34a in the senescence of renal mesangial cells, premiR-335 and premiR-34a were transfected into young mesangial cells, and senescence-associated β-galactosidase (SA-β-gal) activity (a biomarker of cellular senescence) and senescence-associated heterochromatic foci (SAHF) formation (a novel specific biomarker of senescent cells) were observed.11 SA-β-gal-staining results showed that in young cells, overexpression of miR-335 and mi-R34a after transfection increased significantly the percentage of SA-β-gal-positive cells compared with the control (Figure 7A). As shown in Figure 7B, overexpression of miR-335 and miR-34a also led to pronounced DNA SAHF formation, which was visualized by 4′-6′-diamidino-2-phenylindole (DAPI) staining. By contrast, the cells in the control group displayed relatively uniform staining patterns.
Figure 7.
miR-335 and miR-34a mimics induce premature senescent phenotypes in young mesangial cells, and antisense miR-335 and miR-34a relieve senescent phenotypes in old mesangial cells. (A) SA-β-gal staining in young mesangial cells transfected with miR-335 and miR-34a mimics. Blue precipitation in the cytoplasm was observed in the senescent cells. (B) Analysis of SAHF formation in young mesangial cells transfected with miR-335 and miR-34a mimics. The cells were stained with DAPI, and heterochromatin foci were observed in the senescent cells. (C) SA-β-gal staining in aging mesangial cells transfected with antisense miR-335 and miR-34a inhibitors. (D) Analysis of SAHF formation in aging mesangial cells transfected with antisense miR-335 and miR-34a inhibitors. Co, miRNA control; CA, antisense miRNA control. The above results of SA-β-gal staining and SAHF analysis are representative images of three experiments.
Antisense miR-335 and miR-34a Delayed the Senescence Process in Old Mesangial Cells
Aging mesangial cells were transfected with antisense miR-335 and miR-34a inhibitors or corresponding control miRNAs. The SA-β-gal and DAPI staining results revealed that after transfection, the percentage of SA-β-gal-positive cells (Figure 7C) and the formation rate of SAHF (Figure 7D) decreased significantly compared with the controls.
miR-335 and miR-34a Modulated Oxidative Stress Level in Mesangial Cells
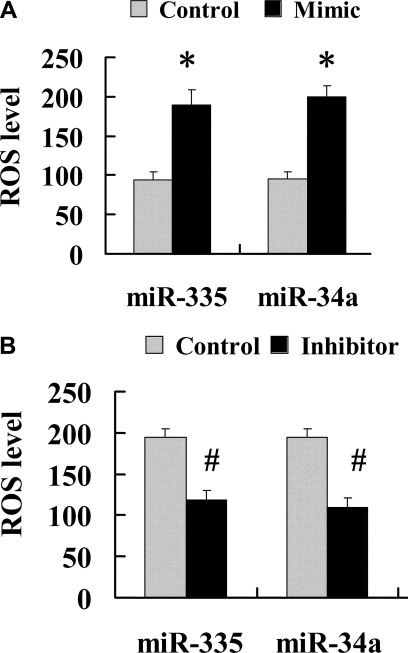
To confirm that miR-335 and miR-34a induced premature senescence in young mesangial cells by inhibiting the antioxidative function of their target genes, SOD2 and Txnrd2, respectively, thereby augmenting the oxidative stress level in the cells, we next determined the levels of reactive oxygen species (ROS) in the young mesangial cells transfected with premiR-335 and premiR-34a. The results showed that the ROS levels were significantly elevated in young mesangial cells transfected with premiR-335 and premiR-34a (Figure 8A). By contrast, in aging mesangial cells transfected with antisense miR-335 and miR-24a inhibitors, the ROS levels were significantly decreased (Figure 8B).
Figure 8.
miR-335 and miR-34a mimics significantly elevated ROS levels in young mesangial cells and miR-335 and miR-34a inhibitors significantly decreased ROS levels in aging mesangial cells. (A) Level of ROS was determined in young mesangial cells transfected with miR-335 and miR-34a mimics. *P < 0.01 versus control. (B) Level of ROS was determined in old mesangial cells transfected with antisense miR-335 and miR-34a inhibitors. #P < 0.05 versus control.
DISCUSSION
The mechanisms of renal organ aging are currently unknown. Studies have found that in the aged kidney and brain, expression of oxidative defense proteins such as SOD, catalase, Gpx, and peroxiredoxins are downregulated,12–14 leading to reduced antioxidant capacity. This could be the result of post-transcriptional suppression by miRNAs. Therefore, we postulate that miRNA may play a very important role in the regulation of renal aging.
In this study, the role of miRNAs during renal aging in rats was investigated using a miRNA chip. We have observed significant age-related changes in miRNA expression in old kidneys. Among these differentially expressed miRNAs, most miRNAs were upregulated, and a few miRNAs were downregulated. To gain further insights into the role of miRNAs in renal aging, the target genes of the differentially expressed miRNAs in aging kidneys were determined. The biologic function and biologic pathways of these targets were analyzed. The results revealed that the miRNAs upregulated in aging kidneys mainly regulate the pathways or genes associated with energy metabolism, cell proliferation, antioxidative defense, and ECM degradation, whereas the downregulated miRNAs principally target the pathways or genes related to immune inflammatory response and cell-cycle arrest. For example, rno-miR-184, rno-miR-335, rno-miR-34a, rno-miR-224, and rno-miR-7a upregulated in old kidneys were found to target antioxidative genes such as Gpx, SOD, catalase, and Txnrd. This suggests that these miRNAs may be implicated in an aging mechanism related to oxidative stress. Under physiologic conditions, antioxidative gene products play major roles in the detoxification of ROS. Decreased expression and activity of these antioxidative genes induced by high expression of miRNAs in the aging kidney expose the organism to higher oxidative stress and cellular injury. A previous study found that the expression and activity of SOD and Gpx decrease with age in rat kidneys.14 Therefore, the increase in expression level of these miRNAs in old kidneys may contribute to the oxidative damage associated with aging by inhibiting expression of the antioxidative target genes and increasing the oxidative stress level.
The antioxidative enzymes SOD2 and Txnrd2 are located in the mitochondria and may play a key role in modulating cellular aging by detoxifying ROS generated in the mitochondria. Because miR-335 and miR-34a/708 were predicted to target SOD2 and Txnrd2, respectively, we selected two highly expressed miRNAs (miR-335 and miR-34a) in the aging renal tissues to further investigate whether both play a modulating role in renal mesangial cell senescence. Here, we have shown that in the aging mesangial cells, the expression levels of miR-335 and miR-34a were significantly upregulated, whereas the predicted target genes (SOD2 and Txnrd2) of miR-335 and miR-34a were markedly downregulated. miR-335 and miR-34a could inhibit SOD2 and Txnrd2 expression through binding to the corresponding binding sites in the 3′-UTRs of SOD2 and Txnrd2 genes. In young mesangial cells, miR-335 and miR-34a induced premature senescent phenotypes via suppression of SOD2 and Txnrd2 expression with a concomitant increase in ROS levels. Conversely, antisense miR-335 and miR-34a reduced senescent phenotypes by upregulating SOD2 and Txnrd2 expression and lowering ROS levels in old mesangial cells. miR-34a has also been found to be upregulated in aging mouse brains and human diploid fibroblasts.12,15 These results suggest that miRNAs may regulate the aging process by modulating genes involved in the scavenging of ROS in mitochondria because mitochondria are major sites of intracellular ROS production. The free-radical theory of aging suggests that if production of ROS exceeds the capacity of the antioxidative system to remove the ROS, oxidative damage occurs to intracellular biologic macromolecules such as DNA, protein, and lipids, leading to aging.16 In conclusion, this study demonstrates that miRNAs may play a crucial role during renal aging by regulating the expression of some key target genes in multiple pathways. miR-335 and miR-34a can modulate mesangial cell senescence via inhibition of the expression and function of the mitochondrial antioxidative enzymes SOD2 and Txnrd2.
CONCISE METHODS
Preparation of miRNA Microarray
The miRNA probe sets used in this study were composed of 711 human miRNAs, 568 mouse miRNAs, 348 rat miRNAs, and positive and negative controls, which included all miRNA bases (on the basis of Sanger miRBase version 10.0, http://microrna.sanger.ac.uk/). LC Sciences (Houston, TX) provided the miRNA microarray chip (μParaflo microfluidic chip). The detection probes were made by in situ synthesis using photogenerated reagent chemistry. On the microfluidic chip, each detection probe consisted of two parts: a chemically modified antisense oligonucleotide fragment, which is complimentary to the corresponding miRNA or control RNA, and a spacer segment of polyethylene glycol, which extended the antisense fragment away from the chip substrate and decreased space hindrance in the hybridization process. Every miRNA probe on each chip was repeated 3 times.
Tissue Sample and Histology
Male Wistar rats and male C57BL/6 mice were purchased from the Vital River Laboratory Animal Technology, Co., Ltd. (Beijing, China). The kidney tissues from 3- (young) and 24-month (old) rats and mice were collected and placed immediately into either liquid nitrogen or 10% neutral buffered formalin. Formalin-fixed kidney tissues were paraffin embedded, and 4-μm sections were cut. Sections were stained with PAS and examined under a light microscope at ×200 magnification for age-associated changes. Semiquantitative scoring was used to evaluate the lesions in the aged kidneys. The severity of glomerular lesions was graded from 0 to 4 as follows: 0 represents no lesion; 1 represents lesions of <25% of the glomerulus; and 2, 3, and 4 represent lesions of 25 to 50, 50 to 75, and >75% of the glomerulus, respectively. The degree of interstitial lesions was graded from 0 to 3 on the basis of cast, tubular atrophy, interstitial inflammation, and fibrosis.
miRNA Labeling and Microarray Hybridization
Small RNAs were isolated from total RNAs using an YM-100 Microcon centrifuge filter column (Millipore). The enriched small RNAs were 3′-extended with a poly (A) tail using poly (A) polymerase. An oligonucleotide tag was then ligated to the poly (A) tail for subsequent fluorescent dye labeling. The small RNA samples from young and old rat renal tissues were labeled with Cy3 or Cy5 fluorescence dyes (Amersham Pharmacia, Piscataway, NJ), respectively. Hybridization on a μParaflo microfluidic chip was performed overnight at 34°C in 100 μl 6× SSPE buffer (0.9 M sodium chloride, 60 mM sodium hydrogen phosphate, 6 mM EDTA, pH 6.8) containing 25% formamide using a microcirculation pump (Atactic Technologies, Houston, TX). After hybridization, the hybridized chips were washed and then scanned using a GenePix 4000B laser scanner (Molecular Devices, Sunnyvale, CA) to collect and quantify hybridization images.
Data Analysis
Fluorescence intensities for each spot were scanned and calculated using Array-Pro image analysis software (Media Cybernetics, Bethesda, MD) after subtracting the local background (on the basis of the median intensity of the area surrounding each spot) from the total intensities. A miRNA was considered detectable on an array if the intensity of its fluorescence was significantly above negative controls. Median values of the nine spots (three replicate probes in every chip, three chips used for hybridization) for each probe were calculated, and the signal from each spot was then normalized to the average signal of the whole block using a LOWESS filter (Locally Weighted Regression). A miRNA was considered to be differentially expressed between old and young rat kidneys if the P value of the t test was <0.01. The ratio of old sample signal versus young sample signal was log2 transformed. If the log2 ratio is positive, a miRNA is upregulated; if the log2 ratio is negative, a miRNA is downregulated.
Validation of Individual miRNA Expression Using qRT-PCR
Expression levels of individual miRNA were quantified using qRT-PCR with TaqMan. The methods were similar to conventional real-time PCR, with modifications that allowed detection of the short, mature miRNAs. To avoid any bias introduced during the miRNA enrichment procedure, total RNA samples were used in these analyses, and 5S ribosomal RNA was used as an internal normalizer. The kidney tissues were collected from 3- (young) and 24-month (old) male Wistar rats and male C57BL/6 mice from the Vital River Laboratory Animal Technology Co., Ltd. (Beijing, China).
Prediction and GO and Pathway Analyses of the miRNA Target Genes
Three bioinformatics algorithms were used to computationally predict the target genes of the differentially expressed miRNAs in the aged kidneys, including miRanda (http://microrna.sanger.ac.uk/targets/v4.0), PicTar (http://pictar.bio.nyu.edu/), and TargetScan 3.1 (http://www.targetscan.org/). To fully inspect the function of the differentially expressed miRNAs, we collected the reported and predicted miRNA targets from the Sanger database (http://microrna.sanger.ac.uk/) and performed GO term analysis. GO analysis was applied to organize genes into hierarchical categories and uncover the miRNA gene regulatory network on the basis of biologic process and molecular function; the network of miRNA-mRNA interaction, representing the critical miRNAs and their targets, was established according to the miRNA degree. Meanwhile, the miRNA targets were subjected to KEGG pathway annotation (http://www.genome.jp/kegg/) using the DAVID gene annotation tool (http://david.abcc.ncifcrf.gov/).
Isolation and Identification of Primary Renal Residential Cells
Primary mesangial cells of renal glomeruli from male Wistar rats at the ages of 2 (young) and 24 (old) months were isolated and cultured as described previously.17,18 Briefly, cortices were separated from medullas, cut into small pieces, incubated with 0.1% collagenase for 20 minutes, passed serially through 200- and 90-mm stainless steel meshes, and washed 3 times with PBS. Cell clusters were resuspended and grown in RPMI-1640 medium containing d-valine instead of the natural l-valine. Because of a deficiency of d-amino acid oxidase in mesenchymal-like cells, their growth in vitro was blocked, and contaminant mesenchymal-like cells were excluded.19 Desmin and vimentin were applied as markers of rat glomerular mesangial cells by means of indirect immunofluorescence staining. Primary mesangial cells at passage 2 to 3 were used for in vitro cell transfection studies. The isolation procedure of renal glomerular epithelial cells was based on the reports described previously.20,21 Glomerular epithelial cells were identified by distinct staining for the epithelial markers nephrin or synaptopodin. Glomerular endothelial cells were isolated with the method developed previously and were identified by positive immunofluorescence for the endothelial cell-specific marker CD31 (platelet/endothelial cell adhesion molecule-1).22–24 Isolation and identification of rat primary tubular epithelial cells were performed according to previously published techniques, and cytokeratin 18 was used as a specific marker of tubular epithelial cells.25–27 Interstitial fibroblasts were isolated and identified as reported.28 FSP-1 was used as marker for renal fibroblasts.29 To perform immunofluorescence staining, the above cells were grown on coverslips and fixed with ice-cold acetone or 4% paraformaldehyde for 15 to 20 minutes. The cells were washed with PBS, blocked with milk, and stained with the primary antibodies specific for the renal cells. Fluorescein isothiocyanate and tetramethyl rhodamine isothiocyanate-labeled immunoglobulins were used as secondary antibodies. The primary antibodies used include mouse monoclonal antibodies against desmin (Santa Cruz), vimentin (Santa Cruz) and cytokeratin 18 (Santa Cruz), and polyclonal antibodies against nephrin (Abcam, Cambridge, United Kingdom), FSP-1 (Abcam) and CD31 (Abcam).
miRNA Transfection
Young mesangial cells (1 × 10⁷ count) were suspended in 400 μl of electrotransfection solution, to which was added 40 nmol/L miR-335 mimic (premiR-335) or antisense miR-335 inhibitor (AmiR335), miR-34a mimic (premiR-34a) or antisense miR-34a inhibitor (AmiR34a), and control miRNA (Thermo Fisher, Waltham, MA). Transfection was performed at 340 V with a capacitance of 550 μF. Fresh medium (500 μl) was added immediately after transfection, and the cells were plated and incubated at 37°C for 3 days.
Luciferase Assay
The SOD2 3′-UTR sequence spanning 1311 bp was PCR-amplified with primers (+) AGCCCTTCCGCCAGGCTGTGTG and (−) AAATACTCCATTAAGAAGTAATG; this region contains the miR-335 consensus-binding element TGCTCTTGA. The Txnrd2 3′-UTR sequence spanning 374 bp was PCR-amplified with primers (+) GTTACCATCCCTGCTGAGCTAAG and (−) TACTAAAACACGCTCTTTATTAGC; this region contains the miR-34a consensus-binding element TGCTCTTGA. The amplicons were inserted into pGL3 control vectors (Promega, Madison, WI) downstream of the cDNA for the firefly luciferase reporter gene. The binding elements in the 3′-UTRs of SOD2 and Txnrd2 were mutated to TGCTCTTGA and TGCTCTTGA using PCR-based methods with the Quick Change Site-Directed Mutagenesis Kit (Stratagene, LaJolla, CA). Wild-type and mutated pGL3-SOD2–3′UTR or pGL3-Txnrd2–3′UTR vectors were used to test the activity of miR-335 or miR-34a. Each vector, along with 40 nmol/L of premiR-335 or premiR-34a and the internal control vector pRL-TK containing the renilla luciferase reporter gene (Promega), was cotransfected into rat mesangial cells with Lipofectamine 2000 reagent (Invitrogen) according to the manufacturer's instructions. Cells were cultured for 2 days and then assayed using the Dual-Luciferase Reporter Assay System (Promega).
Western Blot
Western blots were performed using rabbit anti-SOD2 and anti-Txnrd2 antibodies and β-actin antibody (Abcam). The blots were then incubated with the corresponding secondary antibodies conjugated with horseradish peroxidase for 1 hour. After washing with Tris-Tween Buffered Saline, the membranes were incubated with electrochemiluminescence reagent (Amersham Life Science, Inc., Buckinghamshire, United Kingdom), exposed to x-ray film, and developed. β-actin was used as a normalization control.
SA-β-gal Staining
Cells were washed twice in PBS, fixed to plates using 3% formaldehyde for 3–5 minutes, and washed with PBS again. These cells were then incubated overnight at 37°C without carbon dioxide in a freshly prepared staining buffer (1 mg/ml X-gal, 40 mM citric acid/sodium phosphate, pH 6.0, 5 mM potassium ferrocyanide, 5 mM potassium ferricyanide, 150 mM sodium chloride, 2 mM magnesium chloride). Stained cells were examined using a Zeiss Axiovert 200 inverted microscope (Carl Zeiss, Inc., Germany) under bright-field illumination.
SAFH Analysis
SAFH formation is a novel specific biomarker of cellular senescence because there is marked focal heterochromatin in the aged cells. To determine SAFH formation, cells were cultured directly on glass cover slips and then fixed with 4% paraformaldehyde. After washing with PBS, cells were permeabilized with 0.2% Triton X-100/PBS for 10 minutes. DNA was visualized by DAPI (1 mg/ml) for 1 minute and then washed with PBS twice. Cover slips were mounted in a 90% glycerol PBS solution and examined under a laser confocal microscope.
Determination of Intracellular ROS Level
Intracellular ROS generation was measured using the oxidant-sensitive fluorescence probe carboxy-dichlorodihydrofluorescein diacetate. Briefly, suspensions of cells (1 × 10⁶) were loaded with 5 μM carboxy-dichlorodihydrofluorescein diacetate (Molecular Probes, Eugene, OR) for 10 minutes at 37°C. After centrifugation and washing to remove unincorporated probe, measurements of cellular fluorescence were performed by flow cytometry (Becton-Dickinson, San Jose, CA) using excitation at 488 nm and observing emission at 515 nm.
Statistical Analysis
Results are expressed as mean ± SD. Statistical difference was assessed by the t test as appropriate. P < 0.05 was considered significant. Analyses were performed with SPSS software, version 13.0.
DISCLOSURES
None.
Supplementary Material
Acknowledgments
This work was supported by a grant (2007CB507400) from the National Basic Research Program of China to X.C., a grant (No. 2011CB964904) from the National Key Scientific Program of China to X.Y.B., and grants (30870920, 30270505 and 30070288) from the National Natural Science Foundation of China to X.Y.B.
Footnotes
Published online ahead of print. Publication date available at www.jasn.org.
Supplemental information for this article is available online at http://www.jasn.org/.
REFERENCES
- 1. Melk A, Mansfield ES, Hsieh SC, Hernandez-Boussard T, Grimm P, Rayner DC, Halloran PF, Sarwal MM: Transcriptional analysis of the molecular basis of human kidney aging using cDNA microarray profiling. Kidney Int 68: 2667–2679, 2005 [DOI] [PubMed] [Google Scholar]
- 2. Calin GA, Croce MA: MicroRNA-cancer connection: The beginning of a new tale. Cancer Res 66: 7390–7394, 2006 [DOI] [PubMed] [Google Scholar]
- 3. Yang B, Lin H, Xiao J, Lu Y, Luo X, Li B, Zhang Y, Xu C, Bai Y, Wang H, Chen G, Wang Z: The muscle-specific microRNA miR-1 regulates cardiac arrhythmogenic potential by targeting GJA1 and KCNJ2. Nature Med 13: 486–491, 2007 [DOI] [PubMed] [Google Scholar]
- 4. Lewis BP, Burge CB, Bartel DP: Conserved seed pairing, often flanked by adenosines, indicates that thousands of human genes are microRNA targets. Cell 120: 15–20, 2005 [DOI] [PubMed] [Google Scholar]
- 5. Friedman RC, Farh KKH, Burge CB, Bartel DP: Most mammalian mRNAs are conserved targets of microRNAs. Genome Res 19: 92–105, 2009 [DOI] [PMC free article] [PubMed] [Google Scholar]
- 6. Boehm M, Slack F: A developmental timing microRNA and its target regulate lifespan in C. elegans. Science 310: 1954–1957, 2005 [DOI] [PubMed] [Google Scholar]
- 7. Lee HJ, Palkovits M, Young WS: miR-7b, a microRNA up-regulated in the hypothalamus after chronic hyperosmolar stimulation, inhibits Fos translation. Proc Natl Acad Sci U S A 103: 15669–15674, 2006 [DOI] [PMC free article] [PubMed] [Google Scholar]
- 8. Baylis C, Corman B: The aging kidney: Insights from experimental studies. J Am Soc Nephrol 9: 699–709, 1998 [DOI] [PubMed] [Google Scholar]
- 9. Gray JE, van Zwieten MJ, Hollander CF: Early light microscopic changes in chronic progressive nephrosis in several strains of aging laboratory rats. J Gerontol 37: 142–150, 1982 [DOI] [PubMed] [Google Scholar]
- 10. Schriner SE, Linford NJ, Martin GM, Treuting P, Ogburn CE, Emond M, Coskun PE, Ladiges W, Wolf N, Van Remmen H, Wallace DC, Rabinovitch PS: Extension of murine life span by overexpression of catalase targeted to mitochondria. Science 308: 1909–1911, 2005 [DOI] [PubMed] [Google Scholar]
- 11. Narita M, Narita M, Krizhanovsky V, Nunez S, Chicas A, Hearn SA, Myers MP, Lowe SW: A novel role for high-mobility group A proteins in cellular senescence and heterochromatin formation. Cell 126: 503–514, 2006 [DOI] [PubMed] [Google Scholar]
- 12. Li N, Bates DJ, An J, Terry DA, Wang E: Up-regulation of key microRNAs, and inverse down-regulation of their predicted oxidative phosphorylation target genes, during aging in mouse brain. Neurobiol Aging 32: 944–955, 2011 [DOI] [PubMed] [Google Scholar]
- 13. Rao G, Xia E, Richardson A: Effect of age on the expression of antioxidant enzymes in male Fischer F344 rats. Mech Ageing Dev 53: 49–60, 1990 [DOI] [PubMed] [Google Scholar]
- 14. Meng Q, Wong YT, Chen J, Ruan R: Age-related changes in mitochondrial function and antioxidative enzyme activity in Fischer 344 rats. Mech Ageing Dev 128: 286–292, 2007 [DOI] [PubMed] [Google Scholar]
- 15. Maes OC, Sarojini H, Wang E: Stepwise up-regulation of microRNA expression levels from replicating to reversible and irreversible growth arrest states in WI-38 human fibroblasts. J Cell Physiol 221: 109–119, 2009 [DOI] [PubMed] [Google Scholar]
- 16. Vina J, Borras C, Miquel J: Theories of ageing. IUBMB Life 59: 249–254, 2007 [DOI] [PubMed] [Google Scholar]
- 17. Sinuani I, Averbukh Z, Gitelman I, Raporort MJ, Sandbank J, Albeck M, Sredni B, Weissqarten J: Mesangial cells initiate compensatory renal tubular hypertrophy via IL-10-induced TGF-beta secretion: Effect of the immunomodulator AS101 on this process. Am J Physiol Renal Physiol 291: F384–F394, 2006 [DOI] [PubMed] [Google Scholar]
- 18. Park MJ, Bae CS, Lim SK, Kim DI, Lim JC, Kim JC, Han HJ, Moon JH, Kim KY, Yoon KC, Park SH: Effect of protopanaxadiol derivatives in high glucose-induced fibronectin expression in primary cultured rat mesangial cells: Role of mitogen-activated protein kinases and Akt. Arch Pharm Res 33: 151–157, 2010 [DOI] [PubMed] [Google Scholar]
- 19. Latta H, Fligiel S: Mesangial fenestrations, sieving, filtration, and flow. Lab Invest 29: 591–598, 1985 [PubMed] [Google Scholar]
- 20. Katsuya K, Yaoita E, Yoshida Y, Yamamoto Y, Yamamoto T: An improved method for primary culture of rat podocytes. Kidney Int 69: 2101–2106, 2006 [DOI] [PubMed] [Google Scholar]
- 21. Letavernier E, Bruneval P, Vandermeersch S, Perez J, Mandet C, Belair MF, Haymann JP, Legendre C, Baud L: Sirolimus interacts with pathways essential for podocyte integrity. Nephrol Dial Transplant 24: 630–638, 2009 [DOI] [PubMed] [Google Scholar]
- 22. Demeule M, Labelle M, Regina A, Berthelet F, Beliveau R: Isolation of endothelial cells from brain, lung, and kidney: Expression of the multidrug resistance P-Glycoprotein isoforms. Biochem Biophys Res Commun 281: 827–834, 2001 [DOI] [PubMed] [Google Scholar]
- 23. Caron A, Desrosiers RR, Béliveau R: Ischemia injury alters endothelial cell properties of kidney cortex: Stimulation of MMP-9. Exp Cell Res 310: 105–116, 2005 [DOI] [PubMed] [Google Scholar]
- 24. Akis N, Madaio MP: Isolation, culture, and characterization of endothelial cells from mouse glomeruli. Kidney Int 65: 2223–2227, 2004 [DOI] [PubMed] [Google Scholar]
- 25. Garcıa-Ocana A, de Miguel F, Penaranda C, Albar JP, Sarasa JL, Esbrit P: Parathyroid hormone-related protein is an autocrine modulator of rabbit proximal tubule cell growth. J Bone Miner Res 10: 1875–1884, 1995 [DOI] [PubMed] [Google Scholar]
- 26. Wieser M, Stadler G, Jennings P, Streubel B, Pfaller W, Ambros P, Riedl C, Katinger H, Grillari J, Grillari-Voglauer R: hTERT alone immortalizes epithelial cells of renal proximal tubules without changing their functional characteristics. Am J Physiol Renal Physiol 295: F1365–F1375, 2008 [DOI] [PubMed] [Google Scholar]
- 27. Morais C, Westhuyzen J, Pat B, Gobe G, Healy H: High ambient glucose is effect neutral on cell death and proliferation in human proximal tubular epithelial cells. Am J Physiol Renal Physiol 289: F401–F409, 2005 [DOI] [PubMed] [Google Scholar]
- 28. Grupp C, Müller GA: Renal fibroblast culture. Exp Nephrol 7: 377–385, 1999 [DOI] [PubMed] [Google Scholar]
- 29. Le Hir M, Hegyi I, Cueni-Loffing D, Loffing J, Kaissling B: Characterization of renal interstitial fibroblast-specific protein 1/S100A4-positive cells in healthy and inflamed rodent kidneys. Histochem Cell Biol 123: 335–346, 2005 [DOI] [PubMed] [Google Scholar]
Associated Data
This section collects any data citations, data availability statements, or supplementary materials included in this article.


