Abstract
Maintenance immunosuppression with cyclosporine A (CsA) can cause nephrotoxicity in renal transplant recipients. Identifying patients at increased risk for CsA nephrotoxicity may allow interventions to prolong graft survival. Here, we studied the effect of early CsA withdrawal or maintenance among 96 kidney recipients at risk for interstitial fibrosis and tubular atrophy (IF/TA) on the basis of tubular expression of vimentin and β-catenin in a protocol biopsy performed 3 months after transplant. In this retrospective analysis of biopsies collected during a randomized trial of early withdrawal of CsA or mycophenolate mofetil, the semiquantitative score of early phenotypic changes suggestive of epithelial-to-mesenchymal transition (EMT) progressed with time among those maintained on a CsA-containing regimen. EMT-positive grafts displayed a significantly higher IF/TA score and greater progression of the IF/TA score at 12 months (P = 0.001 and 0.008, respectively). EMT-positive grafts exposed to CsA also had a greater decrease in estimated GFR compared with EMT-negative grafts exposed to CsA and EMT-positive grafts withdrawn from CsA exposure. Multivariable analysis revealed that the presence of EMT was an independent risk factor for a 10% decline in graft function up to 4 years posttransplant (odds ratio 4.49; 95% confidence interval 1.02 to 19.9). Collectively, these data demonstrate that changes consistent with EMT are strong prognostic biomarkers in renal transplant recipients exposed to CsA.
To exactly what extent and via what mechanisms calcineurin inhibitors (CNIs) contribute to the development of interstitial fibrosis and tubular atrophy (IF/TA) in native or engrafted kidneys has been intensely debated over the last 30 years.1 So far, no specific lesion has been indisputably shown to be attributable to the chronic nephrotoxicity of cyclosporine A (CsA) or tacrolimus. Longitudinal studies of kidney-transplanted patients exposed to CNIs consistently show that renal interstitial fibrosis progresses over time,2 yet the proportion of patients for which CNI use is the main cause of renal graft loss was reported to be as low as 0.6%.3 Furthermore, liver- and heart-transplanted patients are likely to have existing renal abnormalities before they are exposed to CNIs, which makes it difficult to interpret interstitial fibrosis occurring some years after their introduction in these patients.4,5 Lastly, kidneys from rodents experimentally given CNIs for weeks exhibit histologic features that resemble the supposedly CNI-induced IF/TA observed in humans; however, supratherapeutic doses of CNI have often been used that are not necessarily patient-relevant. Whatever the repercussions that CNIs may have on kidneys, the question of whether they correspond to irreversible structural changes or are, on the contrary, reversible once they are withdrawn is of clinical significance: Removing CNIs from the regimen of patients with a well functioning graft is currently in vogue, but it is also risky. Studies are needed that address the reversibility of CNI-induced kidney alterations.
Epithelial-to-mesenchymal transition (EMT) is a multistep biologic process used in vivo by epiblasts during embryogenesis to form organs at a distance from the ectoderm and by tumoral cells to disperse metastases.6 Basically, EMT consists of a switch affecting the phenotype and the behavior of epithelial cells that subsequently express, use, and secrete proteins that are more typical of mesenchymal cells. The transposition of the EMT paradigm into the kidney field has drawn attention to the phenotype of tubular epithelial cells. In the context of kidney transplantation, we have repeatedly observed that two markers of EMT (i.e., the de novo expression of vimentin [VIM] and the translocation of β-catenin [βCAT] into the cytoplasm of tubular epithelial cells) were frequently found in early surveillance biopsies from well functioning grafts7 and were predictive of the progression of interstitial fibrosis over time, with functional consequences.
The hypothesis that a phenotype switch of this type in tubular epithelial cells could be induced by CsA and reflect its nephrotoxicity has never been tested. Thus, although in vitro CsA has been shown to have an acute toxic effect on human tubular epithelial cells in a way that is indeed reminiscent of EMT,8 in vivo data are lacking. In the study presented here, we wanted to find out whether CNI withdrawal would affect the intensity of these EMT-like epithelial phenotypic changes observed in tubular epithelial cells from kidney transplants. To do this, we retrospectively analyzed the sequential graft biopsies collected during a randomized controlled trial performed in Lille, France, in the early 2000s in 108 patients who were exposed to CsA for the first 3 months and then divided them into two equal groups—one in which CsA was continued and mycophenolate mofetil (MMF) was withdrawn and one in which CsA was progressively withdrawn and MMF was continued.9 Biopsies were taken after 3 and 12 months (M3 and M12). Our findings show that in patients showing early EMT in tubular cells, the withdrawal of CsA normalized the risk of the decline in graft function over time.
RESULTS
Detection and Distribution of the EMT Score in the Study Population
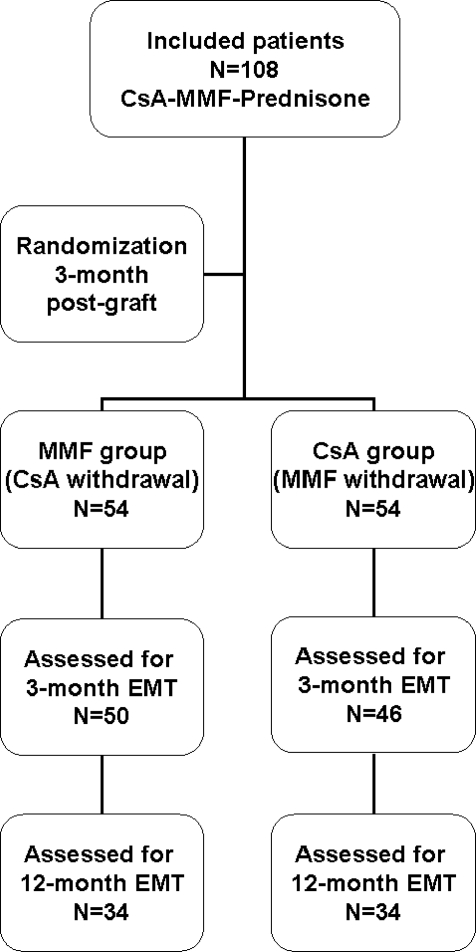
We were able to score the EMT in the material leftover from 96 of 108 M3 biopsies (50 and 46 patients in the CsA and MMF groups, respectively). For 68 patients (34 in each group), EMT scores could be assessed at M3 and M12 (Figure 1). The characteristics of the patients are shown in Table 1. The coefficient of correlation between the two EMT markers VIM and βCAT was 0.925 (P < 0.001) and 0.936 (P < 0.001) at M3 and M12, respectively. At M3, 45 of 96 patients (47%) had an EMT score ≥2.
Figure 1.
Assessment of the EMT scores at M3 and M12 postgraft.
Table 1.
Pretransplant characteristics
| CsA Group (n = 50) | MMF Group (n = 46) | P | |
|---|---|---|---|
| Recipients | |||
| male gender, n (%) | 33 (66.0) | 27 (58.7) | NS |
| age (years) | 43.1 ± 11.5 | 45.5 ± 10.9 | NS |
| body mass index (kg/m2) | 23.6 ± 3.9 | 23.5 ± 3.6 | NS |
| cause of renal failure, n (%) | NS | ||
| glomerulonephritis | 19 (38.0) | 15 (32.6) | |
| interstitial nephritis | 6 (12.0) | 11 (23.9) | |
| polycystosis | 9 (18.0) | 11 (23.9) | |
| other | 16 (32.0) | 9 (19.6) | |
| type of dialysis, n (%) | NS | ||
| hemodialysis | 39 (78.0) | 34 (78.9) | |
| peritoneal dialysis | 11 (22.0) | 12 (26.1) | |
| time on dialysis (months) | 20.4 ± 15.7 | 21.4 ± 15.2 | NS |
| cold ischemia time (hours) | 19.5 ± 6.1 | 19.2 ± 6.1 | NS |
| number of HLA matches | 2.7 ± 1.1 | 2.6 ± 1.2 | NS |
| Donors | |||
| male gender, n (%) | 30 (60.0) | 32 (69.6) | NS |
| age (years) | 37.1 ± 13.4 | 40.0 ± 14.6 | NS |
| strokes, n (%) | 24 (48.0) | 20 (43.5) | NS |
| body mass index (kg/m2) | 24.8 ± 3.6 | 24.4 ± 8.4 | NS |
Change in EMT Scores from M3 to M12
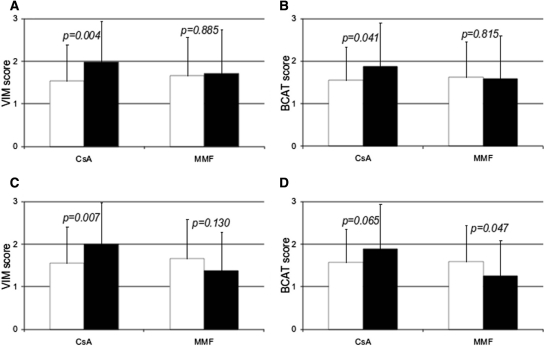
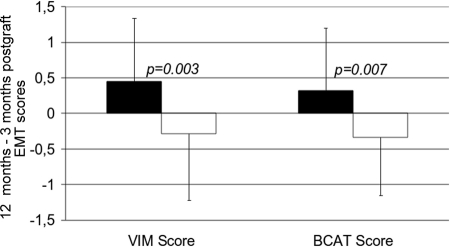
In the CsA group, from M3 to M12, the mean VIM and βCAT scores increased significantly (from 1.53 ± 0.86 to 1.98 ± 0.97, P = 0.004; and from 1.55 ± 0.79 to 1.88 ± 1.03, P = 0.041, respectively) from M3 to M12, whereas they remained stable in the MMF group (Figure 2, A and B). Because acute rejection is known to trigger the occurrence of EMT in grafts,10 and because in this trial biopsy-proven acute rejection (BPAR) was more frequent in the MMF group,9 we wanted to rule out a possible confusing effect of BPAR on the change in the EMT score. We therefore performed a subgroup analysis excluding BPAR episodes (i.e., after excluding two patients from the CsA group and eight patients from the MMF group). In this BPAR-free population (Figure 2, C and D), we observed that the VIM and βCAT scores had still significantly progressed between M3 and M12 in the CsA group (from 1.55 ± 0.86 to 2.0 ± 0.98, P = 0.007; and from 1.57 ± 0.79 to 1.89 ± 1.05, P = 0.065, respectively), whereas they had actually decreased in the patients who had been successfully withdrawn from CsA (from 1.67 ± 0.91 to 1.38 ± 0.91, P = 0.130; and from 1.60 ± 0.85 to 1.26 ± 0.84, P = 0.047, respectively). Taken individually, the mean differences (M12 − M3) were +0.45 ± 0.89 versus −0.29 ± 0.93 (P = 0.003) for the VIM score and +0.32 ± 0.88 versus −0.34 ± 0.81 (P = 0.007) for the βCAT score in the CsA and MMF groups, respectively (Figure 3).
Figure 2.
EMT scores progressed from M3 (white bars) to M12 (black bars) in the CsA group but not in the MMF group. (A and B) All of the 68 patients assessed for EMT at M3 and M12 postgraft. (C and D) Rejection-free patients (n = 58).
Figure 3.
The mean difference between M3 and M12 postgraft of the VIM and βCAT scores increased in the CsA group (n = 34, black bars) but decreased in the MMF group (n = 34, white bars).
Predictive Value of Early EMT in the Interstitial Fibrosis Score at 1 Year
In keeping with our previous observations,7,10 we found that in patients durably exposed to CsA, the IF/TA score was significantly higher at M12 in patients who had shown early (M3) EMT when compared with patients who had not (0.91 ± 0.8 versus 0.26 ± 0.4, P = 0.001). This was attributable to a significantly faster progression of this score between M3 and M12 (0.65 ± 1 versus 0 ± 0.6, P = 0.008). In this population, the expression of VIM by tubular cells was quantitatively correlated with the IF/TA score at M12 (P = 0.002); the correlation was borderline significant for the progression of the IF/TA score between M3 and M12 (P = 0.058). Interestingly, in patients from whom CsA was successfully withdrawn, the IF/TA score at M12 and the progression of the IF/TA score between M3 and M12 were comparable whether or not EMT was detected at M3. Similarly, this group no longer showed any correlation between VIM expression and IF/TA score or progression.
Evolution of Interstitial Fibrosis throughout Time
A morphometric retrospective evaluation of interstitial fibrosis was technically possible in 53 of 68 patients, including 28 maintained on CsA and 25 maintained on MMF. In this global population, fibrosis progressed significantly between M3 and M12 (+6.2%, 95% confidence interval [CI] = 3.8% to 8.7%, P < 0.001). This was true whether cyclosporine was withdrawn (+6.8%, 95% CI = 3.8% to 9.7%, P < 0.001) or maintained (+5.8%, 95% CI = 1.9% to 9.7%, P = 0.005). Similarly, with the data obtained by the semiquantitative Banff score, a quantitative assessment of interstitial fibrosis showed that fibrosis at M12 was higher in patients who were EMT positive at M3 when compared with those who were EMT negative (22.8% ± 9.1% versus 18.6% ± 8.0%, P = 0.036). Although the progression of fibrosis was less in patients without EMT at M3 (+5.6% versus 6.9% in EMT-positive grafts), in both groups this progression with time was still significant (P = 0.003 and P < 0.001 in EMT-negative and EMT-positive grafts, respectively). However, in EMT-negative patients who remained rejection-free after CsA withdrawal, interstitial fibrosis did not progress (+1.76%, 95% CI = −5.5% to +9.0%, P = 0.57). This is in contrast with EMT-negative, rejection-free patients who were maintained on CsA in whom fibrosis did progress (+5.8%, 95% CI = 2.9% to 9.9%, P = 0.002).
Graft Function
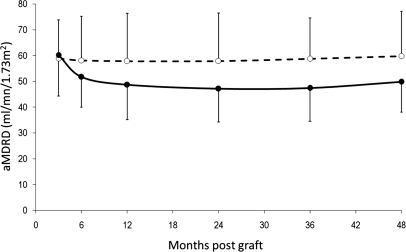
The change in estimated GFR (eGFR) (aMDRD, abbreviated Modification of Diet in Renal Disease) from 3 months to 4 years is depicted in Figure 4. Up to 4 years, aMDRD remained significantly higher in the MMF group than in the CsA group. As shown in Table 2, the EMT score at M3 did not seem to influence the eGFR in the MMF group. In contrast, in kidney recipients randomized to continue on CsA, the patients exhibiting severe EMT at M3 (score ≥ 2) displayed a significant and persistent (up to 4 years posttransplant) decrease in eGFR, whereas those who discontinued CsA did not.
Figure 4.
Up to 4 years postgraft, aMDRD remained significantly higher in the MMF group (n = 50, dashed line, white circles) than in the CsA group (n = 46, solid line, black circles).
Table 2.
Evolution of eGFR (aMDRD) in the CsA and MMF groups according to the M3 EMT score
| aMDRD | CsA Group |
MMF Group |
||||
|---|---|---|---|---|---|---|
| EMT Negative | EMT Positive | P | EMT Negative | EMT Positive | P | |
| 3 months | 68.4 ± 11.9 | 55.2 ± 13.0 | 0.002 | 64.8 ± 15.2 | 55.9 ± 13.9 | 0.059 |
| 6 months | 57.9 ± 10.1 | 48.7 ± 11.2 | 0.010 | 63.4 ± 16.3 | 55.9 ± 15.1b | 0.134 |
| 1 year | 55.6 ± 12.1 | 46.3 ± 13.4 | 0.028 | 64.3 ± 16.7 | 55.8 ± 19.2c | 0.161 |
| 2 years | 52.9 ± 14.2 | 44.9 ± 11.6 | 0.049 | 61.3 ± 19.4 | 55.8 ± 18.9d | 0.387 |
| 3 years | 55.5 ± 11.5 | 44.9 ± 13.1 | 0.062 | 63.6 ± 12.6a | 55.6 ± 17.6e | 0.216 |
| 4 years | 55.7 ± 10.4 | 46.7 ± 11.3 | 0.014 | 59.9 ± 14.5 | 58.8 ± 19.7f | 0.851 |
aP = 0.024 versus CsA EMT-negative patients;
bP = 0.035,
cP = 0.025,
dP = 0.008,
eP = 0.005,
fP = 0.007 versus CsA EMT-positive patients.
Predictive Factors of a 10% Decline in the eGFR between Years 1 and 4
We conducted a multivariate logistic regression analysis to identify the predictive factors of a decline in renal function (Table 3). The combined end point for analysis was defined as a reduction in the eGFR (aMDRD) of ≥10% between years 1 and 4 posttransplantation and graft loss. In the ongoing CsA group, an EMT score ≥ 2 at M3 was independently associated with a decline in graft function at 4 years, whereas this was not the case in patients from whom CsA had been withdrawn.
Table 3.
Risk factors for a 10% decline of the eGFR or a graft loss between years 1 and 4 postgraft in the CsA and MMF groups (multivariate analysis)
| CsA Group |
MMF Group |
|||
|---|---|---|---|---|
| Odds Ratio [95% CI] | P | Odds Ratio [95% CI] | P | |
| Age (+1 year) | 1.01 [0.96 to 1.05] | 0.807 | 1.01 [0.96 to 1.05] | 0.816 |
| HLA matching (+1) | 1.11 [0.71 to 1.71] | 0.654 | 1.09 [0.74 to 1.59] | 0.666 |
| Cold ischemia time (+1 hour) | 1.00 [0.99 to 1.00] | 0.757 | 1.00 [0.99 to 1.00] | 0.995 |
| Acute rejection (yes/no) | 1.91 [0.24 to 15.0] | 0.540 | 2.49 [0.86 to 7.24] | 0.092 |
| VIM score (≤1/>1) | 4.49 [1.02 to 19.9] | 0.048 | 0.96 [0.37 to 2.48] | 0.934 |
Graft and Patient Survival
Four-year patient and graft survival rates were 100% versus 98.1% and 92.6% versus 85.2% in the CsA and MMF groups, respectively (NS). Graft survival rates, stratified by the EMT score, were 92.9% (VIM score ≤ 1) versus 90.6% (VIM score ≥ 2) in the CsA group and 85.7% (VIM score ≤ 1) versus 87.5% (VIM score ≥ 2) in the MMF group (NS).
DISCUSSION
Therapeutic strategies to protect renal transplants in the long term are urgently needed. In the absence of any drug specifically targeting graft fibrogenesis, a favored approach consists of administering a CNI-sparing, or CNI-free, regimen. However, lowering CNI exposure or switching from CNIs to other immunosuppressive drugs involves some risk, especially that of acute rejection. Therefore, in the clinic, the early withdrawal of CNI in patients with apparently reassuring graft function and histology is a difficult step to take: Some patients will obviously benefit from longer-term CNI exposure and will not lose their grafts because of the chronic and irreversible toxicity of CNI, the pathophysiology and incidence of which remain obscure.
Our study shows that the intensity of the expression by tubular epithelial cells of two markers of EMT (i.e., VIM and βCAT) can be used at an early time point posttransplant (M3) to appreciate the risk of decline of graft function. It also demonstrates that the withdrawal of CsA in patients displaying intense EMT contributes to normalize this risk. We were only able to include a somewhat limited number of patients (<100) in our analysis, and the randomized trial from which the population used in this study was extracted was not designed to investigate the interest of EMT markers. However, together with the initial conclusions of the trial, we propose that CsA withdrawal should be discussed in patients fulfilling three conditions: (1) exposure to a high risk of fibrogenesis defined by an EMT score ≥ 2, (2) a graft biopsy showing no borderline changes (and a fortiori no acute rejection), and (3) appropriate exposure to MMF. We are aware that such a tailored approach requires some tests or interventions that are not routinely practiced in all transplantation centers, including a pharmacokinetic study of mycophenolic acid, a surveillance biopsy at M3, and an immunohistochemical assessment of the expression of two protein markers. On the other hand, the morbidity that accompanies surveillance biopsies in centers that perform them on a routine basis is very low (<2% of patients develop a complication, which is mild in most patients),11 and the cost should be weighed against the savings expected from a prolongation of the graft survival. Assuming that our population index study is representative of the population of patients receiving a graft from a deceased donor, roughly 50% of them will be free from rejection but positive for EMT at M3. In the best-case scenario, if the withdrawal of CsA can produce a safe and sustained improvement of 10 ml in GFR, this could delay end-stage renal disease by 1 to 2 years,12 which is undoubtedly cost-efficient in such a large proportion of recipients. Lastly, immunohistochemistry is routinely practiced in all pathology departments, and the two markers we used here are relatively easy to interpret. VIM is normally not expressed at all in tubules; therefore, reading positive tubules is a binary process. Furthermore, although the cellular localization of βCAT is less easy to assess, it may also help to rank tubules for which VIM staining is found to be faint or partial. In our opinion, it is too soon to attempt to uncouple these two markers. If they become more widely used, prospective and multicenter studies would have to be performed to assess their respective usefulness. They significantly add up to routine histology data and reflect what might be called a “biologic” lesion. Studies are currently in progress to transform them into noninvasive urinary markers.
In conclusion, two EMT markers are demonstrated here to be helpful to identify patients whose graft will slowly progress toward chronic allograft dysfunction when durably exposed to CsA. Although technically they are not specific biomarkers for CNI toxicity, we believe that they could be used at the bedside to provide a tailored and safe immunosuppressive regimen for kidney recipients. A prospective trial is needed to confirm these findings and determine the clinical value of EMT markers on early protocol biopsies.
CONCISE METHODS
Population Study
The study design has been reported elsewhere,9 and the trial is registered in the Australian New Zealand Clinical Trial Registry (http://www.anzctr.org.au/ACTRN12610000070033.aspx). Briefly, 108 de novo rejection-free kidney transplant recipients were enrolled in a randomized trial to compare the 1-year incidence of BPAR at M3 after CsA (Neoral, Novartis) or MMF (Cellcept, Roche) withdrawal from a triple drug regimen consisting of CsA, MMF, and prednisone. Criteria for inclusion were (1) first kidney transplantation from a deceased donor; (2) anti-HLA antibody level < 30%; (3) no acute rejection episode at the time of randomization (3 months postgraft); (4) patients receiving a triple drug therapy with prednisone, CsA (>3 mg/kg per day and trough level >100 ng/ml), and MMF (>1.5 g per day); and (5) serum creatinine < 2.5 mg/dl at the time of randomization. All of the patients underwent systematic graft biopsies at M3 and M12 postgraft, respectively. As described previously, at M3 postgraft, randomly selected patients were switched from CsA-MMF-prednisone to CsA-prednisone (CsA group, n = 54) or MMF-prednisone (MMF group, n = 54). The recipients who experienced a BPAR episode were treated with steroid pulses and reverted to the initial triple drug regimen. Patients were switched from CsA to tacrolimus if they experienced a steroid-resistant acute rejection episode. The main results from this trial were as follows: (1) at 1 year, although graft function was better preserved in the MMF group, the risk of BPAR was 13% higher (it is noteworthy that patients experiencing BPAR after CsA withdrawal more frequently showed borderline changes at M3 and had a lower exposure to MMF)9; the chronic allograft damage index was equivalent in the two groups13; and the incidence of focal or diffuse C4d deposits was significantly higher in the MMF group; and (2) at 2 years, graft function remained better in the MMF group, but persistent CsA exposure was not an independent risk factor for a decline in graft function.
Quantification of Epithelial Phenotypic Changes
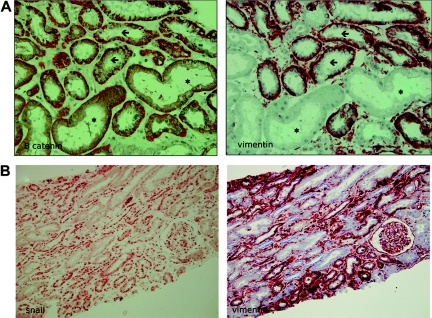
The methods used here to detect and quantify EMT in tubular epithelial cells in M3 and M12 graft biopsies have already been described in detail elsewhere.7,10 Briefly, we used immunohistochemical staining of intracellular translocation of βCAT and de novo VIM expression by tubular epithelial cells. Kidney specimens were fixed in alcohol-formalin-acetic acid. After dehydration with a graduated series of ethanol and xylene, the tissues were embedded in paraffin and cut into 3-μm sections. All samples were then deparaffinized; endogenous peroxidase was inactivated by incubating for 10 minutes at room temperature in 0.03% hydrogen peroxide. Antigen retrieval was performed for 20 minutes at 97°C in citrate buffer (pH 6). Next, the sections were incubated overnight at 4°C with PBS containing 1 μg/ml anti-βCAT (rabbit polyclonal antibody; Santa Cruz Biotechnology, Tebu, Le-Perray-en-Yvelines, France), 1:400 anti-VIM (mAb V9; Zymed, Invitrogen, Cergy-Pontoise, France), or 1:2000 anti-SNAIL1 (rabbit polyclonal antibody; Abcam, Cambridge Science Park, United Kingdom). The sections were then incubated with anti-rabbit or anti-mouse antibody conjugated with peroxidase-labeled polymer (Dako, Trappes, France). Immunoreactive proteins were visualized with a 3-amino-9-ethylcarbazole-containing peroxidase substrate (hydrogen peroxide; Dako). Finally, the tissue sections were counterstained with hematoxylin. For negative controls, the primary antibodies were replaced by an equal concentration of rabbit or mouse IgG (Dako). Semiquantitative analysis of VIM expression and of the translocation of βCAT from the membrane to the cytoplasm was performed in a blind manner. Sections were graded according to the proportion of tubules showing EMT as follows: 0 = none, 1 = <10%, 2 = 10% to 24%, 3 = 25% to 50%, and 4 = >50%. We defined a positive or negative EMT graft status as being ≥10% or <10% of tubules showing EMT, respectively (Figure 5).
Figure 5.
Colocalization of EMT markers in tubular epithelial cells (serial sections). (A) Stars indicate tubules in which the expression of βCAT is linear and VIM is absent (normal tubules); arrows indicate tubules exhibiting an overexpression of βCAT that is abnormally translocated into the cytoplasm and a de novo expression of VIM. Magnification, 40×. (B) Tubular cells strongly stained for SNAIL in the nucleus also strongly express VIM. Magnification, 20×.
Quantification of Fibrosis
For all surveillance 3M and 12M biopsies, a cortical section stained with Masson's trichrome was imaged using a 20× objective. The medulla, and in the cortex the glomeruli and the large vessels, were eliminated using Adobe Photoshop to specifically measure the fibrosis of the interstitium. The Image J software from the National Institutes of Health was then used to extract the green color from the area. Interstitial fibrosis was calculated as the ratio between the surface of green particles and the total number of particles.
Statistical Analysis
Categorical variables were expressed as numbers and percentages and compared using the χ2 test. Continuous variables were expressed as mean ± SD and compared using the t test or the paired sample t test, when appropriate. Graft and patient survival rates were calculated by the Kaplan–Meier method and compared with the log-rank test. All of the patients were analyzed on an intention-to-treat basis; thus, patients randomized to be withdrawn from CsA were analyzed as patients in the MMF group even if they returned to CsA. A logistic regression analysis was performed to identify the predictive factors of chronic allograft dysfunction. The end point was defined as a 10% decline of the eGFR (aMDRD) between years 1 and 4 or graft loss. All statistical tests were carried out with SPSS software, version 15.0 (SPSS, Chicago, IL).
DISCLOSURES
None.
Acknowledgments
We thank Edith Baugey for excellent technical assistance, Guido Krenning for critical reading of the manuscript, and Monika Ghosh for editing the English text. Part of this study was supported by a grant from the Santélys Association.
Footnotes
Published online ahead of print. Publication date available at www.jasn.org.
REFERENCES
- 1. Gaston RS: Chronic calcineurin inhibitor nephrotoxicity: Reflections on an evolving paradigm. Clin J Am Soc Nephrol 4: 2029–2034, 2009 [DOI] [PubMed] [Google Scholar]
- 2. Nankivell BJ, Borrows RJ, Fung CL, O'Connell PJ, Allen RDM, Chapman JR: The natural history of chronic allograft nephropathy. N Engl J Med 349: 2326–2333, 2003 [DOI] [PubMed] [Google Scholar]
- 3. El-Zoghby ZM, Stegall MD, Lager DJ, Kremers WK, Am H, Gloor JM, Cosio FG: Identifying specific causes of kidney allograft loss. Am J Transplant 9: 527–535, 2009 [DOI] [PubMed] [Google Scholar]
- 4. McGuire BM, Julian BA, Bynon JSJ, Cook WJ, King SJ, Curtis JJ, Accortt NA, Eckhoff DE: Brief communication: Glomerulonephritis in patients with hepatitis C cirrhosis undergoing liver transplantation. Ann Intern Med 144: 735–741, 2006 [DOI] [PubMed] [Google Scholar]
- 5. González-Vílchez F, de Prada JAV, Exposito V, García-Camarero T, Fernández-Friera L, Llano M, Ruano J, Martín-Durán R: Avoidance of calcineurin inhibitors with use of proliferation signal inhibitors in de novo heart transplantation with renal failure. J Heart Lung Transplant 27: 1135–1141, 2008 [DOI] [PubMed] [Google Scholar]
- 6. Kalluri R, Weinberg RA: The basics of epithelial-mesenchymal transition. J Clin Invest 119: 1420–1428, 2009 [DOI] [PMC free article] [PubMed] [Google Scholar]
- 7. Hertig A, Verine J, Mougenot B, Jouanneau C, Ouali N, Sebe P, Glotz D, Ancel PY, Rondeau E, Xu-Dubois YC: Risk factors for early epithelial to mesenchymal transition in renal grafts. Am J Transplant 6: 2937–2946, 2006 [DOI] [PubMed] [Google Scholar]
- 8. Pallet N, Bouvier N, Bendjallabah A, Rabant M, Flinois JP, Hertig A, Legendre C, Beaune P, Thervet E, Anglicheau D: Cyclosporine-induced endoplasmic reticulum stress triggers tubular phenotypic changes and death. Am J Transplant 8: 2283–2296, 2008 [DOI] [PubMed] [Google Scholar]
- 9. Hazzan M, Labalette M, Copin MC, Glowacki F, Provôt F, Pruv F, Noël C: Predictive factors of acute rejection after early cyclosporine withdrawal in renal transplant recipients who receive mycophenolate mofetil: Results from a prospective, randomized trial. J Am Soc Nephrol 16: 2509–2516, 2005 [DOI] [PubMed] [Google Scholar]
- 10. Hertig A, Anglicheau D, Verine J, Pallet N, Touzot M, Ancel P, Mesnard L, Brousse N, Baugey E, Glotz D, Legendre C, Rondeau E, Xu-Dubois Y: Early epithelial phenotypic changes predict graft fibrosis. J Am Soc Nephrol 19: 1584–1591, 2008 [DOI] [PMC free article] [PubMed] [Google Scholar]
- 11. Anil Kumar MS, Khan S, Ranganna K, Malat G, Sustento-Reodica N, Meyers WC: Long-term outcome of early steroid withdrawal after kidney transplantation in African American recipients monitored by surveillance biopsy. Am J Transplant 8: 574–585, 2008 [DOI] [PubMed] [Google Scholar]
- 12. Djamali A, Kendziorski C, Brazy PC, Becker BN: Disease progression and outcomes in chronic kidney disease and renal transplantation. Kidney Int 64: 1800–1807, 2003 [DOI] [PubMed] [Google Scholar]
- 13. Hazzan M, Buob D, Labalette M, Provot F, Glowacki F, Hoffmann M, Copin M, Noel C: Assessment of the risk of chronic allograft dysfunction after renal transplantation in a randomized cyclosporine withdrawal trial. Transplantation 82: 657–662, 2006 [DOI] [PubMed] [Google Scholar]


