Abstract
Combined measurements of middle ear transfer function and auditory brainstem response (ABR) in live guinea pigs with middle ear effusion (MEE) are reported in this paper. The MEE model was created by injecting saline into the middle ear cavity. Vibrations of the tympanic membrane (TM), the tip of the incus, and the round window membrane (RWM) were measured with a laser vibrometer at frequencies of 0.2-40 kHz when the middle ear fluid increased from 0 to 0.2 ml (i.e., full fill of the cavity). The click and pure tone ABRs were recorded as the middle ear fluid increased. Fluid introduction reduced mobility of the TM, incus and RWM mainly at high frequencies (f > 1 kHz). The magnitude of this reduction was related to the volume of fluid. The displacement transmission ratio of the TM to incus varied with frequency and fluid level. The volume displacement ratio of the oval window to round window was approximately 1.0 over most frequencies. Elevation of ABR thresholds and prolongation of ABR latencies were observed as fluid level increased. Reduction of TM displacement correlated well with elevation of ABR threshold at 0.5-8 kHz. Alterations in the ratio of ossicular displacements before and after fluid induction are consistent with fluid-induced changes in complex ossicular motions.
Keywords: middle ear effusion, middle ear transfer function, laser vibrometer, auditory brainstem response
INTRODUCTION
Middle ear effusion (MEE) occurs when fluid accumulates in the middle ear cavity through Eustachian tube obstruction or middle ear inflammatory response (Giebink and Quie, 1978). The build-up of fluid in the ear results in conductive hearing loss which can be characterized by reduced movement of the tympanic membrane (TM) and ossicles (Ravicz et al., 2004; Gan et al., 2006; Dai et al., 2007).
MEE is usually identified clinically by otoscopy and tympanometry (Bluestone and Klein, 1983). The presence of fluid in the middle ear can be recognized upon otoscopic examination. Tympanometric measurements identify pressure and impedance or admittance changes of the middle ear induced by fluid accumulation in this cavity (Beery et al., 1975; Shakes and Shelton, 1991; Dirks and Morgan, 2000; Gaihede et al., 2005). Conductive hearing loss and elevated air-conducted thresholds in patients with MEE are typically determined and quantified by audiometry (Bluestone et al., 1973). Several studies have been conducted on human temporal bones to investigate middle ear mechanical changes induced by fluid in the cavity. Vibration of the umbo has been measured by laser vibrometry following injection of saline or silicone fluid into the middle ear (Ravicz et al., 2004; Gan et al., 2006; Dai et al., 2007). By measuring the displacement of the stapes from the medial side of the footplate, Gan et al. (2006) reported the changes in the displacement transmission ratio (DTR) of the TM to stapes footplate caused by increasing fluid levels in the cavity.
Animal models of MEE also have been utilized to characterize variations in the shape and mobility of the TM. Larsson et al. created MEE in gerbils by obstructing the Eustachian tube with glue (2005) or injecting Streptococcus pneumoniae type 3 into the middle ear (2003) and measured the displacement of pars flaccida with Moiré interferometry. von Unge et al. (1995) created MEE in gerbils by electro-cauterization of the Eustachian tube and measured the shape and displacement of the TM. Recently, Dai and Gan (2008) induced MEE in guinea pigs via lipopolysaccharide (LPS) injections into the middle ear. Vibrations of the umbo and round window membrane (RWM) were measured in guinea pig temporal bones with a laser Doppler vibrometer over the frequency range of 0.2-40 kHz in three test groups (at 3, 7, and 14 days post LPS injection). Their findings identified significant MEE-associated reductions in TM motion. However, temporal bones, not intact live animals, were used in their study and the fluid effects on ossicular movement, especially of the incus or stapes, and hearing thresholds could not be determined because of experimental challenges.
Earlier live animal studies by Manley and Johnstone (1974) measured the velocity and displacement at the tip of malleus and the tip of incus in healthy ears of guinea pig using the Mössbauer technique. However, the effects of MEE on guinea pig middle ear movement were not investigated in their study. Petrova et al. (2006) investigated the effects of the middle ear fluid and pressure on the auditory threshold by measuring the auditory brainstem response (ABR) in live guinea pigs. The hearing thresholds were assessed when the middle ear cavity was empty or fully filled, but no vibration measurement was reported in their study. Recently, Turcanu et al. (2009) reported the compound action potential (CAP) threshold at 1-32 kHz and the movement of the TM at the umbo at frequencies of 0.5-15 kHz in normal and hearing-impaired (with MEE) guinea pigs. However, the correlation between the umbo mobility loss and the CAP threshold elevation was not discussed in their study. Qin et al. (2010) investigated the relation between distortion-product otoacoustic emissions (DPOAE), ABR, and vibration of TM in a mice MEE model and their results demonstrated that after introducing saline into the middle ear the increases in ABR and DPOAE thresholds were comparable with the decrease in TM mobility. However, more studies are needed for understanding the relation between reduction of middle ear mobility and conductive hearing loss in ears with MEE.
In this paper, we report the combined measurements on ossicular mobility (or middle ear transfer function) and ABR in live guinea pigs whose middle ears were injected with varying volumes of saline. Our goals were 1) to investigate whether a correlation exists between ossicular mobility changes and conductive hearing loss in ears with MEE produced by a known volume of saline, and 2) to determine how changes in the mobility of the TM, ossicles, and RWM relate to the change of auditory threshold as fluid increased in the middle ear.
METHODS
A. Animal preparation
Hartley guinea pigs (n=12) weighing between 280-380 g (7 males, 5 female) were included in this study. The study protocol was approved by the Institutional Animal Care and Use Committee of the University of Oklahoma and met the guideline of the National Institutes of Health. The animals were free from middle ear disease as evaluated by otoscopy examination.
Guinea pig was anesthetized with intramuscular injection of ketamine (40 mg/kg) and xylazine (10 mg/kg). Additional anesthesia was administered as required to maintain areflexia. Body temperature of each animal was maintained throughout the experiment at approximately 38° C by their placement on heating blanket. Animals were placed in a prone position on the heating blanket during ABR and laser measurements. All the data were measured in the left ear of the guinea pig. Identification of pre-existing abnormalities of auditory function was made by a pre-surgery ABR measurement in each animal. If an abnormal response was found, the animal was excluded from the study. A detailed description of ABR measurement follows in section D.
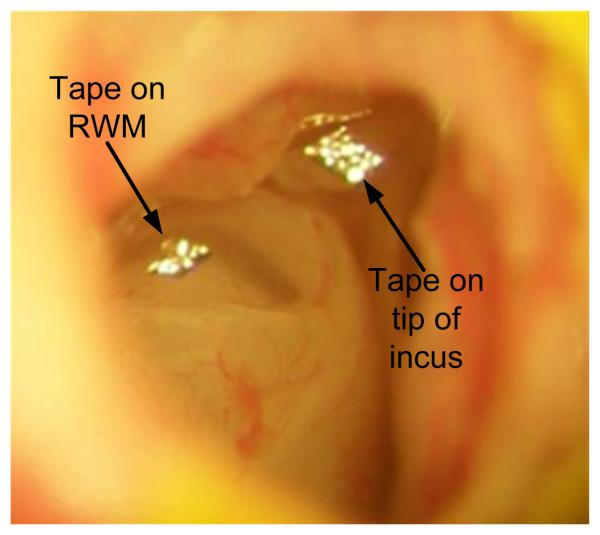
To place the sound source close to the TM, the pinna and most of the cartilaginous part of ear canal were removed. The posterior bony wall of the bulla was exposed and a hole with a 2 mm diameter was drilled at about 3~4 mm from the ear canal on the bulla to expose the long process of the incus and the RWM. This hole also allowed saline to be introduced directly into the middle ear cavity. Laser targets (pieces of reflective tape 0.2 × 0.2 mm2, < 0.01 mg each with glue on its back, 3M, St. Paul, MN) were placed (i) on the center of the lateral surface of the TM (umbo), (ii) on the tip of the incus that is the lateral surface of the most ventral point on the long process of the incus, and (iii) on the center of the RWM, respectively. The mass effect of the tape on the mobility of the TM, middle ear ossicles, and RWM was neglected. Figure 1 shows the laser reflective tapes placed on the tip of the incus and the RWM. The glue on the back of the reflective tape reinforced its attachment to the incus and RWM and prevented the loss of the tapes as fluid immersed them. The hole in the bulla was covered by a glass sheet and the gap between the glass sheet and the bony wall was sealed by dental cement (PD-135, Pac-Dent, CA).
Figure 1.
The laser reflective tapes placed at the tip of long process of the incus and the round window membrane with fluid in the middle ear cavity.
B. Experimental protocol
MEE was modeled by saline injections into the middle ear of guinea pigs using a 1 cc syringe with 26 gauge needle under an operating microscope. The saline solution was injected stepwise into the middle ear cavity from zero (control) to 0.1 ml and 0.2 ml (fully filling the cavity) via a graduated syringe. The incus tip and RWM were not flooded in 0.1 ml ears while the lower part of the malleus and part of the promontory were immersed in fluid. The fully filled fluid level was identified by the fluid overflowing from the drilled hole and the incus tip and RWM were flooded in 0.2 ml fill condition. The presence of trapped air bubbles was investigated by observations through the hole and TM; any bubble found in the cavity was removed by aspiration and the cavity refilled. The ABR and movement of the TM, incus and RWM in response to sound input in the ear canal were measured at each fluid level.
Instead of the measurement of compound action potential, which requires a recording electrode placed on the RWM that could interfere with the vibration of RWM, the measurement of click and pure tone ABRs were used to monitor cochlear function. All ABR measurements, including those made following fluid infusions, were performed prior to the laser vibrometer measurements. At each fluid level, measurement of middle ear transfer function began at the TM or umbo first with laser vibrometry and was followed by measurements at the tip of the incus and the RWM. After all the measurements were completed, the fluid in the cavity was recovered with a syringe to verify the volume of fluid injected into the cavity during the experiment. The amount of fluid removed from the cavity was expected to remain almost the same as that injected, i.e. no fluid drained through the Eustachian tube during the experiment.
C. Measurements with laser vibrometry
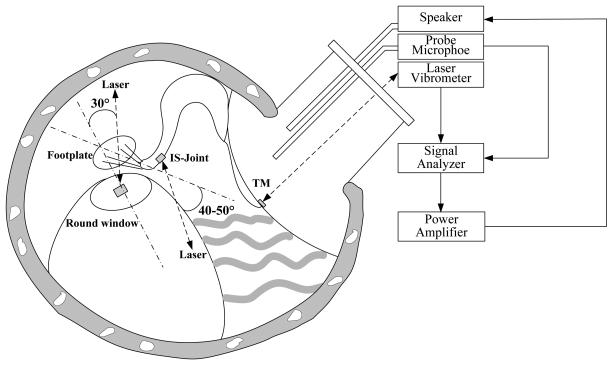
The experimental setup of the laser vibrometer to measure movements of the TM, the tip of incus and the RWM is shown schematically in Fig. 2. Briefly, 80 dB SPL pure tones at the frequency range of 0.2-40 kHz, including 20 lines per octave from a function generator (Signal Analyzer, HP 35670A, CA), power amplifier (Type 2718 B&K, Denmark), and speaker (CF1 Tucker-Davis Technologies, Alachua, FL) were presented into the ear canal at about 4 mm away from the umbo through a sound delivery tube. The tones were played sequentially from 200 Hz to 40 kHz for 50 cycles at each tone. The probe microphone (Model 4938 B&K, Denmark, frequency up to 100 kHz) was used to monitor the input SPL. The probe tubes of the microphone and the speaker were integrated into the sound delivery tube that was placed in the ear canal and sealed to the canal wall with the dental cement. The tip of the probe microphone tube was positioned approximately 2 mm from the umbo. One end of the sound delivery tube was covered by a transparent glass sheet.
Figure 2.
Schematic diagram of the experimental setup with laser vibrometry on the tympanic membrane (TM), incus tip and round window membrane (RWM) in guinea pigs. The laser beam was almost perpendicular to the umbo. The angle between the laser beam at the incus tip and the direction of footplate movement was about 40-50°; the angle between the laser beam at the RWM and the normal direction of RWM was about 30°.
Movements of the TM at the umbo, the incus tip, and the RWM induced by sound stimuli in the ear canal were measured by the laser vibrometer (Polytec HLV 1000, Tustin, CA). The output scaling factor of the laser vibrometer was set at 1 mm/s/V. The velocity amplitude and phase measurements from the laser vibrometer were input into the signal analyzer (HP 35670A) and recorded on a personal computer. Only data with a total harmonic distortion of less than 10% of the pure tone signals according to the distortion index shown on the signal analyzer were accepted. The peak-to-peak displacements (dp-p in unit of μm) of the TM, incus and RWM were calculated from the voltage output of the laser vibrometer velocity decoder by
| (1) |
where Avolt is the amplitude of vibrometer output (velocity) in Volts and f is the frequency of pure tone in kHz. k1 is the correction factor for laser angle and k1=1/cosθ where θ is the angle between the laser beam and piston-like vibration direction. k2 is the correction factor for the refractive index of the medium in which the change in optical path length takes place. It takes on the value of 1 if the vibration takes place in air, as in both the control and the 0.1 ml fill condition, where no fluid was between cover glass and measuring target. When the laser target is immersed in fluid such as the 0.2 ml case, k2=1/n and n is the fluid refractive index. The correction of the interferometer readout for the refractive index is based on principles of optical interferometry (Francon 1966). Briefly, the object's velocity measured by laser interferometer is based on the phase difference between the reference and object beams, , where n is the refractive index of the medium in which the object beam travels, λ is the wavelength of laser, and x is the displacement of moving object (Francon 1966). To eliminate the effect of non-air medium (e.g., water) on Δφ or velocity measurement, the refractive index n of 1.33 is used for laser measurement and k2=1/1.33 is employed into Eq. (1) for calculating the peak-to-peak displacement dp-p from the 0.2 ml experimental data. The displacement amplitude of the incus and RWM in 0.2 ml ears where the laser targets were immersed in water was corrected for the refraction effect.
The direction of the laser beam on the TM, the tip of the incus, and the RWM are shown in Fig. 2. The laser sensor head was attached to a microscope and the laser beam was in the line of sight of the microscope. The measurement angles were assessed using a guinea pig temporal bone that was placed on a rotational stage. The bulla was widely opened so that the lateral surface of the incus could be observed microscopically and the line of sight was approximately in the axis of stapes piston movement. Then, the bulla was rotated until the view was similar to that in experiment. The angle of rotation was measured by a goniometer and considered as the angle between the laser beam and the axis of stapes piston motion (empirically established to be 40°-50°). The angle between the laser beam and the normal direction of RWM was estimated to be 30° by this method.
The laser beam was assumed normal to the TM without correction (k1 =1). Since the angle correction for the ossicular chain may only be valid at some frequencies (Chien et al., 2006), we chose not to correct the measurement angle on the incus tip (kang = 1). The laser measurement on the RWM was corrected by the angle factor, k1, with a value of 1/cos30°.
D. ABR measurements
ABR waveform was recorded using the TDT system III (TDT, FL). Repeated click stimuli and tone burst stimuli with alternating polarity were delivered by the speaker (CF1 TDT) with the sound delivery tube placed 4 mm away from the umbo. For click ABR measurement, the stimulus with duration of 0.1 ms at the rate of 10/s was applied in the ear. To evoke pure tone ABR, the tone burst stimulus with duration of 10 periods (2 periods for rise/fall phase, 6 periods for plateau phase) at frequencies of 0.5, 1, 2, 4, 8, 10, 16, 20 kHz was applied in the ear canal at the rate of 10/s. The stimuli of click and tone burst started from 80 dB and down (or up in ears with middle ear fluid) to the threshold (defined as the lowest sound intensity to which the repeatable ABR waves could be observed) in 5 dB steps, and the ABR was measured in 10 ms recording window and averaged 500 times.
The negative recording electrode (steel needle electrode) was inserted subcutaneously at mastoid area, and the positive recording electrode was placed at the vertex. The ground electrode was placed in the hind leg. ABR signals were amplified and averaged using the TDT system III and Biosig software. The ABR thresholds and the latencies of wave I measured at 80 dB SPL were obtained through the TDT Biosig software. The no-testing ear (i.e., right ear) was sealed with dental cement during the ABR measurement.
RESULTS
A. Effect of middle ear fluid on movement of TM, incus tip, and RWM
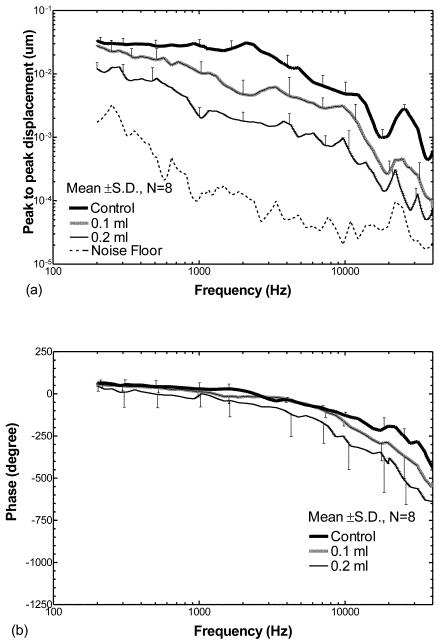
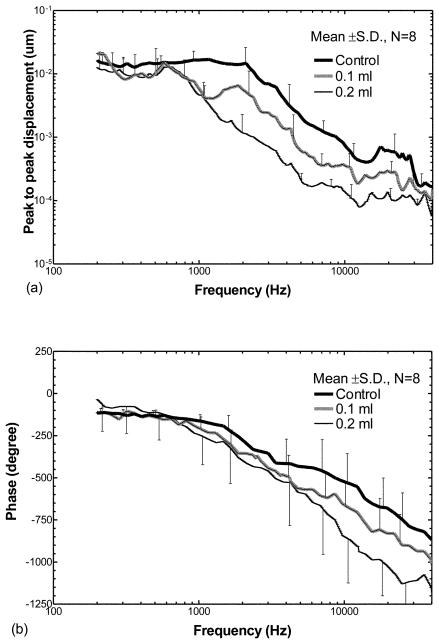
Figure 3 shows the mean displacement curves from eight ears of the TM at the umbo over frequencies of 200 Hz to 40 kHz when the middle ear cavity was either empty (control), half filled (0.1 ml saline) or fully filled (0.2 ml saline). Note that the maximum fluid of 0.2 ml was not injected in all ears due to the variation in size of the middle ear cavity in individual guinea pigs. Figure 3(a) displays the mean ± SD frequency response curves of the TM displacement magnitude. The mean ± SD phase curves of the displacement are shown in Fig. 3(b).
Figure 3.
Peak to peak displacement magnitude (a) and phase angle (b) of the TM (mean ± SD, N=8) in response to 80 dB SPL sound input at the ear canal when saline was injected into the middle ear cavity from 0 to 0.2 ml (filled the cavity). The bold lines represent the control curves; the grey lines represent the measurements on ears with 0.1 ml fluid in the middle ear; the thin lines represent the measurements on ears with 0.2 ml fluid.
The responses shown in Fig. 3(a) demonstrate that fluid in the middle ear reduced the displacement of the TM; this reduction was dependent on frequency as well as the amount of fluid in the cavity. The bold solid line represents the control response (no fluid in the middle ear) with higher values (~0.035 um) at low frequencies (< 2 kHz). Maximum displacement (0.04 μm) occurred around 2 kHz. A second peak of the TM displacement was observed at a higher frequency (22 - 26 kHz) with a value of 0.003 μm. The gray line displays the TM displacement from ears with 0.1 ml fluid in the middle ear cavity. The thin line represents the TM displacement from the ears with 0.2 ml fluid in the cavity. These results indicate that the TM displacement decreased with the increase in fluid volume in the middle ear over almost all frequencies. When the cavity was half-filled with fluid, the TM displacement decreased by a factor < 2 at frequencies below 500 Hz and decreased by a factor of 2-6 at higher frequencies. When the cavity was fully filled, the TM displacement decreased by a factor of 3.5-4 at frequencies below 500 Hz, and decreased further by a factor of 4-14 at frequencies above 500 Hz. The phase angles of the TM displacement measured from the ears at control, 0.1 ml, and 0.2 ml fluid levels (Fig. 3b) varied between 0° and 65° at low frequencies (≤ 1 kHz), and then decreased to about −450°, −550°, and −650° at 40 kHz in control ears, and the ears with 0.1 ml and 0.2 ml, respectively. The effects of middle ear fluid on TM movement observed in the present study are similar to the published results which were obtained from human temporal bones (Gan et al., 2006) and animal temporal bones (Dai and Gan, 2008).
Statistical analyses of the TM displacement magnitude data in Fig. 3(a) are listed in Table 1 (the first three columns under TM). A significant reduction of TM displacement between ears containing 0.1 ml fluid and non-filled controls was observed at frequencies ≥ 750 Hz. In contrast, the reduction of TM displacement between ears receiving 0.2 ml fluid and control ears was statistically significant over all frequencies. A significant reduction of TM displacement between ears with 0.2 ml fluid and those with 0.1 ml fluid also was observed over all frequencies except 21 kHz and >38 kHz.
Table 1.
| Frequency (Hz) | TM | Incus tip | RWM | ||||||
|---|---|---|---|---|---|---|---|---|---|
| * | ** | *** | * | ** | *** | * | ** | *** | |
| 250 | 0.084 | 0.012 | 0.016 | 0.365 | 0.009 | 0.057 | 0.246 | 0.163 | 0.182 |
| 500 | 0.051 | 0.003 | 0.013 | 0.155 | 0.021 | 0.146 | 0.376 | 0.182 | 0.350 |
| 750 | 0.029 | 0.000 | 0.005 | 0.075 | 0.028 | 0.113 | 0.466 | 0.353 | 0.431 |
| 1,000 | 0.027 | 0.000 | 0.002 | 0.071 | 0.027 | 0.258 | 0.023 | 0.013 | 0.118 |
| 2,000 | 0.004 | 0.001 | 0.015 | 0.005 | 0.001 | 0.033 | 0.017 | 0.004 | 0.048 |
| 4,000 | 0.006 | 0.000 | 0.033 | 0.005 | 0.001 | 0.028 | 0.015 | 0.173 | 0.498 |
| 6,000 | 0.039 | 0.001 | 0.005 | 0.005 | 0.000 | 0.023 | 0.001 | 0.004 | 0.018 |
| 8,000 | 0.036 | 0.000 | 0.002 | 0.026 | 0.000 | 0.021 | 0.020 | 0.004 | 0.021 |
| 10,000 | 0.024 | 0.002 | 0.006 | 0.038 | 0.000 | 0.016 | 0.003 | 0.003 | 0.017 |
| 15,000 | 0.002 | 0.000 | 0.024 | 0.022 | 0.000 | 0.086 | 0.003 | 0.025 | 0.028 |
| 20,000 | 0.006 | 0.002 | 0.021 | 0.014 | 0.039 | 0.135 | 0.046 | 0.026 | 0.275 |
| 30,000 | 0.004 | 0.001 | 0.018 | 0.261 | 0.018 | 0.296 | 0.851 | 0. 072 | 0.153 |
| 38,000 | 0.003 | 0.002 | 0.089 | 0.183 | 0.033 | 0.126 | 0.202 | 0.098 | 0.068 |
Note: P values were calculated by Student t-test between the ears with 0.1 ml fluid and control
ears with 0.2 ml fluid and control
and ears with 0.2 ml fluid and with 0.1 ml
When the movements of incus and RWM were measured, the glass sheet that covered the hole in the bulla was in the optical path of laser vibrometry. To assess the effect of the glass sheet on measurements, we measured the vibration of the glass sheet during experiments. The displacement-frequency curve of the glass sheet in control ear (without fluid) was almost identical to that found under the two fluid filled conditions (data not shown). There was no difference (< 3 dB) between the glass movement curve and the noise floor (dashed line in Fig. 3A). When the incus tip and RWM were measured, the influence of the glass sheet vibration could not be detected with a ratio of signal to noise greater than 20 dB from 400 Hz to 40 kHz (except 21 kHz) in the control condition, 15 dB from 300 Hz to 40 kHz (except 20-25 kHz) in the 0.1 ml filled condition, and 10 dB from 400 Hz to 40 kHz in the 0.2 ml filled condition (except 20-25 kHz).
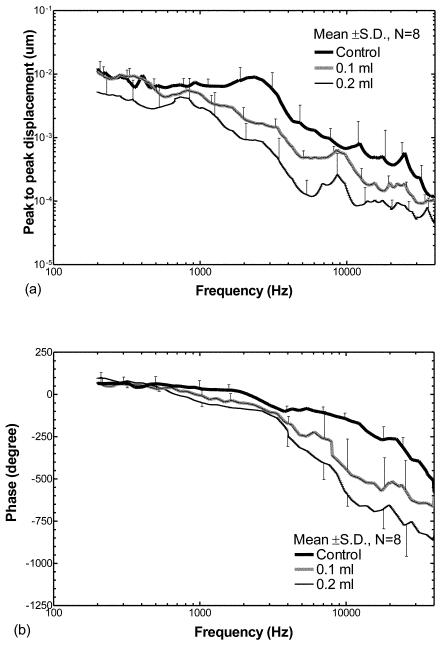
Figure 4 shows the effect of middle ear fluid on movement of the incus tip. Figure 4(a) displays the mean displacement magnitude curves measured in the eight ears; Fig. 4(b) shows the phase angle curves. When the cavity was injected with 0.1 ml fluid, the fluid had little effect on the displacement magnitude of the incus at frequencies of 200-500 Hz. A slight reduction of displacement magnitude was observed at 500-1000 Hz. There were significant reductions, by factors up to 5, across frequencies higher than 1 kHz except the 8 kHz and 40 kHz as shown in Fig. 4(a). When the middle ear fluid was increased to 0.2 ml (i.e., fully-filling the middle ear cavity), the reduction of displacement magnitude at high frequencies (> 1 kHz, by factors up to 9) was much greater than that at low frequencies (200-1000 Hz, by factors of 1.5-2). The phase angles of the incus tip measured from control ears and the ears with fluid (Fig. 4b) decreased from zero at 200 Hz to −500°, −650°, and −850°at 40 kHz for control, 0.1 ml, and 0.2 ml, respectively. Compared with the phase curves measured at TM, the fluid had more effect on phase drop of the incus tip at high frequencies (f>3 kHz).
Figure 4.
Peak to peak displacement magnitude (a) and phase angle (b) of the tip of the incus (mean ± SD, N=8) in response to 80 dB SPL sound input at the ear canal when saline was injected into the middle ear cavity from 0 to 0.2 ml. The bold lines represent the control curves; the grey lines represent the measurements on ears with 0.1 ml fluid in the middle ear; the thin lines represent the measurements on ears with 0.2 ml fluid.
The statistical data for the incus tip (Table 1) indicate that the reduction of incus displacement magnitude became significant between the ears with 0.1 ml fluid and control at frequencies of 2-20 kHz. The displacement magnitude was reduced significantly between ears with 0.2 ml fluid and control over all frequencies. A significant reduction of displacement was observed between ears with 0.2 ml fluid and those with 0.1 ml at frequencies of 2-10 kHz.
The curves in Fig. 5 present the fluid effect on RWM movement obtained from the eight ears. Figure 5(a) displays the mean displacement magnitude curves; phase angle curves are shown in Fig. 5(b). When 0.1 and 0.2 ml saline were injected into the middle ear cavity, there was almost no difference in RWM displacement magnitude between the control and 0.1 ml and 0.2 ml curves at frequencies below 700 Hz as shown in Fig. 5(a) and Table 1. A significant reduction of RWM displacement by factors of 2-4 was observed at frequencies of 0.8-30 kHz when 0.1 ml fluid presented in the middle ear. As the middle ear fluid increased to 0.2 ml, the RWM displacement decreased further by factors up to 12 at frequencies of 0.8-30 kHz. At frequencies greater than 30 kHz, no significant reduction of RWM displacement was observed in the ears with 0.1 ml and 0.2 ml saline in comparison with control ears. Between the ears with 0.1 ml fluid and those with 0.2 ml fluid, the significant reduction of RWM displacement magnitude was observed at 1-15 kHz as shown in Table 1. Mean phase angles of the RWM displacement in control ears and ears with 0.1 ml fluid started about −100° at 200 Hz (Fig. 5b). The phase decreased to about −850° in control ears and −1000° in 0.1 ml ears at 40 kHz. When the fluid increased to 0.2 ml, the phase started about −50° at 200 Hz and decreased to −1150° at 40 kHz.
Figure 5.
Peak to peak displacement magnitude (a) and phase angle (b) of the RWM (mean ± SD, N=8) in response to 80 dB SPL sound input at the ear canal when saline was injected into the middle ear cavity from 0 to 0.2 ml. The bold lines represent the control curves; the grey lines represent the measurements on ears with 0.1 ml fluid; the thin lines represent the measurements on ears with 0.2 ml fluid.
B. Effect of middle ear fluid on ABR measurement
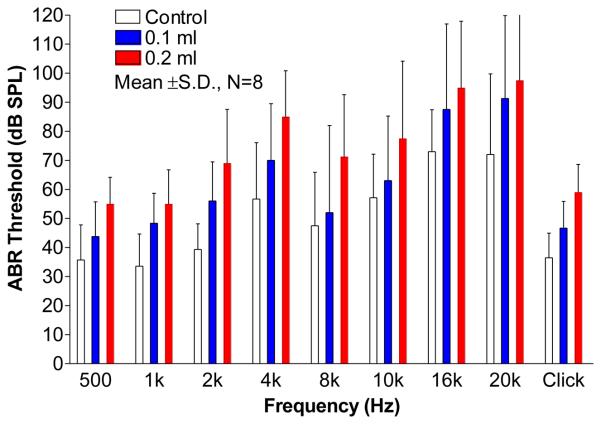
The auditory threshold of the animal was assessed by the ABR threshold when fluid in the middle ear cavity varied. In this study, the ABR measurements were made in eight ears before the laser measurements were performed in each ear. Results of ABR threshold (mean ± SD) are shown in Fig. 6. Elevation of ABR threshold was observed in ears in which fluid was present in the middle ear. Threshold elevation also was dependent on the frequency of stimulus. The click ABR threshold of control ears was about 36 dB SPL. It was elevated to 46 dB and 59 dB as fluid level in the cavity increased from 0 to 0.1 ml and 0.2 ml, respectively. With the introduction of the first 0.1 ml of saline, the ABR threshold (blue bars) became elevated relative to the control case (white bars) by more than 10 dB at 1, 2, 4, 16, and 20 kHz, and by less than 10 dB at 0.5, 8 and 10 kHz. With the introduction of the second 0.1 ml (the red bars), the ABR thresholds at 0.5, 2, 4, 8, and 10 kHz were further increased by more than 10 dB , and the thresholds at 1, 16, and 20 kHz were further increased by less than 10 dB. Petrova et al. (2006) reported that completely filling the middle ear of guinea pig with saline induced a 10 to 16 dB click ABR and pure tone ABR (1 kHz and 8 kHz) threshold elevation. Their findings were similar to our results.
Figure 6.
The effect of middle ear fluid on click and pure tone ABR thresholds (mean ± SD, N=8) at frequencies of 0.5 to 20 kHz.
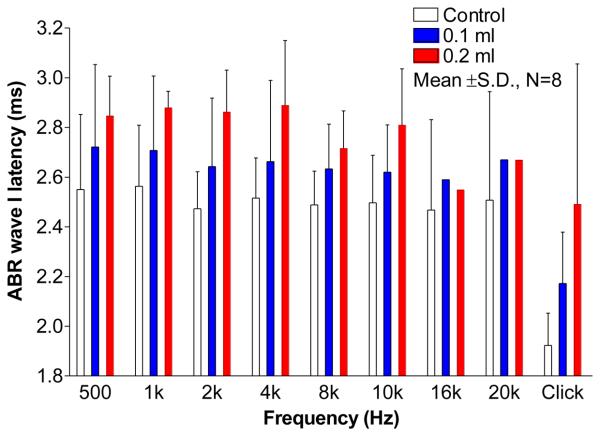
Figure 7 shows the latencies (mean ± SD) of ABR wave I in response to 80 dB stimulus. Note that the latencies at 16 kHz and 20 kHz in 0.1 ml and 0.2 ml cases were obtained from one ear. The pure tone ABR thresholds at 16 kHz and 20 kHz were beyond 80 dB in other ears following injection of 0.1 or 0.2 ml saline into the middle ear. The wave I latency of ABR in response to 80 dB click was 1.92 ms (mean) in control ears and delayed to 2.17 ms and 2.49 ms in 0.1 ml and 0.2 ml ears. Wave I latency of pure tone ABR over tested frequencies was around 2.51 ms in control ears (Fig. 7). As the fluid increased from 0 to 0.1 ml, the latency of wave I was prolonged more at low frequencies (2.72 ms at 500 Hz) than that at high frequencies (2.62 ms at 10 kHz). When the middle ear was filled with 0.2 ml fluid, the latencies of wave I were further prolonged by about 2.86 ms at 0.5, 1, 2, 4, and 10 kHz and by 2.71 ms at 8 kHz.
Figure 7.
The effect of middle ear fluid on latencies of ABR wave I (mean ± SD, N=8) at frequencies of 500 Hz to 10 kHz in response to 80 dB click and tone burst. The latencies at 16 and 20 kHz were obtained from one ear as fluid presented in the middle ear.
DISCUSSION
A. Comparison with published results
The effects of fluid (saline) in the middle ear of live guinea pigs on movements of the TM, the tip of the incus, the RWM, and ABR measurement are reported in this study. Reduction of the TM, incus, and RWM displacement was generally greater at high frequencies than that at low frequencies as fluid was introduced into the middle ear cavity. In human temporal bone studies, Ravicz et al. (2004) reported TM displacement following partial filling (Figure 5 in their paper) or entire filling of the middle ear cavity (Figure 8 in their paper). Their results suggested that a significant reduction of TM displacement occurred at frequencies greater than about 800 Hz when the TM was half covered with saline. This reduction was significant over the entire frequency range of measurement when the middle ear was fully filled. Gan et al. (2006) reported the effects of middle ear fluid on displacements of the TM and stapes at frequencies over 200 Hz to 10 kHz which were obtained from 11 human temporal bones. They investigated the changes of TM and stapes displacement when middle ear fluid was increased from 0 (control) to 0.6 ml (filled the cavity) in 0.1 ml step. The curves of TM and stapes displacements reported by Gan et al. (Figs. 9 and 11 in their paper) showed that the middle ear fluid reduced the movement of TM and stapes mainly at high frequencies. Dai and Gan (2008) created a guinea pig model of MEE by injecting LPS into the middle ear. Vibrations of the TM and RWM were measured at frequencies of 0.2-40 kHz in guinea pig temporal bones. Their data obtained from 3-day MEE guinea pigs (Fig. 6A and 7A in their paper) suggested that the middle ear fluid decreased the displacement of TM and RWM more significantly at high frequencies than at low frequencies. Turcanu et al. (2009) created the MEE in guinea pig ears and measured the displacement of umbo at 0-15 kHz. In their MEE model 40-70% of the eardrum was covered by the fluid. As shown in Fig. 2 in their paper, the TM displacement decreased more significantly at 1-2 kHz and 6-20 kHz than other frequencies.
Figure 8.
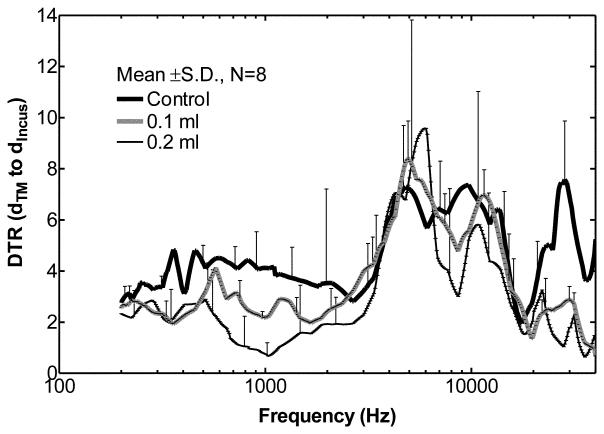
Transfer function of middle ear (mean ± SD, N=8), or DTR of the TM to incus tip in control ears (solid line), ears with 0.1 ml fluid (thick dash line) and ears with 0.2 ml fluid (thin dash line) in the middle ear.
Figure 9.
Volume DTR of the OV to RW (mean ± SD, N=8) in control ears (solid line), ears with 0.1 ml fluid (thick dash line) and ears with 0.2 ml fluid (thin dash line) in the middle ear.
Figure 11.
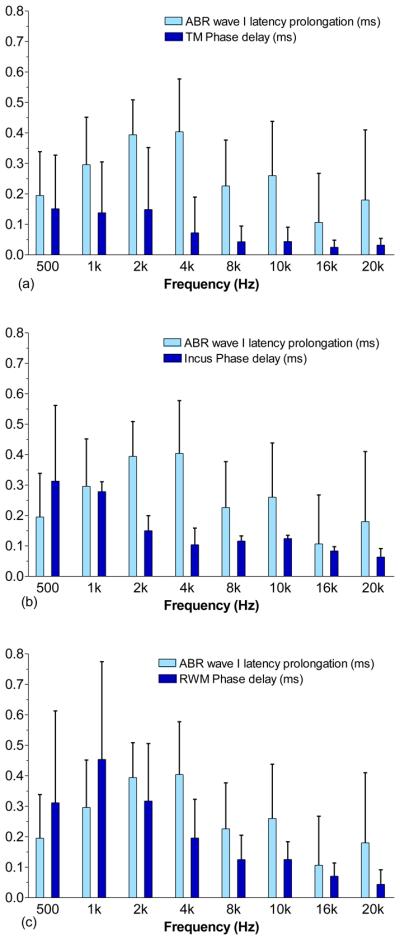
Comparison of prolongation of ABR wave I latency with phase delay of (a) the TM, (b) the incus tip, and (c) the RWM (mean ± SD, N=8) at frequencies of 0.5 to 20 kHz when the middle ear cavity was filled with 0.2 ml fluid. The latencies were measured at 80 dB SPL tone burst.
Our results measured from the TM, incus tip, and RWM in live guinea pigs were generally consistent with these published studies of middle ear fluid effects on movement of the TM, stapes, and RWM. Fluid in the middle ear reduced the movement of the TM, incus, and RWM more at high frequencies than at low frequencies. However, there was one discrepancy between our results and that reported by Ravicz et al. (2004). They suggested that the primary mechanism of TM mobility loss at low frequencies was a reduction of air space in the middle ear, and at high frequencies the reduction of TM mobility was due to an increase in TM mass by the fluid in the cavity. When the middle ear was entirely filled (i.e. no air space in the cavity), the TM mobility reduced by a factor of about 10 over all measured frequencies (Fig. 8 in their paper). Their results agreed with the mechanism of TM mobility loss which explained the huge reduction of TM movement at low frequencies when no air remained in the middle ear cavity. Our measurements on the fluid filled middle ear showed that the displacement reduction of the TM, incus tip, and RWM at low frequencies was less than a factor of 4. This indicated that the injected saline may not completely fill the middle ear and some air still remained in the cavity which was not visible in our experiment.
B. Middle ear fluid effect on transfer function of the middle ear
The transfer function of the middle ear can be represented by the displacement transmission ratio (DTR) of the TM to stapes footplate (Gan et al., 2006) or the DTR of the TM to RWM (Dai and Gan, 2008). In this study the DTR of the TM to the incus tip was used to describe transfer function of the middle ear when fluid was instilled into the middle ear. However, the DTR of the TM to incus tip may not reveal the true middle ear transfer function. Several studies on human temporal bones have shown that the motion of ossicular chain became more complex than the simple piston-like motion at high frequencies (Heiland et al., 1999; Hato et al., 2003; Chien et al., 2006), and the single point measurement on the tip of the incus may not represent the complex motion of ossicular chain completely. Chien et al. (2006) showed that other vibration modes of human ear ossicles may present at frequencies > 2 kHz. Decraemer and Khanna (2004) performed a 3-D measurement on the ossicular motion of human and cat ears. Their results suggested that the complex ossicular motion may present already at low frequencies and the complexities may increase with the frequency.
Curves for mean DTR values ± SD (n=8 ears) over the frequency range of 0.2 to 40 kHz are shown in Fig. 8. DTR values from different individual ears indicate that inter-individual differences, particularly at 2-20 kHz, do occur. In control ears, the displacement of TM was greater than the incus tip by factors of 3-5 at 0.2-2.5 kHz. At frequencies of 2.5-40 kHz, the TM displacement was higher than the incus by a factor of up to 8. Manley and Johnstone (1974) reported the mean incus tip displacement relative to the malleus in healthy guinea pig ears (n=3) and their results (Fig. 4 in their paper) suggested that the displacement of TM at malleus tip was greater than the incus by a factor up to 6 at 0.6-30 kHz. The malleus displacement was much greater than the incus by a factor up to 80 at 30-40 kHz and this was not observed in our measurements on the control ears. As noted in their report the displacement variations between ears (n=3) were large at 30-40 kHz. In our DTR results, the variations between animals were large (±4~7) at frequencies above 2 kHz. The inadequate statistics and the complex motion of incus may increase the inter-individual variations in the results of DTR, especially at high frequencies, and cause the difference of our results from those reported by Manley and Johnstone.
As shown in Fig. 8, when 0.1 or 0.2 ml fluid was present in the guinea pig middle ear, the TM displacement was greater than the incus tip by factors of 2-3 at 200-500 Hz. At frequencies of 0.5-2 kHz, the TM displacement was higher than the incus tip by factors of 2-4 in 0.1 ml ears, and by factors of 1-3 in 0.2 ml ears. At low frequencies the incus tip displacement was generally less affected than the TM by the fluid. A similar result can be observed at frequencies > 20 kHz where the TM displacement was higher than the incus by factors of 1-3. The measured displacement of incus tip decreased by a smaller amount compared with the umbo at f < 500 Hz and f > 20 kHz when the middle ear was flooded. At 2-20 kHz, due to the large SD the change of DTR in MEE ears was not as explicit as that at other frequencies. The alterations in DTR before and after fluid induction in the middle ear are consistent with fluid-induced alterations in complex ossicular motions. However, whether the difference in degree of decrease between the umbo and incus tip was due to the presence of an actual change in the mode of motion of the incus or some other process is not clear.
In human temporal bone studies, Gan et al. (2006) measured the TM displacement at the umbo and footplate displacement in the direction of piston-like motion from the cochlea side. The DTR did not change much with middle ear fluid at f<1 kHz as shown in Fig. 15 of their paper (DTR = 3~3.5 for control and MEE cases). There were variations of DTR at f>1 kHz. The DTR decreased at f = 1–4 kHz and increased at f = 4-8 kHz with a value about 1 when fluid filled the cavity. The DTRs measured in guinea pigs in this study (Fig. 8) show higher sensitivity of middle ear transfer function in response to middle ear fluid than that observed in human temporal bones by Gan et al. (2006). One possible factor that contributes to the discrepancy in DTR change between guinea pig and human is a species-related difference. Based on our measurement, the middle ear cavity of guinea pig is about 0.2-0.25 ml and the weight of ossicular chain is about 5-6 mg. According to published data, the air space within the tympanic cavity of adult human ear is about 0.6 ml (Gan et al., 2006) and the weight of ossicles is about 50-63 mg (Wever and Lawrence, 1982). When middle ear is filled with saline, the mass ratio of fluid to ossicles is about 33-40 in guinea pig which is greater than that in human (9.5-12). Due to the larger mass ratio of fluid to ossicles in guinea pig, the motion of ossicular chain could be more affected by fluid in guinea pig than in human.
Another possible factor for the different DTR changes between guinea pig and human temporal bone could be due to methodological differences. In human temporal bone studies, Hato et al. (2003) showed that piston-like motion of stapes would dominate the rotational motion when the cochlear fluid was drained. The DTR reported by Gan et al. (2006) was measured in ears without cochlear fluid which means the complex vibration modes of the ossicular chain may become essentially piston-like motion in their study. In this study, the guinea pig cochlea was intact during the experiments, and the displacement of incus tip may be more complicated than piston-like motion. However, our single point measurement method did not allow us to describe such complex motions. Whether the complex ossicular motion is changed by fluid is not clear and future works needs to be done.
C. Middle ear fluid effect on cochlear fluid movement
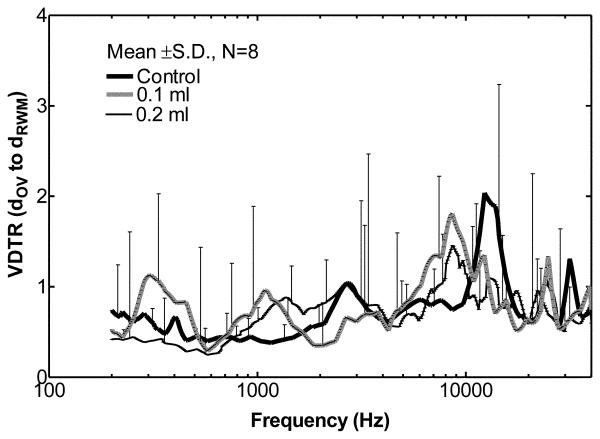
Stenfelt et al. (2004) assessed the volume displacement of the oval window (OV) to the round window (RW) by multiple points measurements at both windows using laser vibrometry in human temporal bones. They reported that the fluid volume displacements of the OV and RW were almost equal (the difference ≤3 dB) at 100 Hz to10 kHz. In our study, we also checked the volume displacement transmission ratio (VDTR) of the two cochlear windows of the guinea pig. Figure 9 presents our mean ± SD values for the VDTR of the OV to RW. These values were derived by the equation, , where dIncus and dRWM are the displacement of incus tip and RWM, respectively; AOV and ARWM are the typical areas of the OV (0.414 mm2) and RW (0.648 mm2) in guinea pigs (Wysocki and Sharifi, 2005). We used the displacement of the incus tip to represent the displacement of the stapes and assumed that the RWM moved as a plate with the velocity measured by laser vibrometry. As shown in Fig. 9, the mean VDTR of the OV to RW ranges from 0.3 to 2.1 over all tested frequencies in control and fluid-filled ears. Fluid in the middle ear changes the control VDTR by a factor of 0.4-2.4 as frequency varies. Our statistical analysis indicated that no significant change in VDTR occurred after fluid injection. Due to the large variation in the individual results, the VDTR is not significantly different than 1. This finding is consistent with the work of Stenfelt et al. (2004).
D. Correlation between ABR and laser measurement
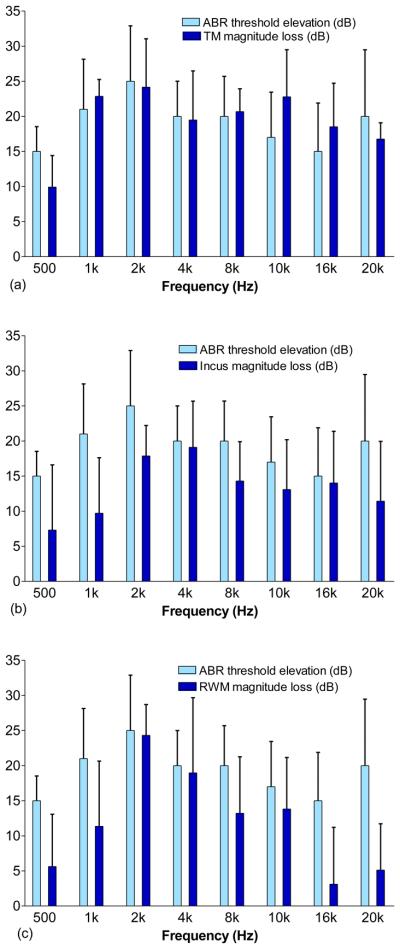
To investigate whether there was a correlation between ossicular mobility and conductive hearing loss, we compared the elevated ABR threshold measured at frequencies 0.5-20 kHz (Fig. 6) with the displacement loss of the TM, incus tip, and RWM in the same ears (Figs. 3-5). The findings of this comparison, when fluid in the middle ear increased from 0 to 0.2 ml, are shown in Fig. 10. The differences in changes of ABR threshold and displacement measurement among the tested ears might be due to differences in filling conditions, either water in different parts of the cavity or different levels of filling. As shown in Fig. 10a, the elevation of ABR threshold or conductive hearing loss correlates well with the loss of TM displacement at frequencies of 1-8 kHz. The differences are within 2 dB. At higher frequencies (10-20 kHz), the differences between the reduction of TM displacement and ABR loss are within 6 dB. The largest discrepancy between the TM loss and ABR loss is about 10 dB at 500 Hz. The correlation coefficient of the ABR and TM loss is about 0.93 at 0.5-8 kHz and 0.64 at 0.5-20 kHz. Figure 10b shows the correlation between the ABR threshold elevation or conductive hearing loss and displacement reduction of incus movement. Correlation coefficients of 0.67 at 0.5-8 kHz and 0.5 at 0.5-20 kHz were observed. The correlation between the hearing loss and RWM displacement loss is shown in Fig. 10c, with correlation coefficients of 0.88 at 0.5-8 kHz and 0.77 at 0.5-20 kHz. The results in Fig.10 suggest that, when the middle ear was filled with fluid, the change of TM displacement in general is a better indicator of hearing loss than the measurements at the incus and RWM. In a recent study by Qin et al. (2010), similar reductions in umbo velocity and ABR sensitivity were observed in mice when saline was introduced into the middle ear. Our results are consistent with the latter study. Thus the movement of the TM at the umbo may present a reasonable indicator of hearing loss in the ears with MEE.
Figure 10.
Comparison of the elevation of ABR threshold with the magnitude loss of (a) the TM, (b) the incus tip, and (c) the RWM (mean ± SD, N=8) at frequencies of 0.5 to 20 kHz when the middle ear cavity was filled with 0.2 ml fluid.
Turcanu et al. (2009) measured the CAP thresholds at 1-32 kHz and the umbo mobility at 0.2-15 kHz in normal and hearing-impaired ears in another guinea pig study. The MEE model was created in 4 ears and there was no direct comparison between the CAP threshold loss and umbo mobility loss. The mean CAP threshold elevation was about 12-20 dB and the mean TM mobility loss was 6-12 dB at frequencies of 1-10 kHz (deduced from Figs. 1 and 2 in their paper). The CAP threshold elevation was generally larger than the TM displacement loss at 1-10 kHz, which is different from the measurements in our study. However, minimum loss of umbo mobility was 6 dB at 4 kHz while about 18 dB elevation of CAP threshold (almost the maximum value) was observed at this same frequency. Our results show some dissimilarities to their findings. It is noticed that the conductive hearing loss was assessed by the ABR in our study which may be different from that evaluated by the CAP measurement.
Figure 11 shows the comparison of the prolongation of ABR wave I latency with the phase delay of the movements of TM (Fig. 11a), incus tip (Fig. 11b), and RWM (Fig. 11c) when the middle ear was filled with saline. The mean prolongation of ABR latency was derived from 8 ears, and the phase delay of TM displacement was calculated from the same 8 ears by the equation, , where Δφ is the difference of phase angle between control and 0.2 ml ears, and f is the frequency. As shown in Fig. 11, the ABR latency prolongation increased along with the frequency and reached the peak of 0.4 ± 0.2 ms at 4 kHz. The prolongation was 0.1-0.3 ms at 8-20 kHz. The phase delay of the TM, incus tip, and RWM generally decreased as the frequency increased from 0.5-20 kHz except that an increase of the RWM delay was observed from 0.5 to 1 kHz.
The correlations between the ABR latency prolongation and displacement phase delay are poor as shown in Fig. 11. The latency of ABR can be affected by the place of generation along the cochlea, stimulus level, and degree of hearing loss (Burkard and Don, 2007). Therefore, the mechanism of ABR latency prolongation is complicated. In ears with MEE, the prolongation of ABR latency may be caused by the conductive hearing loss and the delayed movement of the TM and ossicular chain with respect to stimuli in the ear canal. Thus, the change in phase of the TM and ossicular displacements is not a good indicator of the prolongation of ABR latency after water filling.
In summary, there are several factors which could affect the degree of correlation between the ABR threshold elevation and the ossicular displacement reduction or between the ABR wave-latency prolongation and displacement phase delay as shown in Figs. 10 and 11. These factors include the following: 1) the location of vibration measurement (e.g., TM, incus, or RWM); 2) the frequency (e.g., 0.5-8 kHz, and >8 kHz); 3) fluid volume (e.g., 0, 0.1 or 0.2 ml). The best correlation between the hearing loss and ossicular mobility loss is the correlation between the ABR threshold elevation and TM displacement reduction as shown in Fig. 10. The correlations between the ABR latency prolongation and displacement phase delay are poor in all cases (Fig. 11). The MEE seems to produce conductive hearing loss by reducing the movement of the TM and umbo, which can be directly reflected by the ABR threshold elevation. Change of the TM and ossicular motion phase may not contribute much in hearing loss, particularly in terms of the latency of ABR wave propagation. Finally, the ABR threshold and TM displacement or velocity measurement is sensitive to frequency. At certain frequencies, such as f=0.5-8 kHz for guinea pig, a good correlation between conductive hearing loss and mobility of the TM was observed. Overall, our study has succeeded in identifying a quantitative correlation between the conductive hearing loss and ossicular mobility loss for MEE ears.
E. Future studies
The middle ear fluid effect on movements of the TM, the tip of the incus, and the RWM was investigated under acoustic stimuli across the frequencies range of 0.2-40 kHz. The click and pure tone ABR threshold and wave I latencies were recorded as the fluid was instilled into the middle ear. However, further studies are needed to investigate the effect of fluid on 3-D ossicular vibration mode and stapes movement, so that the mechanism for the change of middle ear transfer function in ears with MEE will be illustrated more accurately. More studies are also needed on the correlation between the reduction, delay of TM and ossicles movement, and the ABR latency prolongation in MEE ears.
CONCLUSION
A middle ear effusion model was created in live guinea pigs by injecting saline into the middle ear cavity. Displacements of the TM, incus tip, and RWM were measured using the laser vibrometer before and after instilling saline into the middle ear. The transfer function of the middle ear and the volume displacement transmission ratio of OV to RW were obtained when fluid volume varied in the middle ear. Associated with the laser measurement, the ABR threshold and wave I latency were recorded as fluid was presented in the cavity. The results demonstrate that the middle ear fluid reduced the displacement of TM, IS joint and RWM mainly at high frequencies and the reduction was related to the volume of fluid in the cavity. Middle ear transfer function varied with the frequency and fluid volume. Mean volume displacements of OV and RW varied between 0.3 and 2.1 in all filling conditions and was not significantly different than 1 over the frequency range of 0.2-40 kHz. Elevation of ABR threshold agreed with the loss of TM displacement at umbo at frequencies of 1-8 kHz when the middle ear was filled with fluid. Alterations in the ratio of ossicular displacements before and after fluid induction were consistent with fluid-induced alterations in complex ossicular motions.
ACKNOWLEDGMENT
This work was supported by Oklahoma Center for the Advancement of Science and Technology (HR06-036 and HR09-033) and NIH/NIDCD R01DC006632. The authors thank Wei Li, MS, former student in BME lab at University of Oklahoma, and Don Nakmali at Hough Ear Institute for their expert technical assistance. The authors also thank Dr. Thomas Seale at the University of Oklahoma Health Sciences Center for editing this paper. Two anonymous reviewers are gratefully acknowledged for their great suggestions to improve the paper.
Footnotes
Publisher's Disclaimer: This is a PDF file of an unedited manuscript that has been accepted for publication. As a service to our customers we are providing this early version of the manuscript. The manuscript will undergo copyediting, typesetting, and review of the resulting proof before it is published in its final citable form. Please note that during the production process errors may be discovered which could affect the content, and all legal disclaimers that apply to the journal pertain.
REFERENCES
- Beery QC, Andrus WS, Bluestone CD, Cantekin EI. Tympanometric pattern classification in relation to middle ear effusions. Ann. Otol. Rhinol. Laryngol. 1975;84:56–64. doi: 10.1177/000348947508400109. [DOI] [PubMed] [Google Scholar]
- Bluestone CD, Beery QC, Paradise JL. Audiometry and tympanometry in relation to middle ear effusions in children. Laryngoscope. 1973;83:594–604. doi: 10.1288/00005537-197304000-00015. [DOI] [PubMed] [Google Scholar]
- Bluestone CD, Klein JO. Otitis media with effusion, atelectasis, and eustachian tube dysfuncion. In: Bluestone CD, Stool SE, editors. Pediatric Otolaryngology. W. B. Saunders Company; Philadelphia, PA: 1983. pp. 421–432. [Google Scholar]
- Burkard RF, Don M. The auditory brainstem response. In: Burkard RF, Don M, Eggermont JJ, editors. Auditory Evoked Potentials: basic principles and clinical application. Lippincott Williams & Wilkins; Philadelphia, PA: 2007. pp. 229–253. [Google Scholar]
- Chien W, Ravicz ME, Merchant SN, Rosowski JJ. The effect of methodological differences in the measurement of stapes motion in live and cadaver ears. Audiol. Neurootol. 2006;11:183–197. doi: 10.1159/000091815. [DOI] [PMC free article] [PubMed] [Google Scholar]
- Dai C, Gan RZ. Change of middle ear transfer function in otitis media with effusion model of guinea pigs. Hear. Res. 2008;243:78–86. doi: 10.1016/j.heares.2008.05.010. [DOI] [PMC free article] [PubMed] [Google Scholar]
- Dai C, Wood MW, Gan RZ. Tympanometry and laser Doppler interferometry measurements on otitis media with effusion model in human temporal bones. Otol. Neurotol. 2007;28:551–558. doi: 10.1097/mao.0b013e318033f008. [DOI] [PubMed] [Google Scholar]
- Decraemer WF, Khanna SM. Measurement, Visualization and Quantitative Analysis of Complete Three-Dimensional Kinematical Data Sets of Human and Cat Middle Ear. In: Gyo K, Wada H, editors. Proceedings of the 3rd Symposium on Middle Ear Mechanics in Research and Otology; Singapore: World Scientific; 2004. pp. 3–10. [Google Scholar]
- Dirks DD, Morgan DE. Tympanometry and acoustic reflex testing. In: Canalis RF, Lambert PR, editors. The ear: Comprehensive Otology. Lippincott Williams & Wilkins; Philadelphia, PA: 2000. pp. 223–229. [Google Scholar]
- Francon M. Optical interferometry. Academic Press; New-York: 1966. [Google Scholar]
- Gaihede M, Bramstoft M, Thomsen LT, Fogh A. Accuracy of tympanometric middle ear pressure determination in secretory otitis media: dose-dependent overestimation related to the viscosity and amount of middle ear fluid. Otol. Neurotol. 2005;26:5–11. doi: 10.1097/00129492-200501000-00003. [DOI] [PubMed] [Google Scholar]
- Gan RZ, Dai C, Wood MW. Laser interferometry measurements of middle ear fluid and pressure effects on sound transmission. J. Acoust. Soc. Am. 2006;120:3799–3810. doi: 10.1121/1.2372454. [DOI] [PubMed] [Google Scholar]
- Gan RZ, Dyer RK, Wood MW, Dormer KJ. Mass loading on the ossicles and middle ear function. Ann. Otol. Rhinol. Laryngol. 2001;110:478–485. doi: 10.1177/000348940111000515. [DOI] [PubMed] [Google Scholar]
- Giebink GS, Quie PG. Otitis media: the spectrum of middle ear inflammation. Ann. Rev. Med. 1978;29:285–306. doi: 10.1146/annurev.me.29.020178.001441. [DOI] [PubMed] [Google Scholar]
- Hato N, Stenfelt S, Goode RL. Three-dimensional stapes footplate motion in human temporal bones. Audiol. Neurootol. 2003;8:140–52. doi: 10.1159/000069475. [DOI] [PubMed] [Google Scholar]
- Heiland KE, Goode RL, Asai M, Huber AM. A human temporal bone study of stapes footplate movement. Am. J. Otol. 1999;20:81–6. [PubMed] [Google Scholar]
- Larsson C, Dirckx JJ, Bagger-Sjoback D, von Unge M. Pars flaccida displacement pattern in otitis media with effusion in the gerbil. Otol. Neurotol. 2005;26:337–343. doi: 10.1097/01.mao.0000169770.31292.75. [DOI] [PubMed] [Google Scholar]
- Larsson C, Dirckx JJ, Decraemer WF, Bagger-Sjoback D, von Unge M. Pars flaccida displacement pattern in purulent otitis media in the gerbil. Otol. Neurotol. 2003;24:358–364. doi: 10.1097/00129492-200305000-00002. [DOI] [PubMed] [Google Scholar]
- Manley GA, Johnstone BM. Middle-ear function in the guinea pig. J. Acoust. Soc. Am. 1974;56:571–576. doi: 10.1121/1.1903292. [DOI] [PubMed] [Google Scholar]
- Petrova P, Freeman S, Sohmer H. The effects of positive and negative middle ear pressures on auditory threshold. Otol. Neurotol. 2006;27:734–738. doi: 10.1097/01.mao.0000226296.28704.de. [DOI] [PubMed] [Google Scholar]
- Qin Z, Wood M, Rosowski JJ. Measurement of conductive hearing loss in mice. Hear. Res. 2010;263:93–103. doi: 10.1016/j.heares.2009.10.002. [DOI] [PMC free article] [PubMed] [Google Scholar]
- Ravicz ME, Rosowski JJ, Merchant SN. Mechanisms of hearing loss resulting from middle-ear fluid. Hear. Res. 2004;195:103–130. doi: 10.1016/j.heares.2004.05.010. [DOI] [PubMed] [Google Scholar]
- Shanks J, Shelton C. Basic principles and clinical applications of tympanometry. Otolaryngol. Clin. North. Am. 1991;24:299–328. [PubMed] [Google Scholar]
- Stenfelt S, Hato N, Goode RL. Fluid volume displacement at the oval and round windows with air and bone conduction stimulation. J. Acoust. Soc. Am. 2004;115:797–812. doi: 10.1121/1.1639903. [DOI] [PubMed] [Google Scholar]
- Turcanu D, Dalhoff E, Muller M, Zenner HP, Gummer AW. Accuracy of velocity distortion product otoacoustic emissions for estimating mechanically based hearing loss. Hear. Res. 2009;251:17–28. doi: 10.1016/j.heares.2009.02.005. [DOI] [PubMed] [Google Scholar]
- von Unge M, Decraemer WF, Dirckx JJ, Bagger-Sjoback D. Shape and displacement patterns of the gerbil tympanic membrane in experimental otitis media with effusion. Hear. Res. 1995;82:184–196. doi: 10.1016/0378-5955(94)00017-k. [DOI] [PubMed] [Google Scholar]
- Wever EG, Lawrence M. Physiological acoustics. Princeton University Press; Princeton: 1982. [Google Scholar]
- Wysocki J, Sharifi M. Measurements of selected parameters of the guinea pig temporal bone. Folia Morphol (Warsz) 2005;64:145–150. [PubMed] [Google Scholar]


