Abstract
Mutation within an ubiquitin E3 ligase gene can lead to a failure in Notch signaling, excessive neurons, and depletion of neural progenitor cells in mind bomb mutants. Using mibhi904 zebrafish, we reported seizures and a down-regulation of GABA signaling pathway genes. A transcriptome analysis also identified differential expression pattern of genes related to Notch signaling and neurodevelopment. Here we selected nine of these genes (her4.2, hes5, bhlhb5, hoxa5a, hoxb5b, dmbx1a, dbx1a, nxph1 and plxnd1) and performed a more thorough analysis of expression using conventional polymerase chain reaction, real-time polymerase chain reaction and in situ hybridization. Transgenic reporter fish (Gfap:GFP and Dlx5a-6a:GFP) were used to assess early brain morphology in vivo. Down-regulation of many of these genes was prominent throughout key structures of the developing mibhi904 zebrafish brain including, but not limited to, the pallium, ventral thalamus, and optic tectum. Brain expression of Dlx5a-6a and Gfap was also reduced. In conclusion, these expression studies indicate a general down-regulation of Notch signaling genes necessary for proper brain development and suggest that these mutant fish could provide valuable insights into neurological conditions, such as Angelman syndrome, associated with ubiquitin E3 ligase mutation.
Keywords: brain, development, GFP, Notch, zebrafish
INTRODUCTION
Notch signaling plays an essential role in early brain development including, but not limited to, cell fate determination (Dontu et al., 2004), pattern formation (Lewis et al., 2009), neurogenesis and gliogenesis (Jülich et al., 2005; Taylor et al., 2007; Wheeler et al., 2008; Xiao et al., 2009). Membrane-bound Notch is proteolyzed by TNFα-converting enzyme, metalloproteases and presenilin into an active form that is translocated to the nucleus where it forms a complex with CSL (CBF1/RBP-Jκ, Su(H), Lag-1) (Jarriault et al., 1995; Lu et al., 1996). This complex is a transcriptional activator triggering expression of downstream target genes such as Hairy/Enhancer-of-split (Hes), which inhibit basic helix-loop-helix transcription factors with additional roles in neurodevelopment (Lecourtois and Schweisguth, 1998; Mumm and Kopan, 2000; Bailey and Posakony, 1995; Hirata et al., 2002a; Holley et al., 2002a; Oates and Ho, 2002b).
Mutagenesis screens in zebrafish have identified several mutants of the Notch signaling pathway: after eight (aei) (delta D), deadly seven (des) (notch 1a), beamter (bea) (delta C) and mind bomb (mib)(Jiang et al., 1996a; vanEeden et al., 1996a). Loss-of-function mutations in zebrafish display a so-called “neurogenic” phenotype, marked by overproduction of primary neurons early in development and a later reduction in secondary neurons. The mutation identified in mibhi904 zebrafish disrupts a conserved putative E3 ubiquitin ligase regulating Notch signaling (Golling et al. 2002a; Chen and Corliss, 2004b). Ubiquitin ligases which contain substrate-binding domains providing critical elements for specificity of target proteins or catalytic domains (such as HECT and RING fingers), comprise one of the largest families of enzymes in human cells, and have been linked to multiple human diseases. For example, the human neurogenetic disorder, Angelman syndrome (AS), can be caused by loss-of-function mutations in E3 ubiquitin ligase (ube3a) (Kishino et al., 1997). Phenotypic hallmarks of AS include motor dysfunction leading to an ataxic gait, frequent severe seizures, profound learning disability, absent speech, and characteristic happy demeanor (Lossie et al., 2001). Mouse models of AS exhibit an increased incidence of seizures, poor performance on Rotarod assays, and defects in long-term potentiation (Jiang et al., 1998; Miura et al., 2002). We recently showed that a mibhi904 E3 ubiquitin ligase mutant zebrafish exhibits electrographic and behavioral seizure activity (Hortopan et al. 2010). A transcriptome analysis of mibhi904 zebrafish, at three days post-fertilization (dpf), identified differential expression of GABA signaling pathway and neurodevelopmental (Notch signaling pathway related) genes (Hortopan et al. 2010). In the previous manuscript, we focused on analysis of GABA signaling genes as these may directly underlie the observed epileptic phenotype. Here we examined expression of a group of microarray-identified neurodevelopment genes in the central nervous system of mibhi904 zebrafish at 3 dpf e.g., a larval time point when these mutants exhibit a severe neurogenic phenotype and epilepsy. Confocal analysis of early brain development using live GFP reporter fish (Gfap:GFP and Dlx5/6:GFP) was also performed.
RESULTS
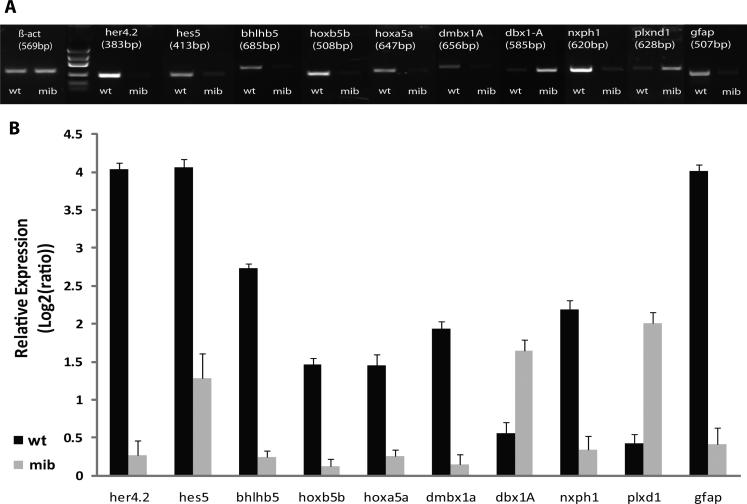
A transcriptome analysis using an Affymetrix zebrafish microarray containing 16,416 genes was recently performed on mibhi904 mutants (homozygotes) and age-matched sibling controls at 3 dpf (Hortopan et al. 2010). Microarray data was validated using conventional reverse transcriptase-polymerase chain reaction (RT-PCR) and real-time quantitative PCR (qPCR) for nine genes with putative roles in neurodevelopment (Table 1; Fig. 1). To further define the expression of these genes, we completed in situ hybridization studies using whole-mount larvae and cryostat sections through the central nervous system. Results of these studies are presented in detail below.
Table 1.
Summary of data extracted from microarrays. Statistical analysis (Ttest, GeneSpring GX 7.3.1) and qPCR analysis (SPSS, two-tailed Student's t test) are shown. GenBank ID, fold changes and P-values.
| Gene name | Genbank ID | array-fold | qPCR-fold | p-value (array) | p-value (qPCR) |
|---|---|---|---|---|---|
| hairy-related 4.2 | BC049296 | –3.65 | –3.7 | 0.04 | 0.003 |
| hairy and enhancer of split 5 | AY264404 | –2.54 | –2.7 | 0.02 | 0.001 |
| Basic helix-loop-helix domain containing, class B, 5 | BC053312 | –5.49 | –2.5 | 0.03 | 0.001 |
| homeo box A5a | NM_131540 | –2.02 | –1.2 | 0.02 | 0.029 |
| homeobox protein (hoxb5b) gene | NM_131537 | –2.07 | –1.4 | 0.05 | 0.014 |
| diencephalon/mesencephalon homeobox 1a | AY071922 | –2.00 | –1.8 | 0 .01 | 0.001 |
| developing brain homeobox 1a | NM_131158 | 2.69 | 1.1 | 0.03 | 0 .017 |
| neurexophilin 1 | BM072355 | –2.21 | –1.9 | 0.05 | 0.001 |
| plexin D1 | BI878456 | 2.96 | 1.6 | 0.04 | 0.005 |
| glial fibrillary acidic protein | AF506734 | –6.27 | –3.59 | 0.009 | 0.002 |
Fig.1.
Gene expression detection of all the genes of interest (gfap included), using (A) RT-PCR in 2% ethidium bromide agarose gel electrophoresis and (B) quantitative real-time PCR (qPCR). Levels of mRNA, measured by qPCR were normalized to β-act. Error bars indicate ± SEM. Student's t-test, p<0.05. Abbreviations: bhlhb5, basic helix-loop-helix domain containing, class B, 5; dbx1a, developing brain homeobox 1a; dmbx1a, diencephalon/mesencephalon homeobox 1a; gfap, glial fibrillary acidic protein; her4.2, hairy-related 4.2; hes5, hairy and enhancer of split 5; hoxa5a, homeo box A5a; hoxb5b, homeobox protein (hoxb5b) gene; nxph1, neurexophilin 1; plxnd1, plexin D1.
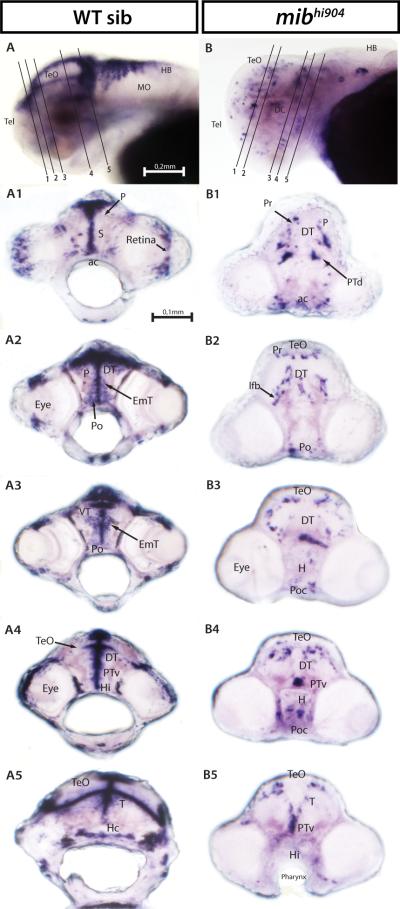
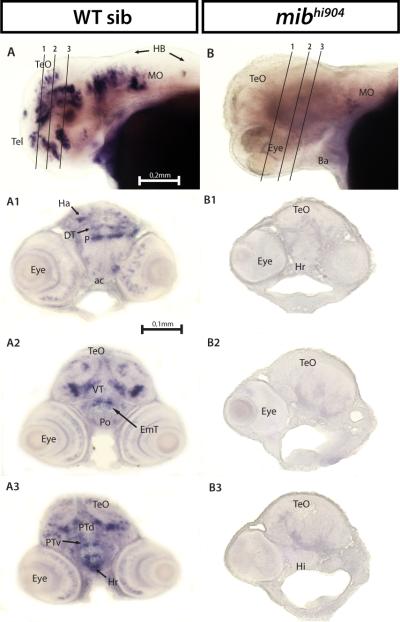
Hairy-related 4.2 (her4.2) and hairy/enhancer of split 5 (hes5), Notch responsive basic helix-loop-helix genes (Takke and Campos-Ortega, 1999; Kawamura et al., 2005; Bae et al., 2005; Hegde et al., 2008b), show a significant 4-fold microarray and 3-fold real-time qPCR decrease in mibhi904 zebrafish consistent with prior observations in mibta52b mutants (Hwang et al., 2009b). A lateral view of the head, in whole-mount in situ hybridization (WISH), for WT control zebrafish revealed prominent her4.2 mRNA expression in forebrain, midbrain and hindbrain (Fig. 2A). Transverse cryostat sections showed a more detailed expression pattern of her4.2 in telencephalon, especially in the large pallial domain and continued posteriorly into subpallium through the anterior commissure (Fig. 2A1). In diencephalon, strongly homogenous clusters of her4.2 cells can be found along the midline in dorsal (Fig. 2A2) and ventral thalamus (Fig. 2A3). Caudal to pallium, her4.2 expression appears in the eminentia thalami and preoptic region (Figs. 2A2-A3). Metencephalon (midbrain) displays strong and extensive her4.2 expression in the ventral region of posterior tuberculum and in the intermediate and caudal hypothalamus (Figs. 2A4-A5). Still at midbrain level, more posteriorly in the mesencephalon, her4.2 expression is prominent down the midline and as a band along the optic tectum and tegmentum boundary (Figs. 2A4-A5). In contrast, her4.2 WISH expression is dramatically reduced in age-matched mibhi904 mutants and detectable only in sparsely distributed clusters throughout the CNS. A lateral WISH view, shows only a few small clusters of her4.2 cells in subpallium and pallium (compare Figs. 2B and 2A). Transverse cryostat sections of the forebrain clearly demonstrate the presence of only small clusters of her4.2 expression in pretectum, dorsal region of the posterior tuberculum and anterior commissure (Fig. 2B1). Diencephalon displays diffuse small clusters of her2.4 expression in dorsal thalamus and in the lateral forebrain bundle (Figs. 2B2-B3). In optic tectum, medial, basal and lateral small clusters of her2.4 can be seen throughout the three transverse cryostat sections (Figs. 2B3-B5), together with small her2.4 expressing cell clusters located in the ventral region of posterior tuberculum (Figs. 2B4-B5) and hypothalamus (Fig. 2B4). Midline expression was strongly reduced in mibhi904 mutants and no detectable expression was noted in the retina.
Fig. 2.
her4.2 mRNA expression in WT sibling (left panels) and mibhi904 mutant zebrafish (right panels) by in situ hybridization. Whole mounts are shown in lateral views (A, B). A1-A5: WISH transversal cryostat sections of a stage 72 hours post-fertilization (hpf) WT sibling at levels illustrated by the dashed lines in A. B1-B5: WISH transversal cryostat sections of a stage 72 hpf mibhi904 mutant at levels illustrated by the dashed lines in B. Note that dashed lines were indicatively drawn here (and in all subsequent figures) to reflect the approximate cutting angle and location. Abbreviations: ac, anterior commissure; DC, diencephalon; DT, dorsal thalamus; EmT, eminentia thalami; H, hypothalamus; HB, hindbrain; Hc, caudal hypothalamus; Hi, intermediate hypothalamus; lfb, lateral forebrain bundle; MO, medulla oblongata; P, pallium; Po, preoptic region; Poc, postoptic commissure; Pr, pretectum; PTd, dorsal part of posterior tuberculum; PTv, ventral part of posterior tuberculum; S, subpallium; T, midbrain tegmentum; Tel, telencephalon; TeO, tectum opticum; VT, ventral thalamus. Scale Bar: 0.2 mm (A, B), 0.1 mm (A1-A5, B1-B5).
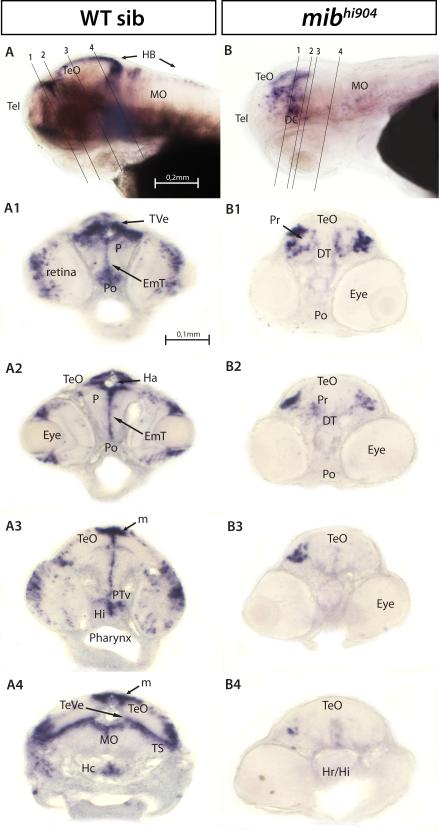
A similar, though somewhat less prominent, pattern of WISH expression was found for hes5. Of interest in WT controls, a distinct pattern of hes5 expression, with a predominant accumulation in forebrain and midbrain, was observed (Fig. 3A). In cryostat sections through telencephalon, pallium and subpallium, hes5 expression appears near the ventricular surface (Fig. 3A1). In diencephalon, hes5 signal continues into the optic tectum (Figs. 3A2-A4), eminentia thalami and preoptic region (Figs. 3A1-A2) as well as the ventral portion of posterior tuberculum and intermediate hypothalamus (Fig. 3A3). Strong hes5 expression was noted near the tectal ventricle, torus semicircularis and rostral region of medulla oblongata (Fig. 3A4). “Blobs” of hes5 expression in caudal hypothalamus are also present. As described above for her4.2, strong hes5 expression is seen in the retina of WT zebrafish (Fig. 3A1) but not age-matched mibhi904 mutants; WISH also revealed a cluster of hes5 expression primarily restricted to midbrain (Fig. 3B). Transverse sections show hes5-expressing aggregates corresponding to early migrating cells in the pre-tectum (Figs. 3B1-B2) that fail to extend down into thalamus and hypothalamus (Figs. 3B3-B4).
Fig. 3.
hes5 mRNA. Whole mounts are shown in lateral views (A, B). A1-A4: WISH transversal cryostat sections of a stage 72 hpf WT. B1-B4: WISH transversal cryostat sections of a stage 72hpf mibhi904. Note that it is difficult to precisely match thin cut sections of the larval zebrafish (e.g., eye is smaller in B3 and B4) and this does not reflect an asymmetrical expression pattern in the midbrain. Abbreviations (as in A): Ha, habenula; Hr, rostral hypothalamus; m, medial tectum opticum; PTv, ventral part of posterior tuberculum; TeVe, tectal ventricle; TS, torus semicircularis; TVe, telencephalic ventricle. Scale Bar: 0.2 mm (A, B), 0.1 mm (A1-A4, B1-B4).
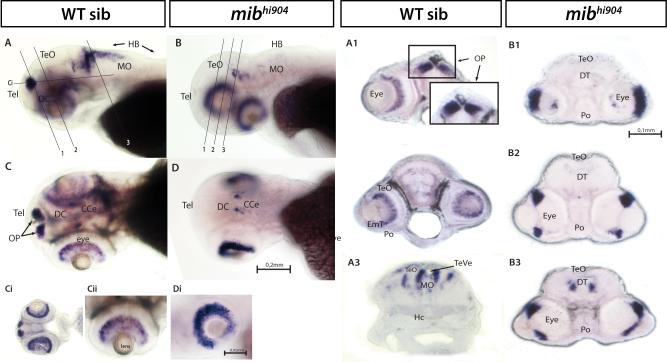
Class B5 (bhlhb5), a basic helix-loop-helix domain containing transcription factor (Brunelli et al., 2003), exhibited a 5-fold down-regulation in microarray and almost 3-fold down-regulation in qPCR in mibhi904 mutants compared to controls. Lateral and dorsal WISH views in WT controls revealed prominent bhlhb5 expression at the forebrain and midbrain-hindbrain boundary (Figs. 4 A-B). Strong forebrain expression is also present in the olfactory pits, as noted in transverse and coronal sections (Figs. 4A1, 4Ci). Although only faint diencephalic bhlhb5 expression appears in transverse sections (Fig. 4A2), bhlhb5 can be seen clearly in dorsal views and coronal sections (Fig. 4C, Ci). More posteriorly in optic tectum, approximately at the level of the tectal ventricle, bhlhb5 expression becomes even stronger (Fig. 4A3). In addition, bhlhb5 is expressed in the WT eye where it is normally distributed into retinal nuclear layers. It has been shown that targeted deletion of Bhlhb5 causes loss of GABA-producing amacrine and Type 2 OFF-cone bipolar cells (Feng et al., 2006; Dulin et al., 2007). Considering the crucial role of Bhlhb5 in the specification of both cell subtypes, this could explain why expression is more diffuse in the mibhi904 mutant eye where the retinal layers do not appear to differentiate (Figs. 4B2 and 4Di). Also, in mind bomb mutants, there is no detectable bhlhb5 expression in the olfactory pits (Figs. 4B, B1, D) and only faint or weak expression in diencephalon (dorsal thalamus) (Figs. 4B2-3).
Fig. 4.
bhlhb5 mRNA expression. Whole mounts are shown in lateral (A, B) and dorsal views (C, D). Smaller panels (Ci, Di) show a higher magnification of the eye, in lateral views. Note the mibhi904 mutant eye where the retinal layers fail to differentiate. A1-A3: WISH transversal cryostat sections of a stage 72 hpf WT. A4-A5: WISH coronal cryostat sections of a stage 72 hpf WT. B1-B3: WISH transversal cryostat sections of a stage 72 hpf mibhi904 mutant. Abbreviations (as above): CCe, cerebellum; INL, inner nuclear layer; GCL, ganglion cell layer; ONL, outer nuclear Layer; OP, olfactory pits. Scale Bar: 0.2 mm (A, B, C, D), 0.1 mm (A1-A5, B1-B3), 0.05 mm (Ci, Di).
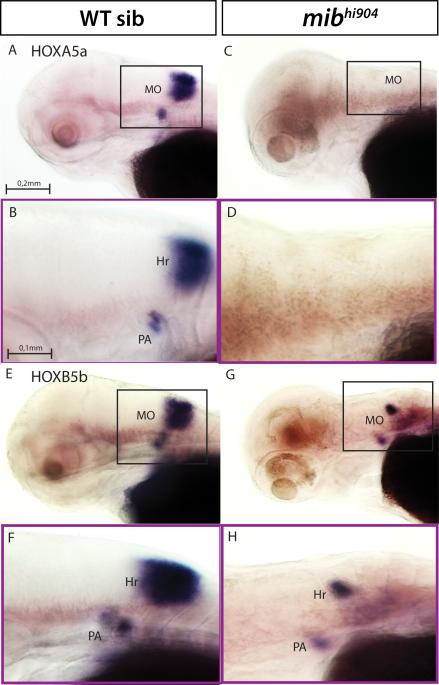
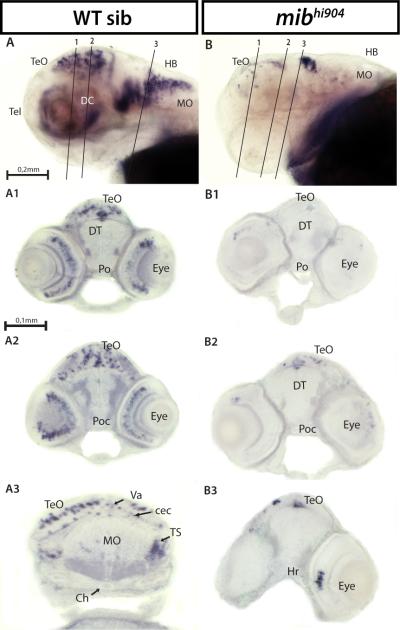
Hoxa5a, hoxb5b and dmbx1a, homeobox genes with roles in embryonic hindbrain patterning and brain development (Holland and Takahashi, 2005), exhibit a nearly 2-fold down-regulation in mibhi904 mutants compared to controls. WISH revealed remarkable WT expression patterns at rhombomere boundaries and lower expression in pharyngeal arches 6 and 7 for hoxa5a and hoxb5b genes (Figs. 5A, 5B, 5E, 5F), in agreement with previous studies (McGinnis and Krumlauf, 1992; Krumlauf, 1994, Davis and Stellwag, 2010). However, in mibhi904 mutants there is no detectable hoxa5a expression in hindbrain (Figs. 5C-D) and only small collections of hoxb5b at rhombomere boundaries and in pharyngeal arches (Figs. 5G-H). In WT, dmbx1a was expressed robustly throughout midbrain and hindbrain (Fig. 6A). Transverse sections revealed prominent clusters of dmbx1a expression in optic tectum and retina (Figs. 6A1-A2). In midbrain, dmbx1a clusters were noted at the level of the cerebellum, in the cerebellar commissure and torus semicircularis (Fig. 6A3) and posteriorly reaching the medulla oblongata (Fig. 6A). In contrast, dmbx1a expression is barely detectable in mibhi904 mutants (Fig. 6B); only few dmbx1a-expressing cell clusters are visible in optic tectum, retina (Figs. 6B1-B3) and the midbrain-hindbrain boundary (Fig. 6B).
Fig. 5.
hoxa5a and hoxb5b mRNA expression. Upper panels (A, C, E, G) - whole mounts are shown in lateral views. Lower panels (B, D, F, H) - higher magnification and same orientation of area framed in A, C, E, G. Abbreviations (as above): Hr, hindbrain rhombomeres; PA, pharyngeal arch. Scale bars: 0.2 mm (A, C, E, G), 0.1 mm (B, D, F, H).
Fig. 6.
dmbx1a mRNA expression. Whole mounts are shown in lateral views (A, B). A1-A3: WISH transversal cryostat sections of a stage 72 hpf WT. B1-B3: WISH transversal cryostat sections of a stage 72 hpf mibhi904. Abbreviations (as above): cec, cerebellar commissure; Ch, chorda dorsalis; Poc, postoptic commissure; Va, valvula cerebelli. Scale bars: 0.2 mm (A, B), 0.1 mm (A1–A4, B1-B3).
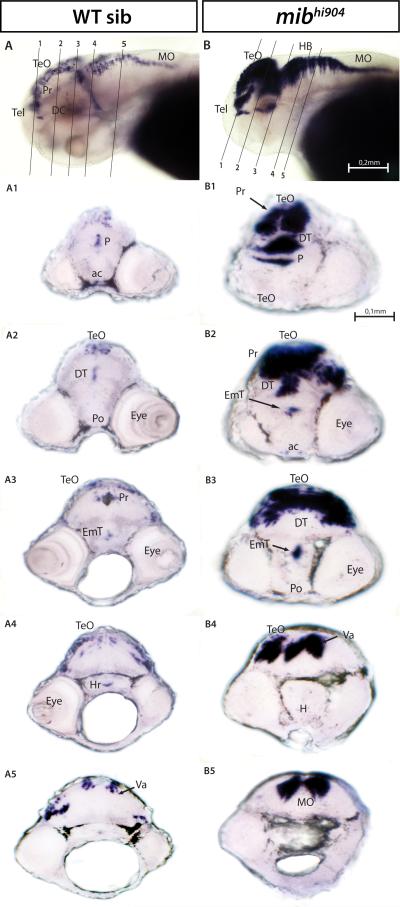
Another related homeobox gene (Fjose et al., 1994), dbx1a, exhibited 2-fold up-regulation in microarray and almost 2-fold up-regulation in qPCR in mibhi904 mutants. In WT, WISH revealed dbx1a expression in forebrain, continuing through midbrain and ending at the hindbrain-medulla oblongata boundary (Fig. 7A). Transverse sections show discrete domains of dbx1a in the pallium (Fig. 7A1) and similar clusters of expression in dorsal thalamus (Fig. 7A2), optic tectum and pretectum (Fig. 7A2-A3). Caudal to the pallium, dbx1a expression appears in the eminentia thalami (Fig. 7A3); a small number of dbx1a-expressing cells can be seen in rostral hypothalamus (Fig. 7A4) and cerebellum (Fig. 7A5). WISH in mibhi904 mutant revealed a greater degree of dbx1a expression following the same distribution profile seen in WT siblings (Fig. 7B). In transverse sections, a dense strip of pallial dbx1a expression was observed in diencephalon and a very prominent expression pattern was noted in optic tectum, pretectum and dorsal thalamus (Fig. 7B1) extending posteriorly (Figs. 7B2-B3). In diencephalon, some dbx1a-expressing cells were observed in the eminentia thalami (Fig. 7B3). More caudally, dbx1a expression extends dorsally reaching cerebellum and posteriorly into the medulla oblongata (Figs. 7B4-B5). There is no detectable dbx1a expression in hypothalamus of mibhi904 mutants.
Fig. 7.
dbx1a mRNA expression. Whole mounts are shown in lateral views (A, B). A1-A5: WISH transversal cryostat sections of a stage 72 hpf WT. B1-B5: WISH transversal cryostat sections of a stage 72 hpf mibhi904. Abbreviations as above; scale bars: 0.2 mm (A,B) and 0.1 mm (A1–A5, B1-B5).
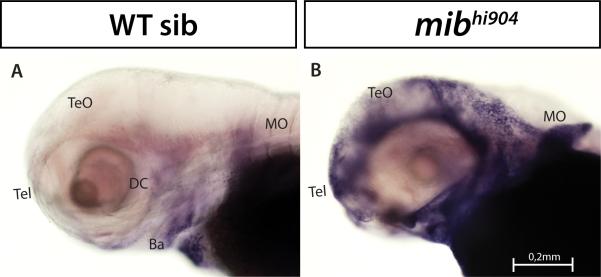
Plexin D1, a receptor for the semaphorin family of ligands with a crucial role in regulating axonal pathfinding, neuronal patterning (Tamagnone and Comoglio, 2000) and patterning of developing blood vessels (Torres-Vazquez et al., 2004), exhibited a 3-fold up-regulation in microarray and nearly 2-fold in qPCR. WISH shows faint plxnd1 expressed only at the level of the branchial arches in WT siblings (Fig. 8A). In sharp contrast, mibhi904 mutants show an aberrant increase in plxnd1 expression concentrated to the forebrain, optic tectum and branchial arches (Fig. 8B). In contrast, neurexophilin 1 (nxph1), a family of neuropeptide-like secreted glycoproteins (Petrenko et al., 1996), appeared to have the opposite pattern of expression to Plexin D1 in mibhi904 mutants. WISH revealed clusters of nxph1 expression in forebrain, midbrain and hindbrain in WT (Fig. 9A). In transverse sections, much of this nxph1 expression is restricted to the pallium region (telencephalon) and some glomerular structures within the habenula and dorsal thalamus (Fig. 9A1). Caudal to pallium, nxph1 expression appears in eminentia thalami (Fig. 9A2), ventral thalamus, through the posterior tuberculum (Fig. 9A2) and rostral hypothalamus (Fig. 9A3). Nxph1 expression appears heterogeneous in optic tectum and smaller scattered clusters were noted in medulla oblongata (Fig. 9A); nxph1 is barely detected around the branchial arches and medulla oblongata in mibhi904 mutants at 3 dpf (Fig. 9B, 9B1-9B3).
Fig. 8.
plxnd1 mRNA. Whole mounts are shown in lateral views (A, B). Abbreviations as above; scale bars: 0.2 mm (A, B).
Fig. 9.
nxph1 mRNA. Whole mounts are shown in lateral views (A, B). A1-A3: WISH transversal cryostat sections of a stage 72 hpf WT. B1-B3: WISH transversal cryostat sections of a stage 72 hpf mibhi904. Abbreviations (as above): PTd, dorsal part of posterior tuberculum; PTv, ventral part of posterior tuberculum. Scale bars: 0.2 mm (A, B), 0.1 mm (A1-A3, B1-B3).
GFP expression in live zebrafish
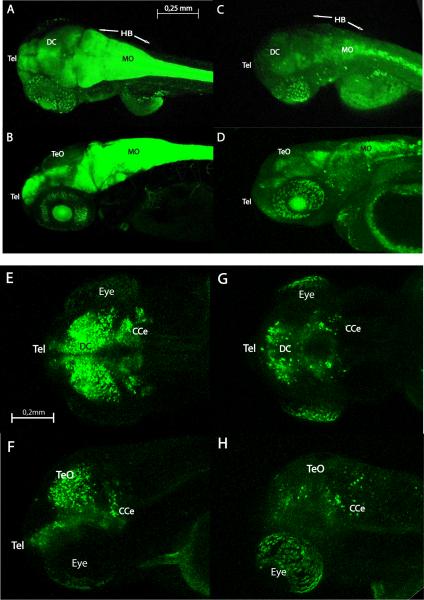
Glial fibrillary acidic protein (Gfap) is a member of the intermediate filament family of proteins found in astroglial cells and early neuronal progenitors. Consistent with previous studies (Hegde et al., 2008b), Gfap expression appeared to be 6-fold down-regulated in microarray and almost 4-fold in qPCR in mibhi904 mutants. To further assess in vivo expression using confocal microscopy, a transgenic line of zebrafish expressing a green fluorescent protein driven by Gfap specific regulatory elements (Gfap:GFP tg) was crossed into the mibhi904 background. In confocal images from anesthetized and immobilized WT siblings, Gfap drove expression (shown as green fluorescence) in telencephalon, retina and midbrain and was prominent in hindbrain and spinal cord (Figs. 10A-B). A distinctly different and more diffuse expression pattern was observed in mibhi904 mutants, where reduced Gfap-GFP fluorescence was observed in optic tectum and retina. Although more GFP fluorescence was spread posteriorly in hindbrain and medulla oblongata (compared to optic tectum), overall GFP fluorescence in mibhi904 mutants was diffuse and notably less than in WT controls (Figs. 10C-D).
Fig. 10.
Confocal live whole-mount images of Gfap:GFP (upper panel) and Dlx5-6:GFP transgenic zebrafish brain (lower panel) in wild-type (left side) and mibhi904 mutant (right side) at 3 dpf: dorsal views (A, C, E, G) and lateral views (B, D, F, H). The transgenic line for the GFAP drove expression (shown as green fluorescence) initially in the telencephalon and then in the eye and midbrain. Gfap:GFP is also highly prominent in hindbrain in WT siblings with a weak expression pattern in mibhi904 mutants. Dlx5-6:GFP in mibhi904 mutants is reduced with only few cells showing expression in diencephalon, eyes and in the cerebellar region. Images of live zebrafish were obtained using a Leica SP5 confocal scanning fluorescence microscope. Abbreviations as above; scale bars, 0.25 mm (A, B, C, D) and 0.2mm (E, F, G, H).
The eight distal-less (Dlx) genes present in zebrafish (Ekker, Akimenko et al. 1992; Akimenko, Ekker et al. 1994) encode a family of transcription factors involved in the formation of the forebrain, branchial arches, pharyngeal dentition, sensory organs, and limbs (Zerucha et al., 2000; Park et al., 2004; Borday-Birraux et al., 2006; Burton, 2008; MacDonald et al., 2010a). Anesthetized and immobilized, 3 dpf WT larvae show GFP expression in the telencephalon, diencephalon and optic tectum, but also in some groups of cells in the cerebellar region (Figs. 10E-F) consistent with previous reports in transgenic zebrafish at 5 dpf (Mione et al., 2008). Only few cells in diencephalon and cerebellum (Figs. 10G-H) express Dlx5a-6a in mibhi904 mutants.
DISCUSSION
Zebrafish mind bomb mutants are characterized by a severe neurogenic phenotype with defects somite, neural crest, and vasculature development. These defects have been interpreted as a consequence of abnormal Notch signaling (Jiang et al., 1996a; Lawson et al., 2001; Schier et al., 1996; van Eeden et al., 1996a; Haddon et al., 1998a; Riley et al., 1999). For example, early in development, Notch target genes such as basic Helix–Loop–Helix (bhlh) or Hairy/Enhancer of Split (hes) are up-regulated in critical areas of the central nervous system (Bray and Furriols, 2001) and these, in turn, suppress transcription of proneural genes such as neurogenin which prevents neighboring cells from adopting a neuronal fate in a process called “lateral inhibition” (Camposortega, 1995). Disruption of E3 ubiquitin ligase activity in mind bomb mutants leads to a failure in Notch signaling, resulting in a down-regulation of bhlh and hes genes, an excess of early differentiating neurons, a deficit of late differentiating neurons, impaired lateral inhibition (Schier et al., 1996; Jiang et al., 1996a; Itoh et al., 2003; Park and Appel, 2003; Yeo and Chitnis, 2007) and a striking disorganization of all regions of the CNS (Golling et al., 2002a). Decreased Notch activity is also suggested by reports of reduced expression of the transcriptional repressor her4 gene and increased expression of neurogenin-1 (Chen and Corliss, 2004b; Hegde et al., 2008b; Hwang et al., 2009b). Here down-regulation in her4 and two additional Notch pathway genes (hes5 and bhlhb5) were confirmed in telencephalon, metencephalon and optic tectum of mibhi904 mutants at 3 dpf. Hairy-related and hairy/enhancer of split genes were previously shown to be down-regulated in microarray studies on mibta52b mutants (Hwang et al., 2009), but these studies did not examine spatial expression patterns in the CNS. That these Notch signaling genes show decreased expression along the midline, a proliferative zone in the larval zebrafish brain (Mueller and Wullimann, 2005), further suggests a critical role for E3 ubiquitin ligase in mediating neuronal differentiation.
Expression of a proneural bHLH gene (bhlhb5) required for forebrain organization and co-expressed in regions along the midline where Dlx genes (i.e., transcription factors required for the tangential migration of GABAergic interneurons during brain development; Anderson et al., 1997) have been reported (Mueller and Wullimann, 2005) was nearly below detectable levels in mibhi904 mutants. Not surprisingly, loss of neurodevelopmental gene expression in this region of the developing brain ultimately leads to a disruption of forebrain cytoarchitecture and marked reductions in both GABAergic interneuron markers (Hortopan et al., 2009) and Dlx5/6-expressing interneurons (Fig. 10). At a functional level, neuronal disorganization and reduced interneuron density are likely contributors to the observed epileptic phenotype in mibhi904 mutants. Interestingly, expression of multiple members of the bhlh family of transcription factors (Lee, 1997; Bramblet et al., 2002; McLellan et al., 2002; Xu et al., 2002) are also differentially regulated following chemically induced status epilepticus in rats (Elliott et al., 2001). Given that bhlh genes show similar expression changes in an epileptic mibhi904 mutant and in zebrafish CNS structures shown to generate abnormal electrical activity e.g., optic tectum and telencephalon (Hortopan et al. 2010), suggests they might be functionally related to epileptogenesis.
Dramatically reduced mibhi904 mutant expression of homeobox (hoxa5a and hoxb5b) genes was also noted. Hox genes act as super-regulators of development and are often simultaneously expressed in tissue where they activate or repress transcription of multiple downstream target genes involved in morphogenesis, segmental specification and neurodevelopment (Gilbert, 2000; Kawahara et al., 2002). Both hoxa5a and hoxb5b show almost negligible expression in forebrain structures sub-serving higher brain functions such as the telencephalon and optic tectum; dmbx1a expression was robust throughout midbrain and hindbrain of control fish but nearly absent from mibhi904 mutants. In contrast, one up-regulated homeobox gene (dbx1a) was heavily over-expressed in the ventral forebrain and hindbrain. Recent studies in dbx1 mutant mice indicate that homeodomain transcription factors act upstream of Notch signaling, and it is believed that homeodomain proteins control spatial distribution of Notch ligands and proteins (Marklund et al., 2010). Using software that predicts interaction partners for one protein within a specific species and dbx1 as an example, we also noted a strong association between hes5, dmbx1a and dbx1a. COGs (Clusters of Orthologous Groups of proteins) are very powerful and can help identify direct (physical) and indirect (functional) associations between genes. These in silica analyses support our qPCR findings, where we found a high Pearson correlation between the corresponding genes (Supplemental Table 1). To better illustrate these correlations and interactions, 3D graphs were created using relative expression values from qPCR. One example is shown in Supplemental Fig. 1, where dbx1a expression, shown to be up-regulated in the microarray assay in mibhi904 mutants (B), is plotted with two other down-regulated genes, her4.2 and nxph1. The pattern observed in WT zebrafish (A) is opposite; these last two genes, her4.2 and nxph1, increase their expression while the dbx1a drops down (inversely correlated). A different pattern of response was observed when the same gene, dbx1a, was plotted with other two genes, plxnd1 and hes5, in WT (C) and in mibhi904 mutants (D). This would be the first step for the definition of a model to predict co-variation gene expression patterns and for the use of some of these genes (molecular markers) as a potential diagnostic tool.
Notch signaling is also involved in vascular development (Jakobsson et al., 2009; Roca and Adams, 2007) and vascular defects in the trunk of three different Notch zebrafish mutants were recently described (Therapontos and Vargesson, 2010). Although these studies focused on trunk vascularization, expression of plxnd1 in the head of these mutants was also reported and is similar to the pattern of expression we observed in mibhi904 mutants. Interestingly, nxph1, expressed in discrete clusters in the habenula, pallium, and ventral thalamus of control fish (but nearly absent in the forebrain and midbrain of mibhi904 mutants) functions as an endogenous ligand for α-neurexins (Missler and Sudhof, 1998d). Neurexins, together with neuroligins, are thought to play an essential role in synaptic transmission, particularly at GABAergic synapses (Craig and Kang, 2007). This is consistent with our recent demonstration (Hortopan et al. 2010) that GABA signaling may be reduced in mind bomb mutants presumably contributing to defective inhibitory synaptic transmission and epilepsy. Finally, neurexin-ligand interactions are also important for development and/or maturation of synaptic connections (Clarris et al., 2002) and implicated in the pathophysiology of neurodevelopmental disorders e.g., neurexin-1 was recently associated with autism (Ching et al., 2010a) a co-morbidity noted in children with Angelman syndrome.
When mibhi904 mutants were crossed with transgenic reporter lines (Gfap:GFP or Dlx5/6:GFP) a strong general down-regulation in fluorescence was noted. For glial fibrillary acidic protein, this is consistent with microarray and qPCR data (Hortopan et al. 2010) and previous independent analysis of the spinal cord (Song et al., 2010b). Mutations in human gfap have been described in association with a severe childhood brain disorder i.e., Alexander disorder (Brenner et al., 2001; Quinlan et al., 2007) characterized by enlarged brain and head size, seizures, stiffness in the arms/legs, intellectual disability, and developmental delay. Dlx5a-6a:GFP transgenic zebrafish provide a means to further study GABAergic interneurons (Mione et al., 2008; MacDonald et al., 2010b). Confocal images of mibhi904 zebrafish mutants crossed into this reporter line show a clear decrease of cells in forebrain and midbrain, suggestive of a failure in the differentiation or migration of early born interneurons. Although deficits in cell density could be a contributing factor to gene expression patterns seen throughout this manuscript, general brain morphology as indicated by these in vivo GFP imaging studies suggests that major CNS structures are largely intact in mibhi904 mutants.
In conclusion, altered expression levels and patterns in mibhi904 mutants of genes critical to early stages of neurodevelopment support the view that an ubiquitin E3 ligase is involved in Notch signaling. In contrast to earlier studies of mind bomb zebrafish mutants focused on development of the pituitary gland (Dutta et al., 2008), hindbrain (Bingham et al., 2003), spinal cord (Itoh et al., 2003) or mesoderm (Hwang et al., 2009), our studies focused on gene expression patterns in critical regions of the zebrafish telencephalon and metencephalon. Failure or reduction in ligase activity in these regions can, as shown here, lead to down-regulation of several Notch signaling genes that are required for normal neuronal development. Loss of this signaling led to dramatic alterations in how the brain develops with potentially catastrophic consequences for inhibitory synapse formation, cognitive function, and survival (mib mutants do not survive past 4 dpf). Although this study only represents a relatively small subset of neurodevelopmental genes that may be disturbed, it is possible that mibhi904 mutants could help to characterize mechanisms that underlie symptoms of disorders that require proper development of synaptic circuits.
EXPERIMENTAL PROCEDURES
Animals and maintenance
Heterozygote zebrafish (mind bomb, line #hi904) were obtained from the Zebrafish International Resource Center (Eugene, OR; http://zebrafish.org/zirc/fish/lineAll.php). The following transgenic lines were also used in this study: Gfap:GFP (Tg(gfap:GFP)mi2001/+; Chen et al. 2010) and Dlx5a-6a:GFP (Zerucha et al., 2000). Adult zebrafish were maintained according to standard procedures (Westerfield, 1993), and following guidelines approved by the University of California, San Francisco Institutional Animal Care and Use Committee. Zebrafish embryos and larvae were maintained in egg water (0.03% Instant Ocean).
RNA isolation
At 3 dpf, larvae were sorted by morphology and used for RNA isolation. Total RNA was isolated from 14 pools of larvae (4 fish/pool): mib mutants (n = 7) and age-matched WT sibling controls (n = 7). Fish were treated with Trizol® Reagent (Invitrogen, Carlsbad, CA), RNase-free DNase to remove possible genomic DNA contamination, and quantified with GeneQuant® spectrophotometer.
PCR, cloning and sequencing
cDNA was generated using a mix of random primers and oligo(dT)20 in a reverse transcription kit (SuperScript™III First-Strand Synthesis System, Invitrogen) according to the manufacturer's protocol. Primers pairs, forward and reverse, were specifically designed using Primer 3 web software (http://frodo.wi.mit.edu/primer3/) for each investigated gene (Supplemental Table 2). The most conserved regions were identified by sequence alignment (ClustalW, Thompson et al., 1994) of all available gene sequences from GeneBank including other fish species. We used BLAST software to investigate primer cross-specificity and Mfold software (Zuker, 2003) to check for secondary structure of the entire DNA sequence. Each reaction cycle (32 loops) consisted of incubations at 94°C (30 sec), 60°C (30 sec), and 72°C (60 sec) with Taq DNA Polymerase (Taq PCR Core kit, Qiagen). A 2% agarose gel electrophoresis stained with ethidium bromide was used to separate PCR products which were further cloned in pCR®II-TOPO® plasmid vector (TOPO TA Cloning System, Invitrogen) according to the manufacturer's specifications. DNA sequencing was performed by Elim Biopharmaceuticals, Inc. (Hayward, CA).
Quantitative real-time PCR (qPCR)
Gene expression levels were determined by real-time qPCR using SybrGreen® fluorescent master mix on an ABI Prism® 7700 Sequence Detection System driven by ABI prism SDS v9.1 software (Applied Biosystems). The cDNA templates were diluted 1:2 with DEPC (diethyl pyrocarbonate) sterile water before qPCR applications to minimize the presence of potential inhibitors. Primer Express v3.0 software (Applied Biosystems) was used to design all primers on our own sequenced cDNA to produce amplicons ranging in size between 71bp to 125bp (Supplemental Table 3) and then synthesized by Invitrogen. Samples were run in triplicate in 10 μL of 1× SYBR green master mix containing 100 nM of each primer and RNAse free water. Samples without reverse transcriptase and samples without RNAs were run for each reaction as negative controls. Cycling parameters were as follows: 50°C × 2min, 95°C × 10min, then 45 cycles of the following 95°C × 15s, 60°C × 1min. For each sample a dissociation step was performed at 95°C × 15s, 60°C × 20s and 95°C × 15 s. Dissociation (melting) curve analysis showed no sign of primer-dimers or other non-specific reaction products.
For qPCR data, significant differences were considered at P value ≤ 0.05 (Student's t test). Relative quantification of the target gene transcript with β-actin reference gene transcript (Hortopan et al., 2010) was made following both the Comparative ΔΔCT (Livak and Schmittgen, 2001) and the Efficiency Based (Pfaffl, 2001) methods using qCalculator software (programmed by Ralf Gilsbach, Institute of Pharmacology and Toxicology, University of Bonn, Germany), which also estimates qPCR efficiency E= 10(– 1/slope). Similar results were obtained with both types of analyses. Standard curves for all nine genes, to estimate qPCR efficiencies, were constructed using a 4-fold serial dilution of pooled cDNA; 5 standards assayed in triplicate: 1/1; 1/4; 1/16; 1/64; 1/256 (the efficiencies, slope of the curves and the correlation coefficient are summarized in Supplemental Table 3).
Whole-mount in situ hybridization (WISH)
Antisense and sense RNA probes were generated from plasmids corresponding to each of the 9 selected genes using specific restriction enzymes for linearization (New England Biolabs, UK). Linearized DNA template (1 μg) was purified (QIAquick®, Qiagen) and incubated for 3 hour at 37°C in a solution containing 10X transcription buffer, dithiothreitol (DTT; 100mM), 10X Dig NTP Mix (Roche), RNAse inhibitor (20U/μl), and RNA polymerase (20U/μl) T7 or SP6. After digestion of the DNA template with DNase (10U/μl) for 15 minutes at 37°C and incubation, the product was purified using a mix of RNAse-free water and LiCl (30 μl, 1:2) and left overnight at -20°C. After centrifugation at 4°C and washing with 70% ethanol (RNAse free), the pellet was dried and stored in hybridization mix solution at -20°C until use.
3dpf embryos, mib mutants (n = 8) and WT controls (n = 8) for each antisense and sense RNA probes, were sorted and fixed in 4% paraformaldehyde (PFA) then stored in 100% methanol at -20°C. Following storage at -20°C, fixed larvae were rehydrated in a series of methanol and PBS-0.1%Tween20 (PBST) washes. Whole-mount in situ hybridization was performed as previously described (Hauptmann and Gerster, 1994). Larvae were fixed in 4% PFA, washed in PBST and processed for cryo-sectioning using quick-frozen samples mounted in O.C.T. compound (Tissue TEK®; slice thickness: 15-20 μm).
Transgenic zebrafish
Transgenic Gfap:GFP zebrafish (Tg(gfap:GFP)mi2001/+) founder lines were obtained from the Zebrafish International Research Center (http://zebrafish.org/zirc/home/guide.php). Adult GFP founder lines on an AB background were crossed with heterozygote mind bomb (mibhi904Tg/+) founders on an AB background. F1 fish were sorted by fluorescence as embryos, raised to adulthood and crossed to obtain mib:Gfap:GFP larvae. 30 fish larvae were sorted at 3 dpf, (mib; n = 15 and WT; n = 15) and anesthetized in a cocktail containing 0.02% Tricaine and α-bungarotoxin (1 mg/ml) or curare (4.5 mM), then immersed in 1.2% low melting point agarose to immobilize and orientate the embryos for imaging. Visual assessment of GFP expression was performed using a Leica SP5 confocal scanning fluorescence microscope. Confocal images were reconstructed using z-stack projections produced from serial scanning every 4 μm.
Microscopy and imaging
Tissue sections of larval zebrafish were chosen to be representative of gene expression and matched, as well as possible, with respect to location and cutting angle. WISH figures are annotated to show the approximate location and cutting angle for each section. Pictures of whole-mount in situ hybridization embryos mounted in 70% glycerol and slide-mounted cryosections were taken using a Zeiss Axioskop microscope equipped with a computer-controlled Optronics MicroFire camera system. Raw images were imported into Adobe Photoshop and slightly adjusted for contrast and sharpness.
Terminology
Neuroanatomical designations were taken from Mueller and Wullimann (2005) in consultation with Thomas Mueller.
Supplementary Material
Supplemental Information
Supplemental Fig.1. dbx1a, her4.2, nxph1, hes5 and plxnd1 relative expression values (Efficiency based method; Pfaffl, 2001) were plotted in a 3D graph for both groups (WT sib and mib mutants). Note a co-variation pattern of expression of these genes; in this example, when dbx1a was plotted against her4.2 and nxph1 its expression decreased (represented by green color) simultaneously with the increase of her4.2 and nxph1 expression (red color) in the 3 dpf WT siblings (A). In mib mutants, we observe an opposite pattern, dbx1a expression increases (red) with down-regulation of her4.2 and nxph1 (green) (B). A similar pattern is shown when dbx1a was plotted against hes5 and plxnd1 in WT sib (C) and mib mutants (D); dbx1a is inversely correlated with Hes5. Abbreviations: dbx1a, developing brain homeobox 1a; her4.2, hairy-related 4.2; hes5, hairy and enhancer of split 5; nxph1, neurexophilin 1 and plxnd1, plexin D1.
Supplemental Table 1. Pearson correlation coefficients are summarized in this table. The highest correlation coefficients >0.70 or < -0.70 significant at the 0.01 level are indicated by two asterisks and the correlation coefficients < 0.7 or >-0.7 significant at the 0.05 level are indicated by one asterisk.
Supplemental Table 2. Primer's sequences, GeneBank accession number and amplicon size for the investigated genes in conventional RT-PCR; primers indicated by asterisks were also used in preparing the probes for In Situ Hybridization DNA (template preparation using PCR amplification).
Supplemental Table 3. Real-time qPCR primer sequences and amplicon sizes for the SybrGreen assays.
Supplemental Table 4. qPCR efficiencies for all the gene of interest, slope of the curves, intercept and the correlation coefficient were estimated using the equation E=10[-1/slope] (qCalculator software). Cycle threshold (CT) values were obtained by the standards serial dilutions assayed in triplicate (4-fold serial dilution).
Acknowledgements
We would like to thank Matthew Dinday and Thomas Mueller for their valuable contributions to this manuscript. This work was supported by funds from the National Institutes of Health (R01 NS053479-03) to S.C.B.
Grant sponsor: NIH; Grant number: NS053479-03
REFERENCES
- Akimenko MA, Ekker M, Wegner J, Lin W, Westerfield M. Combinatorial expression of 3 zebrafish genes related to distal-less - part of a homeobox gene code for the head. J Neurosci. 1994;14:3475–3486. doi: 10.1523/JNEUROSCI.14-06-03475.1994. [DOI] [PMC free article] [PubMed] [Google Scholar]
- Anderson SA, Eisenstat DD, Shi L, Rubenstein JL. Interneuron migration from basal forebrain to neocortex: dependence on Dlx genes. Science. 1997;278:474–476. doi: 10.1126/science.278.5337.474. [DOI] [PubMed] [Google Scholar]
- Bae YK, Shimizu T, Hibi M. Patterning of proneuronal and inter-proneuronal domains by hairy- and enhancer of split-related genes in zebraf ish neuroectoderm. Development. 2005;132:1375–1385. doi: 10.1242/dev.01710. [DOI] [PubMed] [Google Scholar]
- Bailey AM, Posakony JW. Suppressor of hairless directly activates transcription of enhancer of split complex genes in response to notch receptor activity. Gene Dev. 1995;9:2609–2622. doi: 10.1101/gad.9.21.2609. [DOI] [PubMed] [Google Scholar]
- Biehlmaier O, Neuhauss SCF, Kohler K. Onset and time course of apoptosis in the developing retina of zebrafish. Invest Ophth Vis Sci. 2001;42:3407. doi: 10.1007/s004410100447. [DOI] [PubMed] [Google Scholar]
- Bingham S, Chaudhari S, Vanderlaan G, Itoh M, Chitnis A, Chandrasekhar A. Neurogenic phenotype of mind bomb mutant leads to severe patterning defects in the zebrafish hindbrain. Dev Dynam. 2003;228:451–463. doi: 10.1002/dvdy.10429. [DOI] [PMC free article] [PubMed] [Google Scholar]
- Borday-Birraux V, Van der Heyden C, Debiais-Thibaud M, Verreijdt L, Stock DW, Huysseune A, Sire JY. Expression of Dlx genes during the development of the zebrafish pharyngeal dentition: evolutionary implications. Evol Dev. 2006;8:130–141. doi: 10.1111/j.1525-142X.2006.00084.x. [DOI] [PubMed] [Google Scholar]
- Bramblett DE, Copeland NG, Jenkins NA, Tsai MJ. BHLHB4 is a bHLH transcriptional regulator in pancreas and brain that marks the dimesencephalic boundary. Genomics. 2002;79:402–412. doi: 10.1006/geno.2002.6708. [DOI] [PubMed] [Google Scholar]
- Bray S, Furriols M. Notch pathway: Making sense of suppressor of hairless. Curr Biol. 2001;11:R217–R221. doi: 10.1016/s0960-9822(01)00109-9. [DOI] [PubMed] [Google Scholar]
- Brenner M, Johnson AB, Boespflug-Tanguy O, Rodriguez D, Goldman JE, Messing A. Mutations in GFAP, encoding glial fibrillary acidic protein, are associated with Alexander disease. Nat Genet. 2001;27:117–120. doi: 10.1038/83679. [DOI] [PubMed] [Google Scholar]
- Brunelli S, Innocenzi A, Cossu G. Bhlhb5 is expressed in the CNS and sensory organs during mouse embryonic development. Gene Expr Patterns. 2003;3:755–759. doi: 10.1016/s1567-133x(03)00135-2. [DOI] [PubMed] [Google Scholar]
- Burton L. M.Sc. thesis, University of Ottawa MR48591. 2008. Dlx regulation in zebrafish brain development via I56i/I56ii and I12a/I12b. [Google Scholar]
- Camposortega JA. Genetic mechanisms of early neurogenesis in Drosophila-melanogaster. Mol Neurobiol. 1995;10:75–89. doi: 10.1007/BF02740668. [DOI] [PubMed] [Google Scholar]
- Chen HL, Yuh CH, Wu KK. Nestin Is Essential for Zebrafish Brain and Eye Development through Control of Progenitor Cell Apoptosis. Plos One. 2010:5. doi: 10.1371/journal.pone.0009318. [DOI] [PMC free article] [PubMed] [Google Scholar]
- Chen WB, Corliss DC. Three modules of zebrafish Mind bomb work cooperatively to promote Delta ubiquitination and endocytosis. Dev Biol. 2004b;267:361–373. doi: 10.1016/j.ydbio.2003.11.010. [DOI] [PubMed] [Google Scholar]
- Ching MSL, Shen YP, Tan WH, Jeste SS, Morrow EM, Chen XL, Mukaddes NM, Yoo SY, Hanson E, Hundley R, Austin C, Becker RE, Berry GT, Driscoll K, Engle EC, Friedman S, Gusella JF, Hisama FM, Irons MB, Lafiosca T, LeClair E, Miller DT, Neessen M, Picker JD, Rappaport L, Rooney CM, Sarco DP, Stoler JM, Walsh CA, Wolff RR, Zhang T, Nasir RH, Wu BL, Childrens Hosp Boston Genotype P Deletions of NRXN1 (Neurexin-1) Predispose to a Wide Spectrum of Developmental Disorders. Am J Med Genet B. 2010a;153B:937–947. doi: 10.1002/ajmg.b.31063. [DOI] [PMC free article] [PubMed] [Google Scholar]
- Clarris HJ, McKeown S, Key B. Expression of neurexin ligands, the neuroligins and the neurexophilins, in the developing and adult rodent olfactory bulb. Int J Dev Biol. 2002;46:649–652. [PubMed] [Google Scholar]
- Craig AM, Kang Y. Neurexin-neuroligin signaling in synapse development. Curr Opin Neurobiol. 2007;17:43–52. doi: 10.1016/j.conb.2007.01.011. [DOI] [PMC free article] [PubMed] [Google Scholar]
- Davis A, Stellwag EJ. Spatio-temporal patterns of Hox paralog group 3-6 gene expression during Japanese medaka (Oryzias latipes) embryonic development. Gene Expr Patterns. 2010;10:244–250. doi: 10.1016/j.gep.2010.05.003. [DOI] [PubMed] [Google Scholar]
- Dontu G, Jackson KW, McNicholas E, Kawamura MJ, Abdallah WM, Wicha MS. Role of Notch signaling in cell-fate determination of human mammary stem/progenitor cells. Breast Cancer Res. 2004;6:R605–R615. doi: 10.1186/bcr920. [DOI] [PMC free article] [PubMed] [Google Scholar]
- Dulin JP, Locker M, Robach M, Henningfeld KA, Parain K, Afelik S, Pieler T, Perron M. Ptf1a triggers GABAergic neuronal cell fates in the retina. BMC Dev Biol. 2007;7:110. doi: 10.1186/1471-213X-7-110. [DOI] [PMC free article] [PubMed] [Google Scholar]
- Dutta S, Dietrich J- E, Westerfield M, Varga ZM. Notch signaling regulates endocrine cell specification in the zebrafish anterior pituitary. Dev Biol. 2008;319:248–257. doi: 10.1016/j.ydbio.2008.04.019. [DOI] [PMC free article] [PubMed] [Google Scholar]
- Ekker M, Akimenko MA, Bremiller R, Westerfield M. Regional expression of 3 homeobox transcripts in the inner-ear of zebrafish embryos. Neuron. 1992;9:27–35. doi: 10.1016/0896-6273(92)90217-2. [DOI] [PubMed] [Google Scholar]
- Elliott RC, Khademi S, Pleasure SJ, Parent JM, Lowenstein DH. Differential regulation of basic helix-loop-helix mRNAs in the dentate gyrus following status epilepticus. Neuroscience. 2001;106:79–88. doi: 10.1016/s0306-4522(01)00198-1. [DOI] [PubMed] [Google Scholar]
- Fjose A, Izpisuabelmonte JC, Fromentalramain C, Duboule D. Expression of the zebrafish gene hlx-1 in the prechordal plate and during cns development. Development. 1994;120:71–81. doi: 10.1242/dev.120.1.71. [DOI] [PubMed] [Google Scholar]
- Feng L, Xie X, Joshi PS, Yang Z, Shibasaki K, Chow RL, Gan L. Requirement for Bhlhb5 in the specification of amacrine and cone bipolar subtypes in mouse retina. Development. 2006;133:4815–25. doi: 10.1242/dev.02664. [DOI] [PMC free article] [PubMed] [Google Scholar]
- Gavrieli Y, Sherman Y, Bensasson SA. Identification of programmed cell-death insitu via specific labeling of nuclear-dna fragmentation. J Cell Biol. 1992;119:493–501. doi: 10.1083/jcb.119.3.493. Development 2006, 133:4815-25. [DOI] [PMC free article] [PubMed] [Google Scholar]
- Gilbert S F. Developmental biology, 6th edition. Sinauer Associates; Sunderland, Mass.: 2000. [Google Scholar]
- Golling G, Amsterdam A, Sun ZX, Antonelli M, Maldonado E, Chen WB, Burgess S, Haldi M, Artzt K, Farrington S, Lin SY, Nissen RM, Hopkins N. Insertional mutagenesis in zebrafish rapidly identifies genes essential for early vertebrate development. Nat Genet. 2002a;31:135–140. doi: 10.1038/ng896. [DOI] [PubMed] [Google Scholar]
- Haddon C, Jiang YJ, Smithers L, Lewis J. Delta-Notch signalling and the patterning of sensory cell differentiation in the zebrafish ear: evidence from the mind bomb mutant. Development. 1998a;125:4637–4644. doi: 10.1242/dev.125.23.4637. [DOI] [PubMed] [Google Scholar]
- Hauptmann G, Gerster T. Two-color whole-mount in-situ hybridization to vertebrate and drosophila embryos. Trends Genet. 1994;10:266–266. doi: 10.1016/0168-9525(90)90008-t. [DOI] [PubMed] [Google Scholar]
- Hegde A, Qiu NC, Qiu XH, Ho SHK, Tay KQY, George J, Ng FSL, Govindarajan KR, Gong ZY, Mathavan S, Jiang YJ. Genomewide Expression Analysis in Zebrafish mind bomb Alleles with Pancreas Defects of Different Severity Identifies Putative Notch Responsive Genes. Plos One. 2008b:3. doi: 10.1371/journal.pone.0001479. [DOI] [PMC free article] [PubMed] [Google Scholar]
- Hirata H, Yoshiura S, Ohtsuka T, Bessho Y, Harada T, Yoshikawa K, Kageyama R. Oscillatory expression of the bHLH factor Hes1 regulated by a negative feedback loop. Science. 2002a;298:840–843. doi: 10.1126/science.1074560. [DOI] [PubMed] [Google Scholar]
- Hjorth JT, Key B. Are pioneer axons guided by regulatory gene expression domains in the zebrafish forebrain? High-resolution analysis of the patterning of the zebrafish brain during axon tract formation. Dev Biol. 2001;229:271–286. doi: 10.1006/dbio.2000.9980. [DOI] [PubMed] [Google Scholar]
- Holland PWH, Takahashi T. The evolution of homeobox genes: Implications for the study of brain development. Brain Res Bull. 2005;66:484–490. doi: 10.1016/j.brainresbull.2005.06.003. [DOI] [PubMed] [Google Scholar]
- Holley SA, Julich D, Rauch GJ, Geisler R, Nusslein-Volhard C. her1 and the notch pathway function within the oscillator mechanism that regulates zebrafish somitogenesis. Development. 2002;129:1175–1183. doi: 10.1242/dev.129.5.1175. [DOI] [PubMed] [Google Scholar]
- Hortopan GA, Dinday MT, Baraban SC. Spontaneous Seizures and Altered Gene Expression in GABA Signaling Pathways in a mind bomb Mutant Zebrafish. J Neurosci. 2010;30:13718–13728. doi: 10.1523/JNEUROSCI.1887-10.2010. [DOI] [PMC free article] [PubMed] [Google Scholar]
- Hwang J, Kim HS, Seok JW, Kim JD, Koun S, Park SY, Lee J, Kim KS, Chang KT, Ryoo ZY, Wang SM, Huh TL, Lee S. Transcriptome analysis of the zebrafish mind bomb mutant. Mol Genet Genomics. 2009b;281:77–85. doi: 10.1007/s00438-008-0395-5. [DOI] [PubMed] [Google Scholar]
- Itoh M, Kim CH, Palardy G, Oda T, Jiang YJ, Maust D, Yeo SY, Lorick K, Wright GJ, Ariza-McNaughton L, Weissman AM, Lewis J, Chandrasekharappa SC, Chitnis AB. Mind bomb is a ubiquitin ligase that is essential for efficient activation of Notch signaling by delta. Dev Cell. 2003;4:67–82. doi: 10.1016/s1534-5807(02)00409-4. [DOI] [PubMed] [Google Scholar]
- Jakobsson L, Bentley K, Gerhardt H. VEGFRs and Notch: a dynamic collaboration in vascular patterning. Biochem Soc T. 2009;37:1233–1236. doi: 10.1042/BST0371233. [DOI] [PubMed] [Google Scholar]
- Jarriault S, Brou C, Logeat F, Schroeter EH, Kopan R, Israel A. Signaling downstream of activated mammalian notch. Nature. 1995;377:355–358. doi: 10.1038/377355a0. [DOI] [PubMed] [Google Scholar]
- Jiang YH, Armstrong D, Albrecht U, Atkins CM, Noebels JL, Eichele G, Sweatt JD, Beaudet AL. Mutation of the angelman ubiquitin ligase in mice causes increased cytoplasmic p53 and deficits of contextual learning and long-term potentiation. Neuron. 1998;21:799–811. doi: 10.1016/s0896-6273(00)80596-6. [DOI] [PubMed] [Google Scholar]
- Jiang YJ, Brand M, Heisenberg CP, Beuchle D, FurutaniSeiki M, Kelsh RN, Warga RM, Granato M, Haffter P, Hammerschmidt M, Kane DA, Mullins MC, Odenthal J, vanEeden FJM, NussleinVolhard C. Mutations affecting neurogenesis and brain morphology in the zebrafish, Danio rerio. Development. 1996a;123:205–216. doi: 10.1242/dev.123.1.205. [DOI] [PubMed] [Google Scholar]
- Julich D, Lim CH, Round J, Nicolaije C, Schroeder J, Davies A, Geisler R, Lewis J, Jiang YJ, Holley SA, Tubingen Screen C. beamter/deltaC and the role of Notch ligands in the zebrafish somite segmentation, hindbrain neurogenesis and hypochord differentiation. Dev Biol. 2005;286:391–404. doi: 10.1016/j.ydbio.2005.06.040. [DOI] [PubMed] [Google Scholar]
- Kawahara A, Chien CB, Dawid IB. The homeobox gene mbx is involved in eye and tectum development. Dev Biol. 2002;248:107–117. doi: 10.1006/dbio.2002.0709. [DOI] [PubMed] [Google Scholar]
- Kawamura A, Koshida S, Hijikata H, Sakaguchi T, Kondoh H, Takada S. Zebrafish hairy/enhancer of split protein links FGF signaling to cyclic gene expression in the periodic segmentation of somites. Gene Dev. 2005;19:1156–1161. doi: 10.1101/gad.1291205. [DOI] [PMC free article] [PubMed] [Google Scholar]
- Kishino T, Lalande M, Wagstaff J. UBE3A/E6-AP mutations cause Angelman syndrome (vol 15, pg 70, 1997) Nat Genet. 1997;15:411–411. doi: 10.1038/ng0197-70. [DOI] [PubMed] [Google Scholar]
- Krumlauf R. Hox genes in vertebrate development. Cell. 1994;78:191–201. doi: 10.1016/0092-8674(94)90290-9. [DOI] [PubMed] [Google Scholar]
- Lawson ND, Scheer N, Pham VN, Kim CH, Chitnis AB, Campos-Ortega JA, Weinstein BM. Notch signaling is required for arterial-venous differentiation during embryonic vascular development. Development. 2001;128:3675–3683. doi: 10.1242/dev.128.19.3675. [DOI] [PubMed] [Google Scholar]
- Lecourtois M, Schweisguth F. Indirect evidence for Delta-dependent intracellular processing of notch in Drosophila embryos. Curr Biol. 1998;8:771–774. doi: 10.1016/s0960-9822(98)70300-8. [DOI] [PubMed] [Google Scholar]
- Lee JE. Basic helix-loop-helix genes in neural development. Curr Opin Neurobiol. 1997;7:13–20. doi: 10.1016/s0959-4388(97)80115-8. [DOI] [PubMed] [Google Scholar]
- Lewis J, Hanisch A, Holder M. Notch signaling, the segmentation clock, and the patterning of vertebrate somites. J Biol (London) 2009:8. doi: 10.1186/jbiol145. [DOI] [PMC free article] [PubMed] [Google Scholar]
- Livak KJ, Schmittgen TD. Analysis of relative gene expression data using real-time quantitative PCR and the 2(T)(-Delta Delta C) method. Methods. 2001;25:402–408. doi: 10.1006/meth.2001.1262. [DOI] [PubMed] [Google Scholar]
- Lossie AC, Whitney MM, Amidon D, Dong HJ, Chen P, Theriaque D, Hutson A, Nicholls RD, Zori RT, Williams CA, Driscoll DJ. Distinct phenotypes distinguish the molecular classes of Angelman syndrome. J Med Genet. 2001;38:834–845. doi: 10.1136/jmg.38.12.834. [DOI] [PMC free article] [PubMed] [Google Scholar]
- Lu FM, Lux SE. Constitutively active human Notch1 binds to the transcription factor CBF1 and stimulates transcription through a promoter containing a CBF1-responsive element. P Natl Acad Sci Usa. 1996;93:5663–5667. doi: 10.1073/pnas.93.11.5663. [DOI] [PMC free article] [PubMed] [Google Scholar]
- MacDonald RB, Debiais-Thibaud M, Ekker M. Regulation of Dlx gene expression in the zebrafish pharyngeal arches: from conserved enhancer sequences to conserved activity. J Appl Ichthyol. 2010a;26:187–191. [Google Scholar]
- MacDonald RB, Debiais-Thibaud M, Talbot JC, Ekker M. The Relationship Between dlx and gad1 Expression Indicates Highly Conserved Genetic Pathways in the Zebrafish Forebrain. Dev Dynam. 2010b;239:2298–2306. doi: 10.1002/dvdy.22365. [DOI] [PMC free article] [PubMed] [Google Scholar]
- Marklund U, Hansson EM, Sundstrom E, de Angelis MH, Przemeck GKH, Lendahl U, Muhr J, Ericson J. Domain-specific control of neurogenesis achieved through patterned regulation of Notch ligand expression. Development. 2010;137:437–445. doi: 10.1242/dev.036806. [DOI] [PubMed] [Google Scholar]
- McGinnis W, Krumlauf R. Homeobox genes and axial patterning. Cell. 1992;68:283–302. doi: 10.1016/0092-8674(92)90471-n. [DOI] [PubMed] [Google Scholar]
- McLellan AS, Langlands K, Kealey T. Exhaustive identification of human class II basic helix-loop-helix proteins by virtual library screening. Gene Expr Patterns. 2002;2:329–335. doi: 10.1016/s0925-4773(02)00390-8. [DOI] [PubMed] [Google Scholar]
- Mione M, Baldessari D, Deflorian G, Nappo G, Santoriello C. How neuronal migration contributes to the morphogenesis of the CNS: Insights from the zebrafish. Dev Neurosci-Basel. 2008;30:65–81. doi: 10.1159/000109853. [DOI] [PubMed] [Google Scholar]
- Missler M, Sudhof TC. Neurexophilins form a conserved family of neuropeptide-like glycoproteins. J Neurosci. 1998d;18:3630–3638. doi: 10.1523/JNEUROSCI.18-10-03630.1998. [DOI] [PMC free article] [PubMed] [Google Scholar]
- Miura K, Kishino T, Li E, Webber H, Dikkes P, Holmes GL, Wagstaff J. Neurobehavioral and electroencephalographic abnormalities in Ube3a maternal-deficient mice. Neurobiol Dis. 2002;9:149–159. doi: 10.1006/nbdi.2001.0463. [DOI] [PubMed] [Google Scholar]
- Mueller T, Wullimann MF. Atlas of early zebrafish brain development: A tool for molecular neurogenetics, 1st ed. Elsevier; Amsterdam: 2005. p. xi.p. 183. [Google Scholar]
- Mumm JS, Kopan R. Notch signaling: From the outside in. Dev Biol. 2000;228:151–165. doi: 10.1006/dbio.2000.9960. [DOI] [PubMed] [Google Scholar]
- Oates AC, Ho RK. Hairy/E(spl)-related (Her) genes are central components of the segmentation oscillator and display redundancy with the Delta/Notch signaling pathway in the formation of anterior segmental boundaries in the zebrafish. Development. 2002b;129:2929–2946. doi: 10.1242/dev.129.12.2929. [DOI] [PubMed] [Google Scholar]
- Park BK, Sperber SM, Choudhury A, Ghanem N, Hatch GT, Sharpe PT, Thomas BL, Ekker M. Intergenic enhancers with distinct activities regulate Dlx gene expression in the mesenchyme of the branchial arches. Dev Biol. 2004;268:532–545. doi: 10.1016/j.ydbio.2004.01.010. [DOI] [PubMed] [Google Scholar]
- Park HC, Appel B. Delta-Notch signaling regulates oligodendrocyte specification. Development. 2003;130:3747–3755. doi: 10.1242/dev.00576. [DOI] [PubMed] [Google Scholar]
- Petrenko AG, Ullrich B, Missler M, Krasnoperov V, Rosahl TW, Sudhof TC. Structure and evolution of neurexophilin. Journal of Neuroscience. 1996;16:4360–4369. doi: 10.1523/JNEUROSCI.16-14-04360.1996. [DOI] [PMC free article] [PubMed] [Google Scholar]
- Pfaffl MW. A new mathematical model for relative quantification in real-time RT-PCR. Nucleic Acids Res. 2001:29. doi: 10.1093/nar/29.9.e45. [DOI] [PMC free article] [PubMed] [Google Scholar]
- Quinlan RA, Brenner M, Goldman JE, Messing A. GFAP and its role in Alexander disease. Exp Cell Res. 2007;313:2077–2087. doi: 10.1016/j.yexcr.2007.04.004. [DOI] [PMC free article] [PubMed] [Google Scholar]
- Riley BB, Chiang MY, Farmer L, Heck R. The deltaA gene of zebrafish mediates lateral inhibition of hair cells in the inner ear and is regulated by pax2.1. Development. 1999;126:5669–5678. doi: 10.1242/dev.126.24.5669. [DOI] [PubMed] [Google Scholar]
- Roca C, Adams RH. Regulation of vascular morphogenesis by Notch signaling. Gene Dev. 2007;21:2511–2524. doi: 10.1101/gad.1589207. [DOI] [PubMed] [Google Scholar]
- Schier AF, Neuhauss SCF, Harvey M, Malicki J, SolnicaKrezel L, Stainier DYR, Zwartkruis F, Abdelilah S, Stemple DL, Rangini Z, Yang H, Driever W. Mutations affecting the development of the embryonic zebrafish brain. Development. 1996;123:165–178. doi: 10.1242/dev.123.1.165. [DOI] [PubMed] [Google Scholar]
- Song YQ, Willer JR, Scherer PC, Panzer JA, Kugath A, Skordalakes E, Gregg RG, Willer GB, Balice-Gordon RJ. Neural and Synaptic Defects in slytherin, a Zebrafish Model for Human Congenital Disorders of Glycosylation. Plos One. 2010b:5. doi: 10.1371/journal.pone.0013743. [DOI] [PMC free article] [PubMed] [Google Scholar]
- Takke C, Campos-Ortega JA. her1, a zebrafish pair-rule like gene, acts downstream of notch signalling to control somite development. Development. 1999;126:3005–3014. doi: 10.1242/dev.126.13.3005. [DOI] [PubMed] [Google Scholar]
- Tamagnone L, Comoglio PM. Signalling by semaphorin receptors: cell guidance and beyond. Trends Cell Biol. 2000;10:377–383. doi: 10.1016/s0962-8924(00)01816-x. [DOI] [PubMed] [Google Scholar]
- Taylor MK, Yeager K, Morrison SJ. Physiological Notch signaling promotes gliogenesis in the developing peripheral and central nervous systems. Development. 2007;134:2435–2447. doi: 10.1242/dev.005520. [DOI] [PMC free article] [PubMed] [Google Scholar]
- Therapontos C, Vargesson N. Zebrafish Notch Signalling Pathway Mutants Exhibit Trunk Vessel Patterning Anomalies That Are Secondary to Somite Misregulation. Dev Dynam. 2010;239:2761–2768. doi: 10.1002/dvdy.22410. [DOI] [PubMed] [Google Scholar]
- Thompson JD, Higgins DG, Gibson TJ. Clustal-W - improving the sensitivity of progressive multiple sequence alignment through sequence weighting, position-specific gap penalties and weight matrix choice. Nucleic Acids Res. 1994;22:4673–4680. doi: 10.1093/nar/22.22.4673. [DOI] [PMC free article] [PubMed] [Google Scholar]
- Torres-Vazquez J, Gitler AD, Fraser SD, Berk JD, Pham VN, Fishman MC, Childs S, Epstein JA, Weinstein BM. Semaphorin-plexin signaling guides patterning of the developing vasculature. Dev Cell. 2004;7:117–123. doi: 10.1016/j.devcel.2004.06.008. [DOI] [PubMed] [Google Scholar]
- vanEeden FJM, Granato M, Schach U, Brand M, FurutaniSeiki M, Haffter P, Hammerschmidt M, Heisenberg CP, Jiang YJ, Kane DA, Kelsh RN, Mullins MC, Odenthal J, Warga RM, Allende ML, Weinberg ES, NussleinVolhard C. Mutations affecting somite formation and patterning in the zebrafish, Danio rerio. Development. 1996a;123:153–164. doi: 10.1242/dev.123.1.153. [DOI] [PubMed] [Google Scholar]
- Westerfield M. The zebrafish book: a guide for the laboratory use of zebrafish (Brachydanio rerio) University of Oregon Press; Eugene, OR: 1993. [Google Scholar]
- Wheeler SR, Stagg SB, Crews ST. Multiple Notch signaling events control Drosophila CNS midline neurogenesis, gliogenesis and neuronal identity. Development. 2008;135:3071–3079. doi: 10.1242/dev.022343. [DOI] [PMC free article] [PubMed] [Google Scholar]
- Xiao MJ, Han Z, Shao B, Jin K. Notch signaling and neurogenesis in normal and stroke brain. Int J Physiol Pathophysiol Pharmacol. 2009;1:192–202. [PMC free article] [PubMed] [Google Scholar]
- Xu ZP, Dutra A, Stellrecht CM, Wu CY, Piatigorsky J, Saunders GF. Functional and structural characterization of the human gene BHLHB5, encoding a basic helix-loop-helix transcription factor. Genomics. 2002;80:311–318. doi: 10.1006/geno.2002.6833. [DOI] [PubMed] [Google Scholar]
- Yeo SY, Chitnis AB. Jagged-mediated Notch signaling maintains proliferating neural progenitors and regulates cell diversity in the ventral spinal cord. P Natl Acad Sci USA. 2007;104:5913–5918. doi: 10.1073/pnas.0607062104. [DOI] [PMC free article] [PubMed] [Google Scholar]
- Zerucha T, Stuhmer T, Hatch G, Park BK, Long QM, Yu GY, Gambarotta A, Schultz JR, Rubenstein JLR, Ekker M. A highly conserved enhancer in the Dlx5/Dlx6 intergenic region is the site of cross-regulatory interactions between Dlx genes in the embryonic forebrain. J Neurosci. 2000;20:709–721. doi: 10.1523/JNEUROSCI.20-02-00709.2000. [DOI] [PMC free article] [PubMed] [Google Scholar]
- Zuker M. Mfold web server for nucleic acid folding and hybridization prediction. Nucleic Acids Res. 2003;31:3406–3415. doi: 10.1093/nar/gkg595. [DOI] [PMC free article] [PubMed] [Google Scholar]
Associated Data
This section collects any data citations, data availability statements, or supplementary materials included in this article.
Supplementary Materials
Supplemental Information
Supplemental Fig.1. dbx1a, her4.2, nxph1, hes5 and plxnd1 relative expression values (Efficiency based method; Pfaffl, 2001) were plotted in a 3D graph for both groups (WT sib and mib mutants). Note a co-variation pattern of expression of these genes; in this example, when dbx1a was plotted against her4.2 and nxph1 its expression decreased (represented by green color) simultaneously with the increase of her4.2 and nxph1 expression (red color) in the 3 dpf WT siblings (A). In mib mutants, we observe an opposite pattern, dbx1a expression increases (red) with down-regulation of her4.2 and nxph1 (green) (B). A similar pattern is shown when dbx1a was plotted against hes5 and plxnd1 in WT sib (C) and mib mutants (D); dbx1a is inversely correlated with Hes5. Abbreviations: dbx1a, developing brain homeobox 1a; her4.2, hairy-related 4.2; hes5, hairy and enhancer of split 5; nxph1, neurexophilin 1 and plxnd1, plexin D1.
Supplemental Table 1. Pearson correlation coefficients are summarized in this table. The highest correlation coefficients >0.70 or < -0.70 significant at the 0.01 level are indicated by two asterisks and the correlation coefficients < 0.7 or >-0.7 significant at the 0.05 level are indicated by one asterisk.
Supplemental Table 2. Primer's sequences, GeneBank accession number and amplicon size for the investigated genes in conventional RT-PCR; primers indicated by asterisks were also used in preparing the probes for In Situ Hybridization DNA (template preparation using PCR amplification).
Supplemental Table 3. Real-time qPCR primer sequences and amplicon sizes for the SybrGreen assays.
Supplemental Table 4. qPCR efficiencies for all the gene of interest, slope of the curves, intercept and the correlation coefficient were estimated using the equation E=10[-1/slope] (qCalculator software). Cycle threshold (CT) values were obtained by the standards serial dilutions assayed in triplicate (4-fold serial dilution).


