Abstract
Three-dimensional (3D) constructive interference in steady state (CISS) is a gradient-echo MRI sequence that is used to investigate a wide range of pathologies when routine MRI sequences do not provide the desired anatomic information. The increased sensitivity of the 3D CISS sequence is an outcome of the accentuation of the T2 values between cerebrospinal fluid (CSF) and pathological structures. Apart from its well-recognized applications in the evaluation of the cranial nerves, CSF rhinorrhea and aqueduct stenosis, we have found the CISS sequence to be useful for the cisternal spaces, cavernous sinuses and the ventricular system, where it is useful for detecting subtle CSF-intensity lesions that may be missed on routine spin-echo sequences. This information helps in the management of these conditions. After a brief overview of the physics behind this sequence, we illustrate its clinical applications with representative cases and discuss its potential role in imaging protocols.
Keywords: 3D CISS, cranial nerves, neurocysticercosis
Introduction
Three-dimensional (3D) constructive interference in steady state (CISS) is a fully refocused steady-state gradient-echo MRI sequence. This sequence is now freely available and is frequently used in MRI to investigate a wide range of pathologies when routine MRI sequences do not provide the desired anatomic information.[1] Hence understanding its basic physics and clinical applications is essential. Equivalent sequences on other MRI scanners include, for example, the FIESTA-C- (Fast Imaging Employing Steady-state Acquisition Cycled Phases) on GE (General Electric, Milwaukee, USA) MRI systems.
In this article, we review the physics behind this sequence, illustrate its clinical applications with representative cases and discuss its potential role in imaging protocols.
Physics
A steady-state sequence is a type of gradient-echo sequence in which residual transverse magnetization is refocused so that a steady magnitude of longitudinal and transverse magnetization is achieved after a few repetition time (TR) periods. Once steady state is reached, two types of signals – free induction decay (S+) and spin-echo (S-) – are produced.[2] Balanced-Steady State Free Precission (SSFP) sequence (TrueFISP on Siemens, FIESTA on GE and balanced TFE on Philips) uses both signals (S+ and S-) for image formation. CISS is a modification of TrueFISP. Two consecutive runs of 3D balanced steady-state free precession, one with alternating +α and -α excitation pulses (where α = flip angle) and the other with constant α pulses, are combined. These two image sets show reciprocally shifted ‘banding artifacts.’ The banding artifact-free CISS image is obtained by the maximum intensity projection between these two data sets.[3]
Image Acquisition and Image Processing
All our patients were imaged on a 1.5-T clinical scanner (Avanto-SQ Engine; Siemens, Erlangen, Germany). A 12-channel phased-array head coil and a spine-array surface coil were used. The CISS sequence parameters were TR (repetition time), 5.42 ms; TE (echo time), 2.42 ms; flip angle, 77°; bandwidth, 399 Hz/Px; slice thickness, 0.70 mm, with interslice gap of 20% and with 64 slices in a single slab; matrix size, 256 × 256. A TE of 2.42 ms was chosen to limit signal loss from magnetic susceptibility effects, and a flip angle of 77° was used to reduce T1 weighting. The acquisition time was 3.30 minutes with the use of two averages. Two-dimensional distortion correction, Prescan normalize, and elliptical filters were applied. The raw data was reviewed on an independent LEONARDO® workstation, with multiplanar reconstruction performed routinely.
Image Characteristics
Image contrast in CISS is determined by the T2/T1 ratio of the tissue.[2] Tissues with both long T2 relaxation times and short T1 relaxation times have increased signal intensity. Because of high T2/T1 ratio, water and fat have high signal on this sequence. There is excellent contrast between cerebrospinal fluid (CSF) and other structures. The other tissues have poor contrast, and the gray-white differentiation is also not well visualized. Summation of alternating and non-alternating data sets produces an image with homogenous intensity distribution.[1] The advantages of CISS are high signal-to-noise ratio, high contrast-to-noise ratio,[4] and intrinsic insensitivity to motion.[2]
Clinical Applications
Because of the image characteristics described above, CISS sequence plays an important role in evaluating structures surrounded by CSF. It is useful for imaging lesions that are relatively isointense to CSF on T1W and T2W images.[5] Specific applications are described below.
Evaluation of the cranial nerves
Three-dimensional CISS is routinely used in the assessment of cerebellopontine angle lesions, inner ear structures and the internal auditory canal (IAC).[6] With this sequence, the fine structure of the cranial nerves VII and VIII and the membranous labyrinth of the internal ear can be clearly demonstrated. This has facilitated detection of small intracanalicular lesions and diagnosis of the nerve of origin, depending upon the exact location in the IAC. This helps us to precisely diagnose schwannomas arising from the cochlear nerve [Figure 1]. CISS images can be acquired in any plane but most commonly in the axial plane, for cranial nerve imaging. However, for evaluating the VII-VIII cranial nerve complex, it is helpful to obtain images in the coronal or oblique sagittal plane perpendicular to the IAC or to reconstruct these from the source axial images.[7] CISS is considerably superior to 3D turbo spin-echo (TSE) for nerve visualization in the cerebellopontine angle; and just as good as 3D TSE, in the internal auditory canal. The inclusion of CISS in an MRI imaging protocol of the facial and vestibulocochlear nerves is therefore recommended.[8]
Figure 1 (A,B).
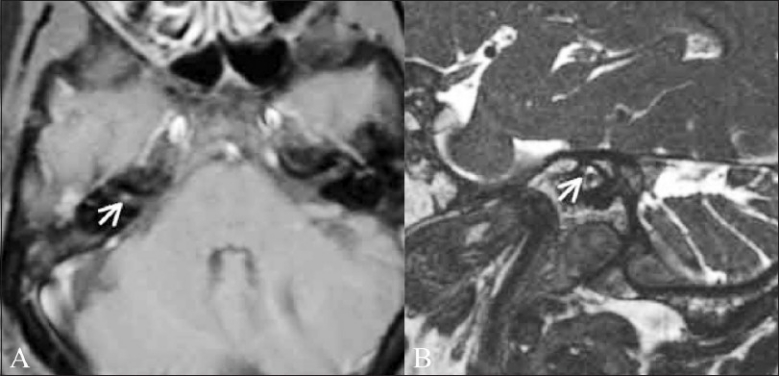
Cochlear schwannoma. A 46-year-old male patient presented with right-sided sensorineural hearing loss. Thin T1W fatsaturated contrast-enhanced image (A) shows a well-defined enhancing mass lesion (white arrow) of 2-mm size, confined to the right internal auditory canal. Oblique axial CISS image (B) reveals that the lesion is confined to the cochlear nerve (antero-inferior) (white arrow)
Trigeminal neuralgia is caused most commonly by compression of the root entry zone of the trigeminal nerve by a vascular loop.[9] This compression and displacement of the nerve by the vascular loop is well evaluated by the CISS sequence [Figure 2], which demonstrates the thinning of the root entry zone and allows exact identification of the vascular loop. It has been proposed as the initial screening procedure for all patients with refractory trigeminal neuralgia, especially if surgical intervention is being considered.[10] Contrast-enhanced CISS is useful for evaluating the trigeminal ganglion[11] and the cisternal segment of the nerve.
Figure 2 (A,B).
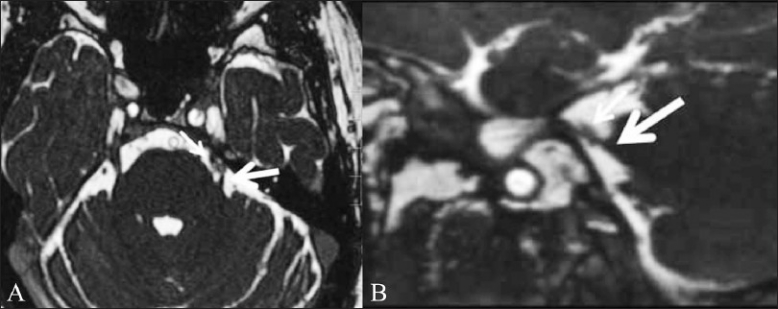
Trigeminal neuralgia. A 54-year-old male patient presented with left facial pain. Axial CISS image (A) and sagittal reconstruction (B) show that the root entry zone of the left trigeminal nerve is thinned and displaced by an adjacent vessel (thick white arrow points to the nerve and thin white arrow points to the vessel)
Orbital masses may arise from optic nerves (e.g., optic glioma) or other nerves in the orbit (e.g., nerve sheath tumor). Both these tumors are known to occur in patients with neurofibromatosis.[12] The CISS sequence can define the relationship of the tumor to the optic nerve and differentiate between these tumors on the basis of the location of the tumor and the thickening and encasement of the optic nerve [Figure 3].
Figure 3 (A,B).
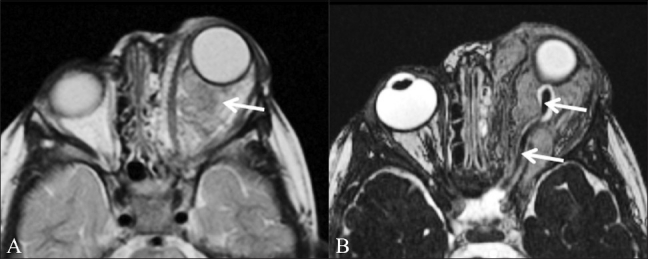
Orbital neurofibroma. A 3-year-old boy had proptosis since birth and multiple café-au-lait spots. T2W axial image (A) shows a large intraorbital mass (arrow). In addition, multiple areas of increased signal intensity (arrowheads) are seen in the pons and both middle cerebral peduncles (representing “neurofibromatosis bright objects”). CISS image (B) shows normal thickness of the optic nerve (arrow) and of the CSF sheath around it, excluding an optic nerve origin for the tumor. These findings are in keeping with a diagnosis of plexiform neurofibroma rather than optic glioma
Evaluation of the cisternal spaces and cavernous sinus
Malignancies and infectious processes like granulomas may spread along the basal cisterns. Granulomas are seen as nodular structures in the cisterns and are related to the cranial nerves. While infectious processes are classically evaluated on contrast-enhanced images,[13] it should be kept in mind that these nodules or basal infiltrates are well depicted on CISS and may sometimes be missed on other sequences if they are isointense to CSF and do not show enhancement [Figure 4].
Figure 4 (A-D).
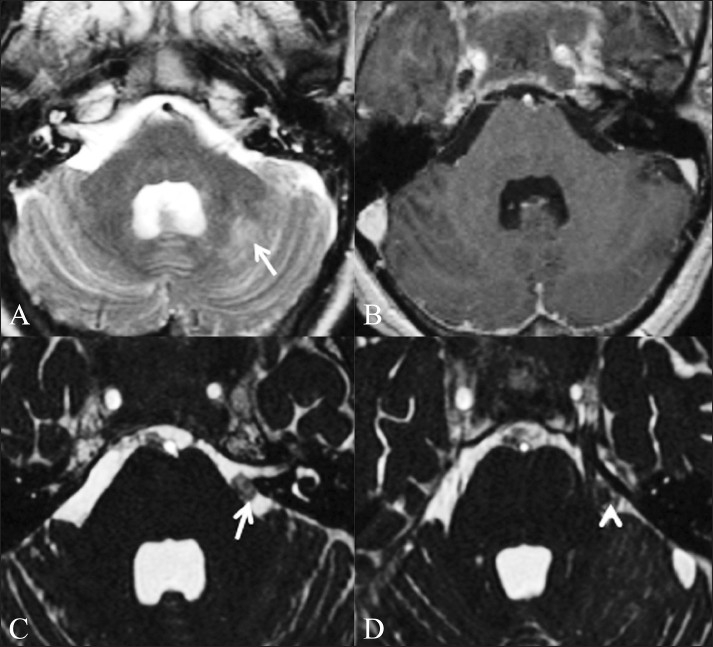
Fungal granulomas. A 56-year-old male patient presented with headache, neck pain, and fever for 1 month, right hemiparesis for 10 days and altered sensorium for 1 day. Axial T2W (A) and T1W contrast-enhanced (B) images do not show any abnormality in the basal cisterns. Abnormal T2-hyperintense signal is present in the left cerebellar hemisphere (arrow), which showed restricted diffusion (not shown) suggestive of an acute infarct. Axial CISS image (C) shows nodular soft tissue (arrow) in the pre-pontine cistern, which was diagnosed to be a fungal granuloma. Axial CISS image acquired a few sections higher (D) shows a fungal granuloma (arrow) abutting the left trigeminal nerve (arrowhead)
Arachnoid cysts follow CSF signal intensity on all pulse sequences and have thin walls.[14] In postoperative cases, CISS may help to differentiate between a recurrent arachnoid cyst and a postoperative cavity by demonstrating adhesions [Figure 5].
Figure 5 (A,B).
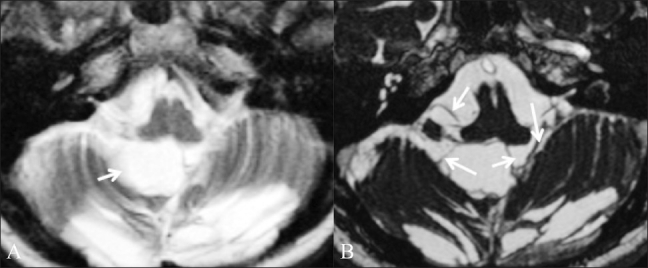
Postoperative adhesions. A 39-year-old female patient who had been operated multiple times came with a recurrent posterior fossa arachnoid cyst. Axial T2W image (A) shows a cystic lesion (arrow) in the posterior fossa. It is not clear whether this is a recurrent arachnoid cyst or a postoperative fluid collection. Axial CISS image (B) shows adhesions (arrows) in the cyst, which makes it more likely to be a postoperative fluid collection
The imaging findings of Tolosa-Hunt syndrome are classical but may be subtle.[15] MRI may show only slight enlargement or alteration in the shape of the cavernous sinus, but this is well seen on a CISS sequence [Figure 6].
Figure 6 (A-C).
Tolosa–Hunt syndrome. A 76-year-old female presented with pain in her left eye and diplopia. Axial T2W (A), T1W contrast enhanced (B), and CISS (C) images show abnormal bulge of the left cavernous sinus, with abnormal soft tissue (arrow) extending to the left orbital apex. A diagnosis of Tolosa-Hunt syndrome was made
Diagnosis of neurocysticercosis
Identification of the scolex is essential for making a definitive diagnosis of neurocysticercosis (NCC). This scolex may be missed on routine sequences, but a 3D sequence like CISS will demonstrate it [Figures 7A–C]. We have seen this in several of our patients with NCC and hence have included this sequence in our protocol of MRI for suspected NCC.
Figure 7 (A-D).
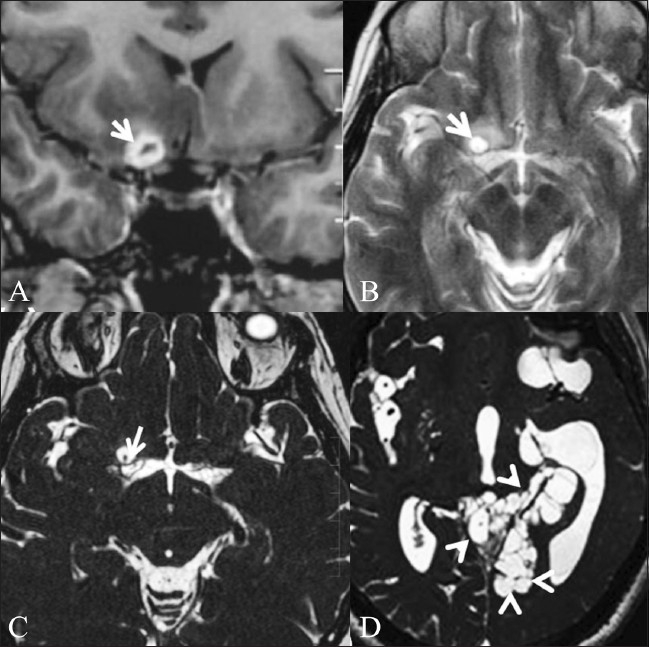
Neurocysticercosis in a 44-year-old female. Contrastenhanced T1W coronal image (A) shows conglomerate ring-enhancing lesions (arrow) in the right basifrontal region, just anterior to the right middle cerebral artery (MCA) cistern. T2W image (B) obtained after 1 month shows a cystic lesion (arrow) in the same location. CISS sequence (C) demonstrates the cyst with the scolex within (white arrow), confirming the diagnosis of neurocysticercosis. Threedimensional CISS of another patient (D) shows intraventricular and cisternal cystic lesions (multiple arrowheads), suggestive of racemose cysticercosis
While cysts of neurocysticercosis are most often located in the cerebral parenchyma, they may also be found in the ventricles or basal cisterns, or both. Intraventricular cysticercal cysts constitute 7% to 20% of neurocysticercosis infections.[16] Most of these cysts are located in the fourth ventricle. The mortality and morbidity arise from acute obstructive hydrocephalus. As they are surrounded by CSF, which is of the same signal intensity as the cyst fluid, they may be difficult to identify on routine sequences. However, the cyst wall and scolex are well visualized on CISS [Figure 7D]. The increased sensitivity of the 3D CISS sequence is due to its higher contrast-to-noise ratio and may also be related to accentuation of the T2 value between the cystic fluid and the surrounding CSF.[17]
Evaluation of CSF rhinorrhea
A 3D CISS sequence is a reliable noninvasive investigation to evaluate patients with CSF rhinorrhea [Figure 8]. Also, it does not involve ionizing radiation[18] and thus allows repeated follow-up studies to be performed. However, bony defects are not well visualized.
Figure 8.
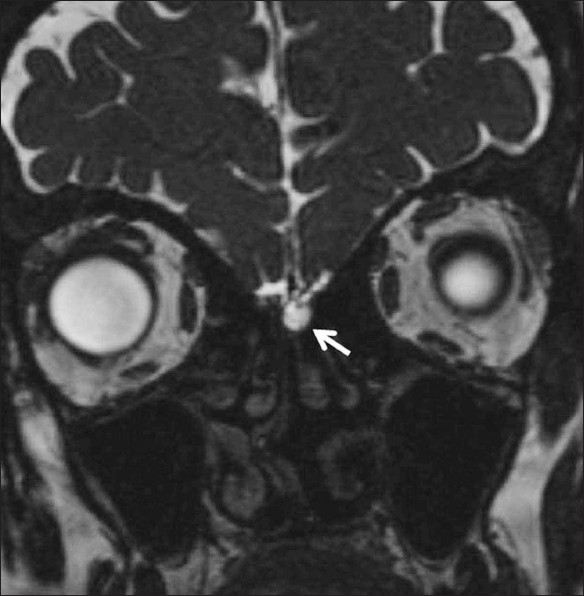
CSF rhinorrhea. A 52-year-old female patient presented with spontaneous CSF rhinorrhea from the left side. Coronal CISS image shows abnormal fluid intensity in the region of the left cribriform plate (white arrow)
Evaluation of the ventricular system
Because of high contrast, a 3D CISS sequence is used to study the CSF pathways[19] and lesions impeding CSF flow. It can reveal various causes of obstructive hydrocephalus, such as congenital acqueductal stenosis or membranes;[19] or other intraventricular obstructive lesions, e.g., enlarged Virchow-Robin spaces [Figure 9].
Figure 9 (A-D).
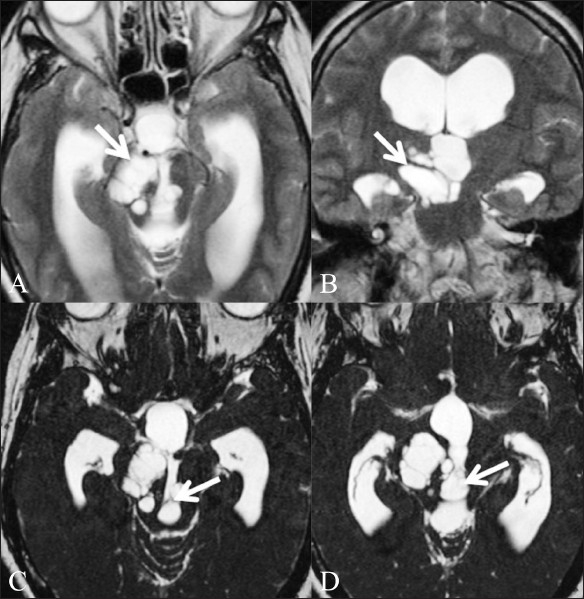
Giant Virchow-Robbin spaces. A 53-year-old female patient presented with headache, giddiness, and gait unsteadiness for 2 years. T2W axial (A) and coronal (B) images show a multicystic mass (arrow) extending along the right cerebral peduncle to the midbrain. Also, note the hydrocephalus with obstruction at the level of the posterior third ventricle. CISS axial images (C,D) clearly show the intraventricular component of the cystic lesion (arrow) to be the cause of the hydrocephalus
The 3D CISS sequence can provide additional information for better definition of other intraventricular lesions as well. Cyst walls – their extent and margins – are clearly depicted on 3D CISS images.[1] Tiny colloid cysts that may be missed on routine sequences are detected on the CISS sequence [Figure 10].
Figure 10.
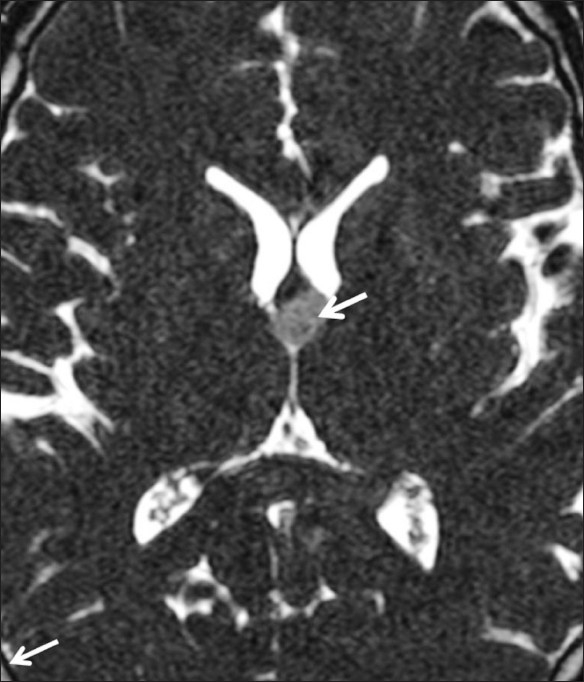
Colloid cyst. A well-circumscribed lesion (arrow) that is hypointense to CSF in the region of the foramen of Monro is well visualized on the CISS sequence
Evaluation of brain tumors
The visualization of a CSF cleft on CISS sequence allows for the differentiation between intra- and extra-axial tumors. The direction of displacement of the adjacent nerves and vessels gives a clue as to the location of the tumor. Intra-axial tumors will displace these laterally [Figure 11]. The exact location and extent of the tumor and the presence of intra-tumoral cysts are also well visualized on this sequence. Tumors located in the subarachnoid space are better depicted on this sequence than on other sequences.[20] It can help in better delineation of the borders and extent of intraventricular tumors [Figure 12].
Figure 11 (A,B).
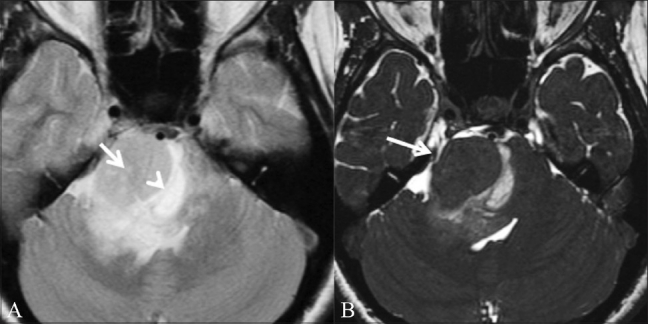
Brainstem glioma. A 31-year-old female patient presented with diplopia and squint for 8 months, VII and VIII cranial nerve palsy, and left hemiparesis since 3 weeks. T2W axial image (A) shows a mass (arrow) in the right cerebellopontine angle. A suspicious CSF cleft (arrowhead) is seen. On this image it is not clear whether the mass is intra- or extra-axial. CISS axial image (B) shows that the adjacent nerves and vessels are pushed laterally (white arrow), allowing the diagnosis of a brainstem glioma to be made (intraaxial)
Figure 12 (A,B).
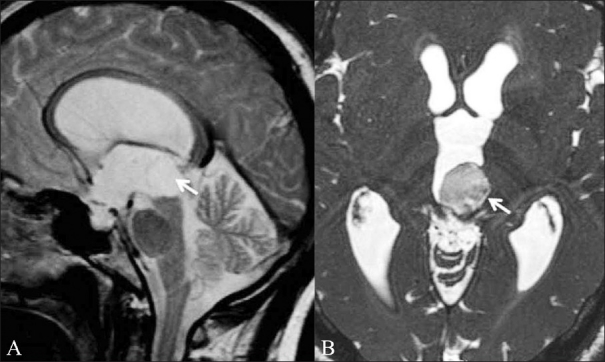
Intraventricular epidermoid. A 46-year-old male patient presented with features of raised intracranial pressure. T2W sagittal image (A) shows obstructive hydrocephalus. The fourth ventricle is undilated. A CSF-intensity lesion is seen in the posterior third ventricle (white arrow); it is not distinguishable from the surrounding ventricle. CISS axial image (B) shows an intraventricular epidermoid in the posterior third ventricle (white arrow) and better delineates the margins
Giant arachnoid granulations
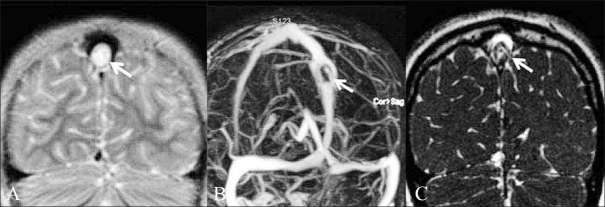
Filling defects in the dural venous sinuses may be caused by thrombosis, tumors (meningiomas) or large arachnoid granulations. Arachnoid granulations are normal structures that may be mistaken for pathology.[21] These can be diagnosed by the typical imaging characteristics, such as the CSF-signal-intensity pattern on T1W and T2W images.[22] The rent in the dura and the communication with the subarachnoid space, as well as the intrinsic vessels, are clearly seen on CISS sequence [Figure 13].
Figure 13 (A-C).
Giant arachnoid granulations. An 8-year-old boy presented with headache and atypical febrile seizures since 6 months. On the T2W coronal image (A), a CSF-intensity filling defect is seen in the dorsal superior sagittal sinus (white arrow). Contrast-enhanced venogram (B) shows that there is distortion and enlargement of the superior sagittal sinus around the mass that is located approximately 6 cm above the torcula (white arrow); however, the sinus is not occluded by the mass. Coronal CISS image (C) better delineates the filling defect and shows that it is caused by arachnoid granulation (white arrow)
Evaluation of diseases of the spine and spinal cord
Spinal vascular malformations may show subtle findings on routine sequences. CISS can clearly demonstrate the engorged pial venous plexus associated with these lesions. The associated cord signal abnormality is better appreciated on a T2 sequence.[5]
In cases of spinal trauma, the avulsion of the roots of the brachial plexus is best demonstrated on a CISS sequence. Late complications of trauma, like focal pial adhesions, cord tethering and traumatic syringohydromyelia, are better visualized with CISS than with conventional sequences.[5] Post-myelography adhesions [Figure 14], with displacement of the cord and globules of retained contrast, can be well demonstrated in arachnoiditis. Similarly, focal displacement of the spinal cord in ventral cord herniation [Figure 15] is also well visualized on this sequence.
Figure 14 (A-C).
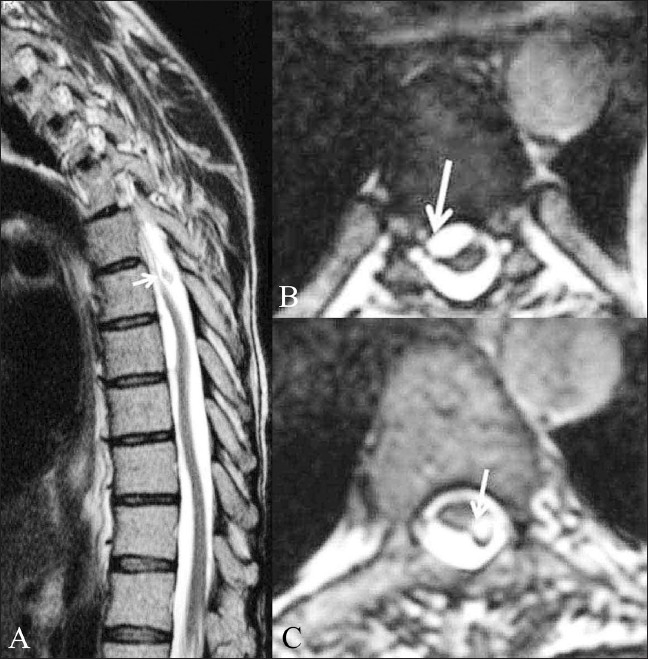
Post-myelography adhesions. A 42-year-old male patient presented with paraparesis and with a history of myelography done 17 years back. T2W sagittal image (A) of the dorsal spine shows an undulating spinal cord. A globule, which was hyperintense on T1W images (not shown), is seen just dorsal to the cord (white arrow). Axial CISS images (B,C) show the deformation of the cord by the subarachnoid adhesions (white arrow in B) and the exact site of attachment of the fat globule (white arrow in C), which has an associated chemical shift artifact
Figure 15 (A-D).
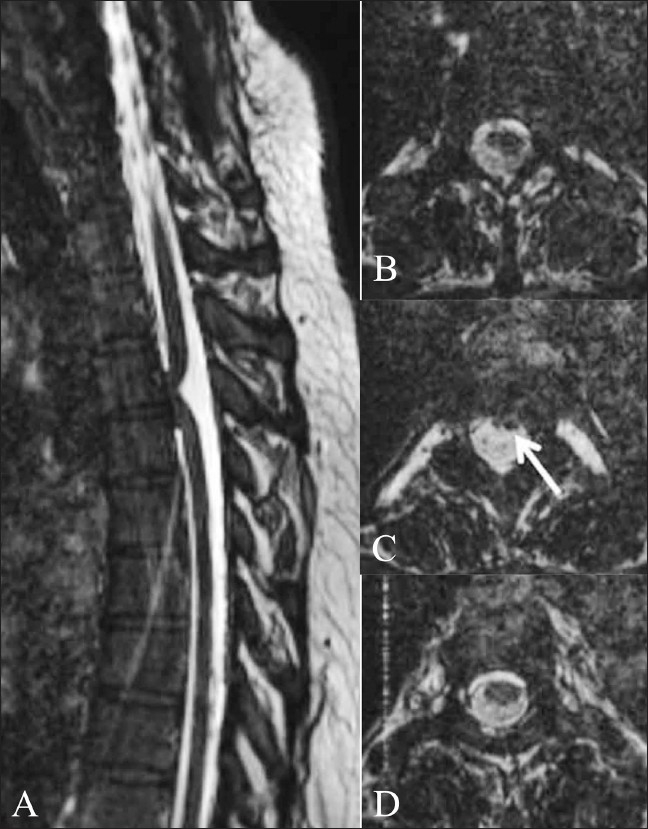
Ventral cord herniation. Sagittal 3D CISS image (A) shows focal anterior displacement of the thoracic cord (arrow), suggestive of ventral cord herniation. Axial 3D CISS images from cranial to caudal (B–D) show the spinal cord flattened anteriorly against the vertebral body (arrow in B). There are no subarachnoid adhesions or mass lesions causing this displacement
In patients with syringomyelia, CISS sequence can detect subarachnoid webs, cavitations in the syrinx[4] and metameric segmentations in cases of Arnold-Chiari malformation.[5] The flow void artifact is decreased in the CISS sequence as compared to other T2W sequences. The detection of subarachnoid adhesions by this sequence plays an important role in identifying those patients who require surgical decompression of syringomyelia.
Advantages and limitations
The increased sensitivity of the 3D CISS sequence is an outcome of the accentuation of the T2 values between CSF and pathological structures.[4] The thin contiguous sections and high in-plane resolution make it possible to depict minute structures. Any desired imaging plane can be obtained by the multiplanar reconstructive technique.[1] There is minimal signal loss due to CSF pulsations. The limitation includes long image-acquisition times.[4] Though the inherent lack of tissue characterization is mentioned as a limitation,[5] we have found this sequence to have some role in tissue characterization of intraventricular and extra-axial lesions.
Conclusion
Three-dimensional CISS sequence provides superior topographic information that helps to delineate the exact location of various cranial and spinal pathologies. Often, we have found that this sequence provides information that is not provided by other spin-echo sequences. Apart from the well-recognized applications in the evaluation of cranial nerves, CSF rhinorrhea and aqueduct stenosis, we have found the CISS sequence to be useful in evaluating the cisternal spaces, cavernous sinuses and ventricular system in terms of detecting subtle CSF-intensity lesions that may be missed on routine spin-echo sequences. This information plays an important role in deciding the mode of management of these conditions.
Footnotes
Source of Support: Nil,
Conflict of Interest: None declared.
References
- 1.Yang D, Korogi Y, Ushio Y, Takahashi M. Increased Conspicuity of Intraventricular Lesions Revealed by Three-dimensional Constructive Interference in Steady State Sequences. Am J Neuroradiol. 2000;2:1070–2. [PMC free article] [PubMed] [Google Scholar]
- 2.Chavhan GB, Babyn PS, Jankharia BG, Cheng HL, Shroff MM. Steady-State MR Imaging Sequences: Physics, Classification, and Clinical Applications. Radiographics. 2008;28:1147–60. doi: 10.1148/rg.284075031. [DOI] [PubMed] [Google Scholar]
- 3.Scheffler K, Lehnhardt S. Principles and applications of balanced SSFP technique. Eur Radiol. 2003;13:2409–18. doi: 10.1007/s00330-003-1957-x. [DOI] [PubMed] [Google Scholar]
- 4.Roser F, Ebner FH, Danz S, Riether F, Ritz R, Dietz K, et al. Three-dimensional constructive interference in steady-state magnetic resonance imaging in syringomyelia: Advantages over conventional imaging. J Neurosurg Spine. 2008;8:429–35. doi: 10.3171/SPI/2008/8/5/429. [DOI] [PubMed] [Google Scholar]
- 5.Ramli N, Cooper A, Jaspal T. High resolution CISS imaging of the spine. Br J Radiol. 2001;74:862–73. doi: 10.1259/bjr.74.885.740862. [DOI] [PubMed] [Google Scholar]
- 6.Casselman JW, Kuhweide R, Deimling M, Ampe W, Dehaene I, Meeus L. Constructive interference in steady state (CISS)- 3DFT MR Imaging of the inner ear and cerebellopontine angle. Am J Neuroradiol. 1993;14:47–57. [PMC free article] [PubMed] [Google Scholar]
- 7.Thomas B, Krishnamoorthy T, Aravinda HR, Kesavadas C. 3D-CISS MRI in a purely intracanalicular cochlear schwannoma. J Neuroradiol. 2008;35:305–7. doi: 10.1016/j.neurad.2008.05.003. [DOI] [PubMed] [Google Scholar]
- 8.Held P, Fründ R, Seitz J, Nitz W, Haffke T, Hees H, et al. Comparison of a T2* w. 3D CISS and a T2 w 3D turbo spin echo sequence for the anatomical study of facial and vestibulocochlear nerves. J Neuroradiol. 2000;27:137–8. [PubMed] [Google Scholar]
- 9.Becker M, Kohler R, Vargas MI, Viallon M, Delavelle J. Pathology of the Trigeminal Nerve. Neuroimag Clin N Am. 2008;18:283–307. doi: 10.1016/j.nic.2007.11.002. [DOI] [PubMed] [Google Scholar]
- 10.Tash RR, Sze G, Leslie D. Trigeminal neuralgia: MR imaging features. Radiology. 1989;172:767–70. doi: 10.1148/radiology.172.3.2772186. [DOI] [PubMed] [Google Scholar]
- 11.Yousry I, Moriggl B, Schmid UD, Naidich TP, Yousry TA. Trigeminal Ganglion and its Divisions: Detailed Anatomic MR Imaging with Contrast-Enhanced 3D Constructive Interference in the Steady State Sequences. Am J Neuroradiol. 2005;26:1128–35. [PMC free article] [PubMed] [Google Scholar]
- 12.Blaser SI, Smirniotopoulos JG, Murphy FM. Central nervous system manifestations of the phakomatoses. In: Atlas SW, editor. Magnetic Resonance Imaging of the Brain and Spine. Philadelphia, USA: Lippincott Williams and Wilkins, Wolters Kluwer; 2009. pp. 274–6. [Google Scholar]
- 13.Chang KH, Han MH, Roh JK, Kim IO, Han MC, Choi KS, et al. Gd-DTPA enhanced MR imaging in intracranial tuberculosis. Neuroradiology. 1990;32:19–25. doi: 10.1007/BF00593936. [DOI] [PubMed] [Google Scholar]
- 14.Schroeder HW, Gaab MR, Niendorf WR. Neuroendoscopic approach to arachnoid cysts. J Neurosurg. 1996;85:293–8. doi: 10.3171/jns.1996.85.2.0293. [DOI] [PubMed] [Google Scholar]
- 15.Calistri V, Mostardini C, Pantano P, Pierallini A, Colonnese C, Caramia F. Tolosa-Hunt syndrome in a patient with systemic lupus erythematosus. Eur Radiol. 2002;12:341–4. doi: 10.1007/s003300100960. [DOI] [PubMed] [Google Scholar]
- 16.Rhee RS, Kumasaki DY, Sarwar M, Rodriguez J, Naseem M. MR imaging of Intraventricular cysticercosis. J Comput Assist Tomogr. 1987;11:598–601. doi: 10.1097/00004728-198707000-00008. [DOI] [PubMed] [Google Scholar]
- 17.Govindappa SS, Narayanan JP, Krishnamoorthy VM, Shastry CH, Balasubramaniam A, Krishna SS. Improved Detection of Intraventricular Cysticercal Cysts with the Use of Three-dimensional Constructive Interference in Steady State MR Sequences. Am J Neuroradiol. 2000;21:679–84. [PMC free article] [PubMed] [Google Scholar]
- 18.Algin O, Hakeymez B, Gokalp G, Ozkan T, Korfali E, Parlak M. The contribution of 3D-CISS and contrast-enhanced MR cisternography in detecting cerebrospinal fluid leak in patients with rhinorrhoea. Br J Radiol. 2010;83:225–32. doi: 10.1259/bjr/56838652. [DOI] [PMC free article] [PubMed] [Google Scholar]
- 19.Dincer A, Kohan S, Ozek MM. Is All “Communicating” Hydrocephalus Really Communicating. Prospective Study on the Value of 3D-Constructive Interference in Steady State Sequence at 3T? Am J Neuroradiol. 2009;30:1898–1906. doi: 10.3174/ajnr.A1726. [DOI] [PMC free article] [PubMed] [Google Scholar]
- 20.Ikushima I, Korogi Y, Hirai T, Sugahara T, Shigematsu Y, Komohara Y, et al. MR of Epidermoids with a Variety of Pulse Sequences. Am J Neuroradiol. 1997;18:1359–63. [PMC free article] [PubMed] [Google Scholar]
- 21.Leach JL, Meyer K, Jones BV, Tomsick TA. Large Arachnoid Granulations Involving the Dorsal Superior Sagittal Sinus: Findings on MR Imaging and MR Venography. Am J Neuroradiol. 2008;29:1335–9. doi: 10.3174/ajnr.A1093. [DOI] [PMC free article] [PubMed] [Google Scholar]
- 22.Leach JL, Jones BV, Tomsick TA, Stewart CA, Balko MG. Normal appearance of arachnoid granulations on contrast-enhanced CT and MR of the brain: Differentiation from dural sinus disease. Am J Neuroradiol. 1996;17:1523–32. [PMC free article] [PubMed] [Google Scholar]


