Abstract
A recent study examined the stability of rankings from random forests using two variable importance measures (mean decrease accuracy (MDA) and mean decrease Gini (MDG)) and concluded that rankings based on the MDG were more robust than MDA. However, studies examining data-specific characteristics on ranking stability have been few. Rankings based on the MDG measure showed sensitivity to within-predictor correlation and differences in category frequencies, even when the number of categories was held constant, and thus may produce spurious results. The MDA measure was robust to these data characteristics. Further, under strong within-predictor correlation, MDG rankings were less stable than those using MDA.
Keywords: Random forest, variable importance measures, stability, ranking, correlation, linkage disequilibrium
Stability is a key factor in the interpretation of ranked lists of predictors using variable importance measures (VIMs) from random forests (RF) [1]. To be interpretable, rankings should be robust to changes due to small perturbations of data [2–3]. RF provides two VIMs: mean decrease Gini (MDG), which is the average across the forest of the decrease in Gini impurity for a predictor, and mean decrease accuracy (MDA), which is the average across the forest of the accuracy for the predictor minus the decrease in accuracy after permutation of the predictor. The MDA measure may be scaled by division by its empirical standard error (MDAscaled). This letter is in response to a recent Letter to the Editor published in Briefings in Bioinformatics that investigated the stability of RF VIM rankings using a bladder cancer recurrence data set containing 723 single nucleotide polymorphisms (SNPs) [3]. The authors performed a ‘jackknife’ procedure where, over 100 subsamples, 10% of the observations were deleted and MDG- and MDA-based ranks were compared with a single run of RF on the entire data set. The MDG rankings on the 100 subsamples were correlated with the original rankings using the full data set, with particularly strong correlation at the top and bottom of the rankings; correlation between rankings for MDA was observed for only the top-ranked predictors. The authors concluded that the ranking stability of MDG was superior to MDA [3].
MDG has been shown to be sensitive to predictors with different scales of measurement (e.g. binary versus continuous) and shows artificial inflation for predictors with larger numbers of categories [4], although the previous study [3] suggested that when all predictors have similar numbers of categories (e.g. SNP data) MDG may be preferred because of increased stability. However, SNPs vary in their category (minor allele and genotype) frequencies. It is currently unknown whether category frequencies influence rankings using RF. Further, MDG has been shown to be biased in the presence of within-predictor correlation [5–8], which is a common feature of SNP data due to linkage disequilibrium (LD). I show the rankings based on MDG, although generally stable, are sensitive to differences in category frequencies and within-predictor correlation, and thus may lead to spurious results.
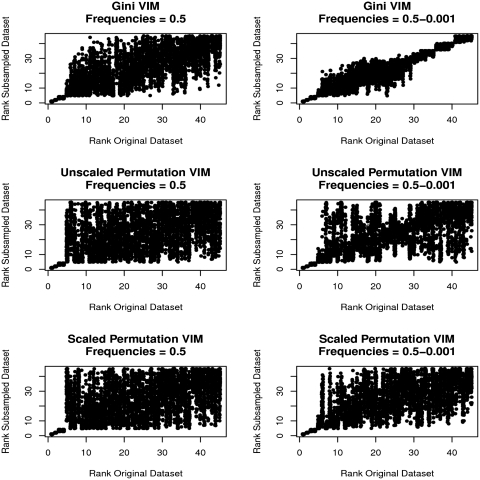
To determine whether the stability and rankings of VIMs were sensitive to differences in category frequencies, I performed a simulation study of 1,000 cases and controls, where 45 uncorrelated binary predictors were simulated using the R package bindata version 0.9-17 [9]. The first five predictors were simulated to have empirical odds ratios (ORs) of 3.0, 2.5, 2.0, 1.5 and 1.25 and had minor category frequency of 0.5; the additional 40 predictors were simulated under H0 in two ways: (i) all predictors with minor category frequency of 0.5 and (ii) sets of five predictors each having minor category frequencies of 0.5, 0.4, 0.3, 0.2, 0.1, 0.05, 0.01 and 0.001. As in the original study [3], one data set was generated and the analysis compared the ranking of each predictor with the rankings from 100 90% subsamples. In the data set with frequencies of 0.5 for all predictors under H0, MDG, MDA and MDAscaled all showed strong correlation between the rankings of the first five truly associated predictors (Figure 1, first column). They varied in the ranking stability of predictors ranked 6–45 (those under H0), where MDG showed moderate correlation between the rankings from the original analysis and those obtained with the subsamples (Figure 1, top left), whereas both MDA measures showed random scatter of rankings (Figure 1, middle and bottom left). The picture was different when predictors simulated under H0 had differing category frequencies (Figure 1, right column); although all measures produced strong correlation between the rankings for the truly associated predictors (1–5) as in the previous case, MDG (full data set) rankings were strongly correlated with the subsample rankings (Figure 1, top right) for the predictors under H0 (predictors ranked 6–45), with stronger correlation in the tails of the rankings versus the centre, as found in the SNP data set studied by Calle and Urrea [3]. The lowest ranked always contained predictors with low frequencies (0.001–0.1). In fact, predictors with minor category frequencies of 0.01 were always ranked 30–35 of 45, those with frequency of 0.05 were always ranked 36–40 of 45 and those with frequency of 0.001 were always ranked 41–45, which produces the block-like pattern seen in the MDG plot (Figure 1, right column, top panel). This strong dependency of rank on category frequency for the lowest ranked predictors was not observed for either MDAs (Figure 1, middle and bottom right).
Figure 1:
MDG, MDA and MDAscaled rankings of predictors in 100 90% subsamples versus rankings from the full data set with equal and varying predictor category frequencies. Left column: ranks for five associated predictors with minor category frequencies of 0.5; right column: ranks for five associated and 40 unassociated predictors with frequencies ranging from 0.5 to 0.001. Top row: MDG; middle row: MDA; bottom row: MDAscaled.
A further investigation into the dependency of MDG and MDA rankings on minor category frequency considered simulations as above under HA with the same generating model and ORs, but varied the minor category frequencies of the truly associated predictors (Table 1). MDA results were superior to MDAscaled in all conditions (data not shown). When the truly associated predictors had a minor category frequency of 0.5, the MDG was more likely to rank the weakly associated predictor X5 (OR = 1.25) in the top 5 (38%) or 10 (90%) predictors versus MDA (top 5 = 15%, top 10 = 62%); otherwise, both measures were able to rank the additional four truly associated predictors in the top 5 in 100% replicates. However, when the minor category frequency was 0.05, MDA was able to rank X4 (OR = 1.5) in the top 5 in 100% of replicates, whereas MDG ranked this predictor in the top 5 in 57% of replicates and in the top 10 in 98%. Considering the condition where the minor category frequency was 0.01 (and with the limited sample size of 1000 cases and 1000 controls), MDA again was more likely to rank X3 (OR = 2.0) in the top 5 (16%) or 10 (59%) of replicates versus MDG (top 5 = 1%, top 10 = 4%).
Table 1:
Frequency of associated predictors within top k list for MDG and MDA, varying minor category frequencies
| Predictor | OR | Minor category frequency | MDG percentage ranked in top 5 | MDG percentage ranked in top 10 | MDA percentage ranked in top 5 | MDA percentage ranked in top 10 |
|---|---|---|---|---|---|---|
| X1 | 3 | 0.5 | 100 | 100 | 100 | 100 |
| X2 | 2.5 | 0.5 | 100 | 100 | 100 | 100 |
| X3 | 2 | 0.5 | 100 | 100 | 100 | 100 |
| X4 | 1.5 | 0.5 | 100 | 100 | 100 | 100 |
| X5 | 1.25 | 0.5 | 38 | 90 | 15 | 62 |
| X1 | 3 | 0.05 | 100 | 100 | 100 | 100 |
| X2 | 2.5 | 0.05 | 100 | 100 | 100 | 100 |
| X3 | 2 | 0.05 | 100 | 100 | 100 | 100 |
| X4 | 1.5 | 0.05 | 57 | 98 | 100 | 100 |
| X5 | 1.25 | 0.05 | 8 | 73 | 11 | 77 |
| X1 | 3 | 0.01 | 100 | 100 | 100 | 100 |
| X2 | 2.5 | 0.01 | 85 | 96 | 100 | 100 |
| X3 | 2 | 0.01 | 1 | 4 | 16 | 59 |
| X4 | 1.5 | 0.01 | 0 | 0 | 0 | 0 |
| X5 | 1.25 | 0.01 | 0 | 0 | 0 | 0 |
To assess the stability of rankings under within-predictor correlation, I simulated genetic case (N = 1000) − control (N = 1000) data under H0 and HA (for details of the simulation algorithm, see [7]), which contained 199 SNPs in 5 genes that displayed complex LD patterns. As in the binary simulation and [3], stability was assessed by comparison of the ranking of a single run of RF on the full data set versus 100 90% subsamples of the data.
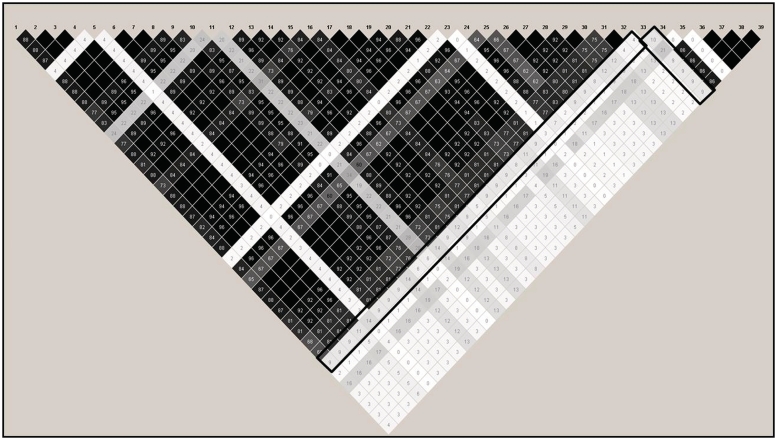
Under H0, MDG ranked a single SNP as the most strongly associated, with a median ranking of 1 (range: 1–2). Despite the stability of this ranking, the χ2 test of statistical association with case status had a P-value of 0.98. Thus, it was puzzling why MDG would consistently rank this SNP at the top of the predictor list. Interestingly, this SNP was one of few not in strong LD with other SNPs in the same gene (r2 ranged from 0.02 to 0.21; Figure 2). As shown previously, MDG prefers predictors that are uncorrelated with other predictors [7–8]. Further, this SNP also had a large minor allele frequency of 0.41. As shown in the binary simulations presented here, MDG prefers predictors with large category frequencies. To assure this result was not due to the particular replicate simulated, I repeated this 100 times with 100 independent replicates. The top-ranked SNP in the original simulation was ranked highest in 58% of the 100 replicates by 100 90% subsamples (thus, across 10 000 subsamples in total), even though the distribution of 100 χ2 P-values testing association between this SNP and case status was Uniform(0,1), as expected under H0 (quantiles: 0.0071, 0.28, 0.52, 0.81, 1.0). In contrast, the most frequently top-ranked SNP using MDA was ranked first in only 4% of the 10 000 subsamples; the corresponding value for MDAscaled was 1%. Therefore, both within-predictor correlation and varying category frequencies may lead to spurious conclusions when using MDG rankings.
Figure 2:
LD plot for the top-ranked SNP using MDG under H0. Black box around pairwise correlation (r2) values for the top-ranked SNP using MDG. Shading indicates strength of r2 values, with black indicating perfect LD (r2 of 1.0) and white boxes indicating no correlation (r2 = 0). Grey boxes indicate intermediate values.
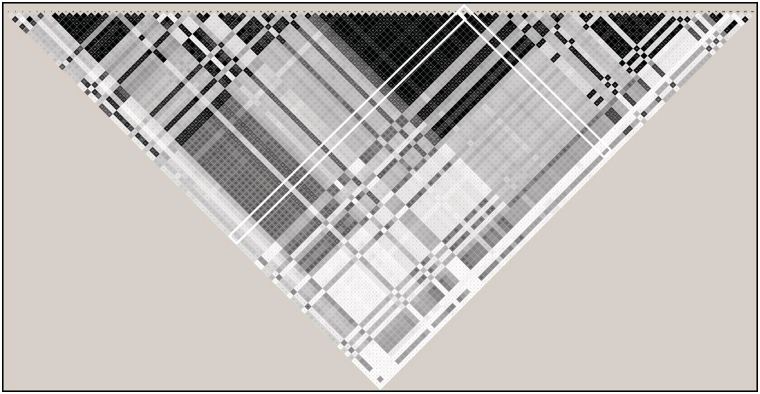
Under HA, one SNP in a block of strong LD (block r2 range: 0.88–1.0; Figure 3) with 25 other SNPs was simulated under a recessive genetic model to have an OR of 2.0 (Figure 3). The median rank across the 100 90% subsamples for the truly associated SNP using MDA was 19 and for MDAscaled was 21; however, the median rank using MDG was 101.5. Further, the within-predictor correlation led to unstable rankings for MDG (ranking range: 60–138); the rankings based on MDA (6–35) or MDAscaled (8–43) were more stable. MDA ranked the truly associated SNP in the top 10 in 18% of the subsamples and in the top 20 in 60% of the subsamples. The respective numbers for MDAscaled were 10 and 48% and 0 and 0% for MDG, respectively. Thus, MDG rankings may be less stable than MDA under conditions frequently found in biologic applications, such as within-predictor correlation, and the MDA-based measures were both superior to the MDG in ranking the truly associated predictor in the top k predictors, even though any measure not explicitly designed for within-predictor correlation would have difficulty in finding the true signal due to the strong LD in this scenario.
Figure 3:
LD plot for the truly associated SNP under HA. White box around pairwise correlation (r2) values for the truly associated SNP under HA. Shading indicates strength of r2 values, with black indicating perfect LD (r2 = 1.0) and white boxes indicating no correlation (r2 = 0). Grey boxes indicate intermediate values.
Rankings using MDG were dependent on category frequencies, even when the number of categories was held constant. This dependency was not observed using MDA. I illustrate, under H0, within-predictor correlation and large category frequencies lead to spuriously high rankings using MDG, but not MDA. Further, under HA and in the presence of within-predictor correlation, MDG rankings were less stable than MDA. Data characteristics should be considered when selecting a VIM for use, and when correlation is present, the use of alternative measures as suggested by Strobl et al. [5] or Meng et al. [6] may be warranted.
Key Points.
When category frequencies or scales of measurement vary, and/or within-predictor correlation exists, the MDA measure may be preferred.
MDA VIMs are more stable than MDG when strong within-predictor correlation is present.
The use of MDG may lead to stable but spuriously high rankings in some bioinformatics applications.
FUNDING
Partial funding was provided by the Wellcome Trust (to K.K.N.).
Acknowledgements
I am grateful to Dr. Yan Meng and Dr. Carolin Strobl for critical readings of an earlier version of this manuscript. This study utilized the high-performance computational capabilities of the Biowulf Linux cluster at the National Institutes of Health, Bethesda, MD, USA (http://biowulf.nih.gov).
Biography
Kristin K. Nicodemus is a Career Development Fellow in Computational Genomics at the Department of Anatomy, Physiology and Genetics at the University of Oxford, UK. Her main research interests are in the use of machine learning algorithms applied to genomic and neuroimaging data.
References
- 1.Breiman L. (2001) Random forests. Mach Learn. 2001;45:5–32. [Google Scholar]
- 2.Boulesteix AL, Slawski M. Stability and aggregation of ranked gene lists. Brief Bioinform. 2009;10:556–8. doi: 10.1093/bib/bbp034. [DOI] [PubMed] [Google Scholar]
- 3.Calle ML, Urrea V. Letter to the Editor: Stability of random forest importance measures. Brief Bioinform. 2011;12:86–9. doi: 10.1093/bib/bbq011. [DOI] [PubMed] [Google Scholar]
- 4.Strobl C, Boulesteix AL, Zeileis A, et al. Bias in random forest variable importance measures: illustrations, sources and a solution. BMC Bioinformatics. 2007;8:25. doi: 10.1186/1471-2105-8-25. [DOI] [PMC free article] [PubMed] [Google Scholar]
- 5.Strobl C, Boulesteix AL, Kneib T, et al. Conditional variable importance for random forests. BMC Bioinformatics. 2008;9:307. doi: 10.1186/1471-2105-9-307. [DOI] [PMC free article] [PubMed] [Google Scholar]
- 6.Meng YA, Yu Y, Cupples LA, et al. Performance of random forest when SNPs are in linkage disequilibrium. BMC Bioinformatics. 2009;10:78. doi: 10.1186/1471-2105-10-78. [DOI] [PMC free article] [PubMed] [Google Scholar]
- 7.Nicodemus KK, Malley JM. Predictor correlation impacts machine learning algorithms: implications for genomic studies. Bioinformatics. 2009;25:1884–90. doi: 10.1093/bioinformatics/btp331. [DOI] [PubMed] [Google Scholar]
- 8.Nicodemus KK, Malley JM, Strobl C, et al. The behaviour of random forest permutation-based variable importance measures under predictor correlation. BMC Bioinformatics. 2010;11:110. doi: 10.1186/1471-2105-11-110. [DOI] [PMC free article] [PubMed] [Google Scholar]
- 9.Leisch F, Weingessel A, Hornik K. On the generation of correlated artificial binary data. Adaptive information systems and modelling in economics and management science. Working Paper Series, Vienna University of Economics, 2008. Available at http://www.wu-wien.ac.at/am. [Google Scholar]


