Abstract
The TripleTOF 5600 System, a hybrid triple quadrupole time-of-flight mass spectrometer, was evaluated to explore the key figures of merit in generating peptide and protein identifications which included spectral acquisition rates, data quality, proteome coverage, and biological depth. Employing a Saccharomyces cerevisiae tryptic digest, careful consideration of several performance features demonstrated that the speed of the TripleTOF contributed most to the resultant data. The TripleTOF system was operated with 8, 20, and 50 MS/MS events in an effort to compare to other MS technologies and to demonstrate the abilities of the instrument platform.
Keywords: TripleTOF, proteomics, LC-MS/MS, Saccharomyces cerevisiae, hybrid time-of-flight
Introduction
Liquid chromatography-tandem mass spectrometry (LC-MS/MS) based technology continues to advance at a rapid pace. Some of the desirable LC-MS/MS performance characteristics for studying complex biological mixtures include high peak capacity, resolving power (e.g., RP > 10,000FWHM), mass measurement accuracy (e.g., MMA < 5 ppm), sub-femtomole sensitivity, and fast spectral acquisition rates (e.g., MS/MS ≈ 10 Hz).1, 2 At present, no single LC-MS/MS instrument excels at all of these metrics. Hybrid Fourier transform MS technology (FTMS) including high-field Quadrupole-FT-ion cyclotron resonance (Q-FT-ICR),3, 4 linear trap quadrupole (LTQ) FT MS,5 and LTQ-Orbitrap6 instruments have provided unprecedented RP, MMA, and cumulative peak capacity with respectable dynamic range (2–3 orders of magnitude) and speed of ~2.5 Hz per cycle depending on transient time, number of MS/MS scans, automatic gain control, and MS/MS scan type (i.e., high-resolution FT or LTQ). Hybrid time-of-flight (TOF) technologies (e.g., Q-TOF) have traditionally provided respectable RP (~10,000), MMA (~10 ppm), and peak capacities but have excelled at high spectral acquisition rates and expanded dynamic ranges (>3 orders of magnitude).
The recently introduced TripleTOF 5600 System (TripleTOF), a hybrid triple quadrupole TOF platform, is considered the first accurate mass, high resolution system of its kind and operates by means of information dependent acquisition (IDA) with the speed and sensitivity of a TOF MS and quantification capabilities similar to a triple quadrupole MS. The first proposal for a TOF instrument was made by Stephens in 19467 and Wiley & Mclaren8 who later described its advantages as being complete spectral accumulation of all ions with a theoretically unlimited mass range.8, 9 The signal-to-noise gain from highly resolved fragmentation enables analytically capabilities ensuing IDA modes for peptide and protein identification.10 TOF MS scanning and detection by time-to-digital converter (TDC) detectors are prone to saturation due to their inherent dead time, which affects not only the linearity, but also the mass accuracy of highly abundant ion signals.11–15 Alternatively, instruments incorporating analogue-to-digital converter (ADC) detectors have a greater signal handling capacity of the abundant species as it digitizes the output of micro-channel plates. This conversion is not as sensitive as the TDC detection output and higher background noise associated with slower ADC detectors can affect quantitative measurements and RP at low mass. Gated ion transmission control in TOF MS scanning offers the capability of diminishing detector saturation effects; however, fundamentally the speed of signal handling at the detector level remains the hallmark for acquiring high RP and MMA across the entire mass range.12–14 Better front-end ion sampling, high linear accelerated quadrupole frequencies, and accelerated transmission of the ions through the TOF region can provide high sensitivity across the mass range (low amol peptide detection) at 100 Hz operation. In an effort to understand and demonstrate the performance characteristics of the TripleTOF towards global proteome measurements, we analyzed a trypsinized Saccharomyces cerevisiae lysate with a splitless nanoLC system coupled to the TripleTOF. The instrument performance features including S. cerevisiae proteome coverage, biological depth, data acquisition rate, and spectral quality are reported.
Experimental
Saccharomyces cerevisiae Protein Preparation
A S. cerevisiae tryptic digest was completed as described previously by our group16 and is briefly summarized here. One cell culture of the Y15696 strain (EuroScarf, Frankfurt, Germany) was grown to exponential phase at 30°C. Cells were harvested and washed prior to lysis by flash freezing. Following reconstitution and centrifugation, the supernatant was collected.
A protein sample was denatured with fresh 8 M urea (Sigma-Aldrich) and reduced with dithiothreitol (DTT) (BioRad, Hercules, CA) in 50 mM Tris-HCl, pH 8.1 buffer to a final DTT concentration of 5 mM. The reduction reaction was completed in 30 min at 56°C. Carbamidomethylation was performed with iodoacetamide (Sigma-Aldrich) prepared in buffer such that the final concentration of the solution was 20 mM. Incubated for 30 min at RT in the dark, the reaction was then quenched with DTT prepared in buffer for 30 min. Urea was diluted to 2 M with buffer and digestion was initiated with trypsin (Sigma-Aldrich) continuing overnight at 37°C. The peptide solution was acidified, then aliquoted and dried in vacuo for storage at −20°C. Prior to LC-MS/MS interrogation, one digested sample was reconstituted in buffer (100 ng/μl) and used for all sample injections.
nanoLC Platform
A splitless Ultra 2D Plus (Eksigent, Dublin, CA) system was coupled to the TripleTOF with a cHiPLC Nanoflex microchip system for analytical separation The Nanoflex system uses replaceable microfluidic traps and columns packed with ChromXP C18 (3 μm, 120 Å) for online trapping, desalting, and analytical separations. Solvents were purchased from Sigma-Aldrich, and composed of water/acetonitrile/formic acid (A: 98/2/0.2%, B: 2/98/0.2%). 200 ng of sample was loaded, and trapping and desalting were carried out at 2 μL/min for 10 minutes with 100% mobile phase A. At a flow rate of 350 nl/min, analytical separation was established by maintaining 2% B for 5 min. In the following 2 min, 10% B was attained and a linear gradient to 40% B occurred in 60 min. Following the peptide elution window, in 1 min the gradient was increased to 90% B for 10 min. Initial chromatographic conditions were restored in 2 min and maintained for 5 min.
TripleTOF 5600 System
Data acquisition was performed with a TripleTOF 5600 System (AB SCIEX, Concord, ON) fitted with a Nanospray III source (AB SCIEX, Concord, ON) and a pulled quartz tip as the emitter (New Objectives, Woburn, MA). Data was acquired using an ion spray voltage of 2.2 kV, curtain gas of 20 PSI, nebulizer gas of 6 PSI, and an interface heater temperature of 150 °C. The MS was operated with a RP of 30,000FWHM for TOF-MS scans. For IDA, survey scans were acquired in 250 ms and as many as 8, 20, or 50 product ion scans were collected if exceeding a threshold of 125 counts per second (counts/s) and with a +2 to +5 charge-state. Four time bins were summed for each scan at a pulser frequency value of 11 kHz, through monitoring of the 40 GHz multichannel TDC detector with 4-anode/channel detection. A sweeping collision energy setting of 35 ± 15 eV was applied to all precursor ions for collision-induced dissociation. Dynamic exclusion was set for ½ of peak width (~8 s), and then the precursor is refreshed off of the exclusion list
Data Analysis
Data was processed with Protein Pilot Software v. 4.0 (AB SCIEX, Foster City, CA) utilizing the Paragon and Progroup Algorithm.17 The software converts the raw data (.wiff) into peak lists (.mgf), and for searching, does a re-calibration of the data; re-calibrating 20–25 ppm providing the global dataset a re-tune to < 2 ppm. The database employed was a concatenated target-reverse S. cerevisiae downloaded 12 April 2010 from Swiss-Prot with the trypsin sequence and common keratin contaminants included, and this afforded opportunity to employ the target-decoy database search strategy.18 In the software algorithm, all modifications listed in UniMod are searched simultaneous (http://www.unimod.org/) (see Table S-1 for a brief list)17, and the tolerances were specified as ±0.05 Da for peptides and ±0.05 Da for MS/MS fragments. The false discovery rate (FDR) analysis was also done using the integrated tools in ProteinPilot. The Protein Pilot generated .mgf files were also searched against the current S. cerevisiae SwissProt database using the Mascot Server v. 2.2. For the Mascot software, carbamidomethyl (C) was set as a fixed modification and deamidation (N and Q) and oxidation (M) were set as variable modifications. The maximum missed cleavage = 2, peptide tolerance = ±0.05 Da, and MS/MS tolerance = ±0.03 Da.
Results and Discussion
TripleTOF Major Technology Features
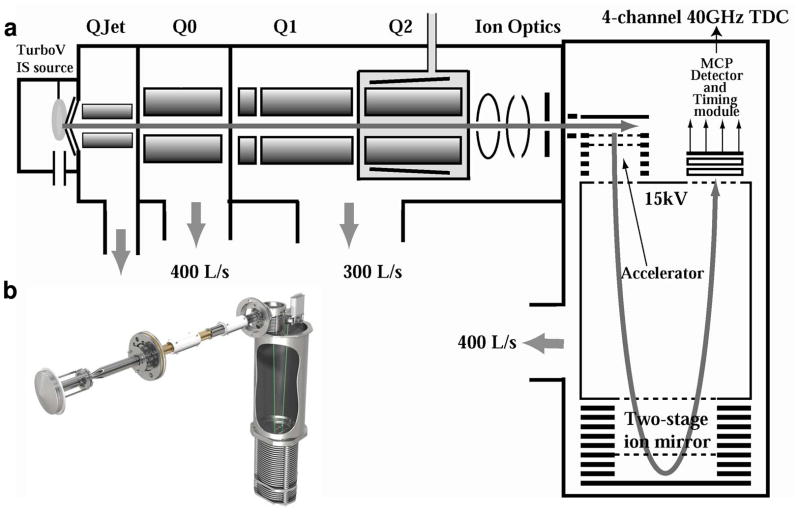
The TripleTOF (see Figure 1) integrates several features contributing to rapid and robust high performance analysis. The mass range in TOF MS and TOF MS/MS mode is from 5–40,000 m/z. In Q1, the precursor selection range is 5–1250 m/z, and directly coupled with the Accelerator TOF mass analyzer. Figure 1a models the TripleTOF and its constituents, and Figure 1b provides a 3-dimensional representation of the instrument. The TripleTOF offers advanced TOF entrance optics, 30 kHz accelerator/pulser, 15 kV TOF acceleration voltage, a two-stage reflector, 4-channel 40 GHz multichannel TDC detector, a flight path of approximately 2.5 m, and computer controlled polarity switching. The 40 GHz TDC technology provides ion signal handling every 25 ps (at both polarities), high resolution and mass accuracy across the full mass range, dynamic ion transmission control with novel gating technology to avoid detector saturation, and ≥ 4 orders of dynamic range in both MS and MS/MS scanning modes. These features contribute to RP of ≥ 35,000FWHM for the MS scan of m/z 956 and ≥ 25,000FWHM for the MS/MS scan of m/z 186, both with 10 ms accumulation time. Calibration processes contribute to the high MMA of resultant species. Internal calibration is held to 0.5 ppm RMS for the fragment ion [Glu]1-Fibrinopeptide B and external calibration is held to ≤ 2 ppm RMS for over 6 hr of LC-MS/MS run time. A variety of scan types afford the TripleTOF great functionality and include: full scan TOF MS and product ion scans with or without IDA, precursor ion scanning with full store MS/MSALL, neutral loss triggered IDA, mass defect triggered IDA, and multiple reaction monitoringHR.
Figure 1.
The TripleTOF MS technology features diagramed. a) A detailed illustration of the major platform features for rapid species interrogation. b) An image of the machined TripleTOF MS instrument platform.
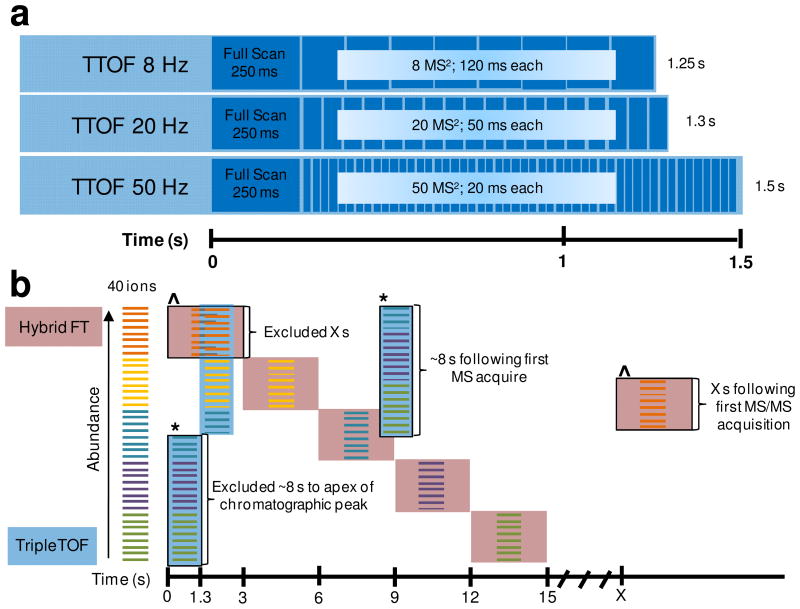
In demonstrating the performance of the TripleTOF, the full survey scan was fixed at 250 ms (see Figure 2a), which was empirically derived through a series of experiments to give the best results (unpublished data). Following the precursor scan, and through operation by IDA, the TripleTOF functions by selecting lower abundant ions for interrogation as set by the user defined intensity threshold (e.g. 125 counts/s) and demonstrated in Figure 2b (blue highlight). The reverse, or selection of the most abundant species first (red highlight in Figure 2b), is commonly performed by hybrid FT-based MS technology. Next, Q1 is set to select each precursor at ± 0.7 Da ranking from low to high m/z for MS/MS with full product ion detection at high resolution. The length of each MS/MS event is influenced by the number of events specified for analysis and these parameters are fixed as displayed in Figure 2a. The TripleTOF triggers MS/MS analysis of a species approximately twice, once when the species reaches the minimum threshold and it may be triggered for the second time when it approximately reaches the apex of the chromatographic peak (~8 s after the initial scan) (see Figure S-1 for acquisition redundancy).
Figure 2.
The sequence of events and IDA for the TripleTOF. a) The TripleTOF MS sequence of events per cycle for data acquisition with 8, 20, and 50 MS/MS events. b) Theoretical data acquisition demonstrating the most abundant to lesser abundant ion selection and vice versa of the analysis by FT-based MS platforms and the TripleTOF, respectively. 40 ions are present and listed in order of abundance, and for the sake of a less complex figure, suppose that for the TripleTOF the ions are arranged both by increasing abundance and increasing m/z. FT-based MS platforms (red highlight) may analyze ~8 ions per cycle (depending on the instrument) resulting in ~15 s to analyze all ions. The TripleTOF (blue highlight) analyzes the first 20 ions per cycle in this figure resulting in less than 3 s for complete analysis of all ions. Dynamic exclusion is also represented for each instrument platform; the ^ symbol tracks the ions initially analyzed by the FT-based MS platform and if still present in the measurement with sufficient abundance may be analyzed again X s later, the * symbol tracks the ions initially analyzed by the TripleTOF and if still present in the measurement with appropriate abundance may be analyzed again ~8 s at the apex of the chromatographic peak.
As a summary of the total cycle times and resultant data from triplicate analysis of trypsinized of S. cerevisiae by nanoLC-TripleTOF, Table 1 affords side-by-side evaluation. Although the TripleTOF is capable of operating at very high scan rates (up to 100 Hz), 20 MS/MS events provided a greater number of protein identifications for this global analysis, and Figure S-2 and S-3 describe the distribution (mass and m/z) of peptides confidently identified and the dynamic range of precursor signals detected. We performed analysis with 8 MS/MS events providing an avenue to compare to other instrument platforms. Recently, our group modified several parameters on our LTQ-Orbitrap XL which increased proteome coverage of the S. cerevisiae tryptic digest (200 ng) by approximately 60%.16 Comparing these results with the current study involving the TripleTOF employing near identical nanoLC platforms, MS/MS conditions (e.g., comparable precursor RP and # of MS/MS scans), and identical protein identification software and search settings; the TripleTOF identified approximately twice as many proteins and 3.1 fold more peptides.
Table 1.
Summary of TripleTOF Instrument Platform Features and Results
| # MS/MS cycles | MS/MS Accumulation Time | Total Cycle Time | # Protein IDs by Protein Pilot(1% FDR)* | # Protein IDs by Mascot (=≥20 score) | # Spectra Acquired | # Spectra Used | # Unique Peptides |
|---|---|---|---|---|---|---|---|
| 8 | 120 ms | 1.25 s | 914 | 764 | 65948 | 29817 | 8897 |
| 20 | 50 ms | 1.3 s | 1112 | 1132 | 89482 | 46705 | 13927 |
| 50 | 20 ms | 1.5 s | 1030 | 944 | 99137 | 51078 | 13048 |
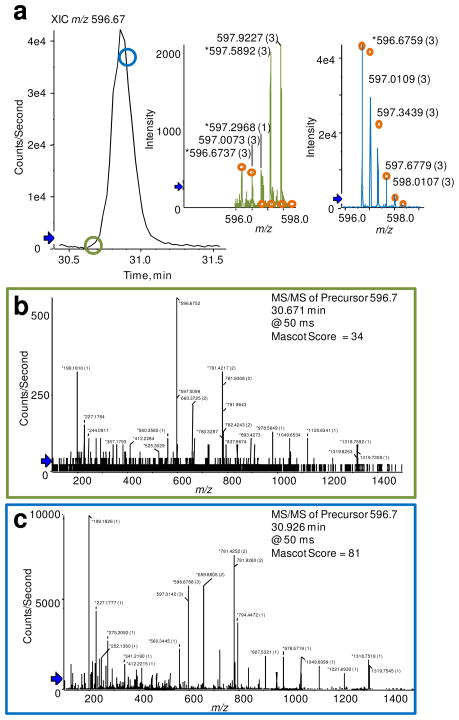
Although the TripleTOF does not integrate FT-based technology for sample detection, and consequently the MMA is less than FT-based instrument platforms (unpublished data), investigations assessing mass error statistics reveals RMS mass error of 1.78 ppm (0.0119 m/z). Furthermore, Figure 3 affords inspection of MS and MS/MS spectral quality for the peptide IINEPTAAAIAYGLDKK from the yeast protein HSP71_YEAST Heat Shock protein SSA1. The points circled on the extracted ion chromatogram (XIC) for m/z 596.67 in Figure 3a indicate the time at which the mass analyzer accumulated the ion for MS and MS/MS analysis. The inset in Figure 3a demonstrates the isotopic distribution of the precursor ion with the orange circles representing the theoretical isotopic distribution for the peptide. Due to single ion counting, and thus poorer counting statistics, the TripleTOF experimental isotopic distributions do not align well with the theoretical. Also, it must be noted that the data is a reconstructed trace that has been corrected for detector saturation and mass accuracy as described vide supra; however, for peptide identifications the isotopic distribution is not utilized in the search algorithms. Attributable to the high RP MS/MS, the product ion spectra in Figure 3b and c afford good quality fragmentation data with satisfactory Mascot scores. Furthermore, the TripleTOF selected the ion of interest for interrogation very near the beginning of the chromatographic peak from the XIC (when it reached the user defined minimum counts/s), and again near the apex of the chromatographic peak. While the second MS/MS interrogation provided a Mascot score of 81, the first Mascot score of 34 is also sufficient for identification of the peptide.
Figure 3.
Data acquisition output of the peptide IINEPTAAAIAYGLDKK from HSP71_YEAST Heat Shock protein SSA1 from the TripleTOF mass analyzer utilizing Peakview software. a) Displays the XIC of m/z 596.67, and the insets demonstrate the isotopic distribution of the 3+ charge-state ion corresponding to the circles on the XIC of which MS/MS acquisition was performed. The circle color matches that of the inset and MS/MS spectra obtained and illustrated in b) and c).
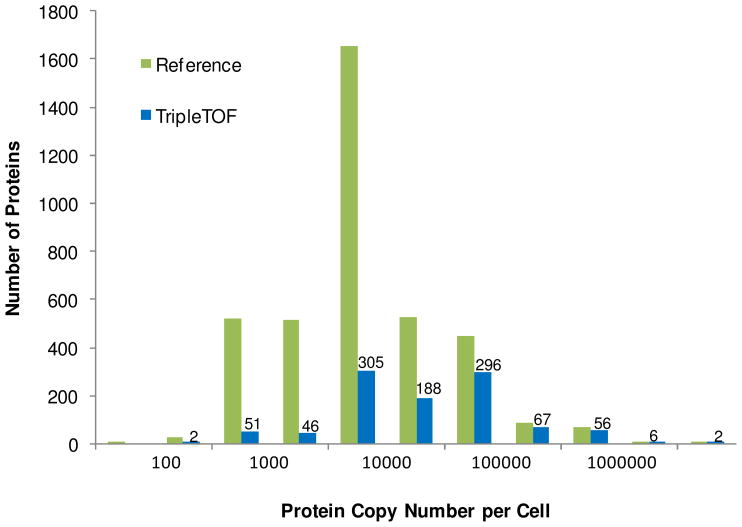
A comparison of the number of yeast proteins identified in this study (20 MS/MS method) with a previous report19 as a function of the protein copy number per cell (pc/c) is shown in Figure 4. The plot shows that proteins over the complete range (50- ≥1,000,000 pc/c) were identified by the TripleTOF with more proteins at 1,000–5,000 pc/c (305 proteins) identified than any other range; however, a very close second was 10,000–50,000 pc/c (296 proteins). It was anticipated that a greater number of lower abundant proteins would be identified by the TripleTOF due to fast MS/MS acquisition and re-prioritization of precursors selected for MS/MS (see Figure 2b). This trend was demonstrated by the Orbitrap Velos, with faster cycle times in comparison to the Orbitrap XL; more medium and low abundance proteins were identified with the Velos.20 Comparing the TripleTOF protein abundance data to proteins identified by the LTQ-Orbitrap in our previous work16, proteome depth penetration trended similarly (unpublished data).
Figure 4.
Identified proteins as a function of cellular expression demonstrated by Ghaemmaghami et al.19 The Reference (green) exhibits all S. cerevisiae pc/c data presented by Ghaemmaghami et al. while the blue bars are resultant data from triplicate analysis of the TripleTOF platform.
Another important aspect of the TripleTOF is the high RP and MMA MS/MS spectra achieved at 20 Hz (i.e., the duty cycle is not compromised) which theoretically should improve peptide searching confidence. The data from the 20 MS/MS method was filtered through differing MS/MS MMA tolerances (± 0.6 Da and ± 0.01 Da) and protein confidence windows (1%, 5%, and 10% FDR) to test this hypothesis. Figure S-4 exhibits the trends in protein numbers as a function of modifying search parameters. The reduction in the MS/MS tolerance window afforded additional protein identifications; this increase is attributable to the increased confidence in the high RP fragment ion data. However, it would be expected that reducing the tolerance window would increase the number of proteins more significantly if the key figure of merit resided in the RP of the TripleTOF. The speed of the TripleTOF is driving the number of peptides and proteins identified.
Conclusions
The TripleTOF combines high resolving power (30k) and mass accuracy (< 3 ppm) with high MS/MS spectral acquisition rates (20Hz) enabling a powerful LC-MS/MS discovery platform for complex mixtures. A more than two-fold improvement in protein identifications from a total yeast lysate digest was achieved versus an optimized LC-MS/MS study using FTMS-based technology.16 It is evidenced that the speed of the TripleTOF mass analyzer is the greatest factor for the large number of peptides and proteins identified and this influences the depth of research attainable with the TripleTOF. Brief comparisons to FT-based MS technologies reveal that the TripeTOF affords greater peptide and protein identifications in this global proteomic investigation of trypsinized S. cerevisiae. However, differences in the protein identifications and peptides sequenced suggest that to gain more exhaustive results, expanding the analysis to other instrument platforms, both LC and MS instrumentation, affording diversity in measurement detection, may be imperative to more completely analyze a complex proteomic sample.
Supplementary Material
Acknowledgments
We thank Ralph Dean’s group (Center for Integrated Fungal Research) for providing the yeast sample and Hunter Walker for helpful discussions. Additionally, we thank Vlad Zabrouskov for suggestion addition of biological depth to our investigation. We would also like to acknowledge the financial support of the National Institutes of Health (Grant 5T32GM00-8776-08 and 5 K25 CA128666-4), which supports GLA in the North Carolina State University Molecular Biotechnology Training Program and AMH, respectively, AB SCIEX, and the W. M. Keck Foundation.
References
- 1.Aebersold R, Mann M. Nature. 2003;422:198–207. doi: 10.1038/nature01511. [DOI] [PubMed] [Google Scholar]
- 2.Domon B, Aebersold R. Science. 2006;312:212–217. doi: 10.1126/science.1124619. [DOI] [PubMed] [Google Scholar]
- 3.Hunt DF, Shabanowitz J, Yates JR, Mciver RT, Hunter RL, Syka JEP, Amy J. Anal Chem. 1985;57:2728–2733. doi: 10.1021/ac00290a065. [DOI] [PubMed] [Google Scholar]
- 4.Hunt DF, Yates JR, Shabanowitz J, Winston S, Hauer CR. PNAS. 1986;83:6233–6237. doi: 10.1073/pnas.83.17.6233. [DOI] [PMC free article] [PubMed] [Google Scholar]
- 5.Syka JEP, Marto JA, Bai DL, Horning S, Senko MW, Schwartz JC, Ueberheide B, Garcia B, Busby S, Muratore T, Shabanowitz J, Hunt DF. J Proteome Res. 2004;3:621–626. doi: 10.1021/pr0499794. [DOI] [PubMed] [Google Scholar]
- 6.Olsen JV, de Godoy LMF, Li GQ, Macek B, Mortensen P, Pesch R, Makarov A, Lange O, Horning S, Mann M. Mol Cell Proteomics. 2005;4:2010–2021. doi: 10.1074/mcp.T500030-MCP200. [DOI] [PubMed] [Google Scholar]
- 7.Stephens WE. Phys Rev. 1946;69:691–691. [Google Scholar]
- 8.Wiley WC, Mclaren IH. Rev Sci Instr. 1955;26:1150–1157. [Google Scholar]
- 9.Campana JE. Anal Instrum. 1987;16:1–14. [Google Scholar]
- 10.Clauser KR, Baker P, Burlingame AL. Anal Chem. 1999;71:2871–2882. doi: 10.1021/ac9810516. [DOI] [PubMed] [Google Scholar]
- 11.Chernushevich IV, Ens W, Standing KG. Fundamentals, Instrumentation & Applications. John Wiley & Sons; New York: 1997. [Google Scholar]
- 12.Chernushevich IV, Loboda AV, Thomson BA. J Mass Spectrom. 2001;36:849–865. doi: 10.1002/jms.207. [DOI] [PubMed] [Google Scholar]
- 13.Guilhaus M, Selby D, Mlynski V. Mass Spectrom Rev. 2000;19:65–107. doi: 10.1002/(SICI)1098-2787(2000)19:2<65::AID-MAS1>3.0.CO;2-E. [DOI] [PubMed] [Google Scholar]
- 14.Shevchenko A, Chernushevich I, Ens W, Standing KG, Thomson B, Wilm M, Mann M. Rapid Commun Mass Spectrom. 1997;11:1015–1024. doi: 10.1002/(SICI)1097-0231(19970615)11:9<1015::AID-RCM958>3.0.CO;2-H. [DOI] [PubMed] [Google Scholar]
- 15.Muddiman DC, Nicola AJ, Proctor A, Hercules DM. Appl Spectrosc. 1996;50:161–166. [Google Scholar]
- 16.Andrews GL, Dean RA, Hawkridge AM, Muddiman DC. J Am Soc Mass Spectrom. 2011;22:773–783. doi: 10.1007/s13361-011-0075-2. [DOI] [PMC free article] [PubMed] [Google Scholar]
- 17.Shilov IV, Seymour SL, Patel AA, Loboda A, Tang WH, Keating SP, Hunter CL, Nuwaysir LM, Schaeffer DA. Mol Cell Proteomics. 2007;6:1638–1655. doi: 10.1074/mcp.T600050-MCP200. [DOI] [PubMed] [Google Scholar]
- 18.Elias JE, Gygi SP. Nat Methods. 2007;4:207–214. doi: 10.1038/nmeth1019. [DOI] [PubMed] [Google Scholar]
- 19.Ghaemmaghami S, Huh W, Bower K, Howson RW, Belle A, Dephoure N, O’Shea EK, Weissman JS. Nature. 2003;425:737–741. doi: 10.1038/nature02046. [DOI] [PubMed] [Google Scholar]
- 20.Second TP, Blethrow JD, Schwartz JC, Merrihew GE, MacCoss MJ, Swaney DL, Russell JD, Coon JJ, Zabrouskov V. Anal Chem. 2009;81:7757–7765. doi: 10.1021/ac901278y. [DOI] [PMC free article] [PubMed] [Google Scholar]
Associated Data
This section collects any data citations, data availability statements, or supplementary materials included in this article.


