Abstract
The integration of near-infrared (NIR) and functional MRI (fMRI) studies is potentially a powerful method to investigate the physiological mechanism of human cerebral activity. However, current NIR methodologies do not provide adequate accuracy of localization and are not fully integrated with MRI in the sense of mutual enhancement of the two imaging modalities. Results are presented to address these issues by developing an MRI-compatible optical probe and using diffuse optical tomography for optical image reconstruction. We have developed a complete methodology that seamlessly integrates NIR tomography with fMRI data acquisition. In this paper, we apply this methodology to determine both hemodynamic and early neuronal responses in the visual cortex in humans. Early results indicate that the changes in deoxyhemoglobin concentration from optical data are co-localized with fMRI BOLD signal changes, but changes in oxyhemoglobin concentration (not measurable using fMRI) show interesting spatial differences.
Keywords: near-infrared, diffuse optical tomography, fMRI, functional imaging, human brain, visual cortex, hemodynamic response, neuronal response
1. INTRODUCTION
Simultaneous near-infrared (NIR) and functional MRI (fMRI) studies have been shown to provide information regarding the physiological mechanism of cerebral activity1–6. NIR spectroscopy (NIRS) is superior in investigating cortical hemodynamics with chemical specificity as a means of direct measurement of changes in oxy- and deoxyhemoglobin concentrations. On the other hand, fMRI studies on the blood oxygenation-level dependent (BOLD) signal reveal indirect information regarding blood flow and deoxyhemoglobin concentration with high spatial resolution over the entire brain. However, current strategies for optically-based techniques and data analysis are primarily based on spectroscopic measurements, which fundamentally limits the spatial resolution to a value comparable to the representative source-detector distance (on the order of centimeters)7.
The methodology that integrates NIR tomography with fMRI includes (i) the design and construction of an MRI-compatible optical probe that can be attached to the human visual cortex (as well as any other positions on the head) inside a standard MRI birdcage head-coil and does not introduce significant MR image distortion, (ii) algorithms that determine the positions of the optodes from MR images so that optical and fMRI data can be co-registered, and (iii) the reconstruction of optical image based on a perturbation approach and Monte Carlo simulations8 of light transport in the realistic head phantom derived from anatomical MR image. This methodology is described in another submission to this volume. In this paper, we apply our new methodology to study hemodynamic and neuronal responses to functional stimulation in the human visual cortex.
2. METHODS
2.1 Experiment
NIR and fMRI signals are measured simultaneously on the human visual cortex during the experiment. The measured optical is transparent to the fMRI study, and vice-versa. In addition, with virtually no adjustment to hardware and software, the same methodology can be readily applied for studying any other cortical areas that are accessible for traditional NIRS methods.
The optical probe is attached to the back of the head and aligned with the primary visual cortex, as shown in Figure 1. Nonmagnetic goggles for producing the visual stimulus are fixed in front of the subject’s eyes inside the birdcage MR coil. The subject’s vision is corrected if necessary by inserting lenses into the goggles. The paradigm of visual stimulation consists of 4 blocks, each of which is a 28.8-second fixation followed by a 19.2-second reversing black-and-white checkerboard pattern. The frequencies of the checkerboard pattern reversals are 1, 2, 4, and 6 Hz. The fMRI signal is recorded using a 3-Tesla MRI scanner (Allegra, Siemens). A standard gradient-echo echo-planar imaging (EPI) pulse sequence is used (FOV 240×240 mm2, resolution 64×64, voxel size 3.75×3.75×4.00 mm3, gap 0.4 mm, θ= 60°, TE = 25 ms, and TR = 2000 ms). A T2-weighted 3-D anatomical image of the same imaging volume is acquired for co-registration of the fMRI with anatomical images. A T1-weighted high-resolution 3-D spin-echo image (voxel size 0.50×0.50×1.0 mm3) of the volume including the optical probe is acquired for automatic recovery of the positions of the optical sources and detectors (optodes). Finally, another T1-weighted high-resolution 3-D full-head anatomical image (MPRAGE, voxel size 0.94×0.94×1.20 mm3) is taken to produce the head model for optical image reconstruction and serves as the basis of optical/fMRI image co-registration.
Figure 1.
(a) Placement of the optical probe on the head inside the “birdcage” head coil of the MRI scanner; and (b) schematic of the optical probe.
The optical signal is recorded by the NIR spectrometer (Imagent, ISS) and is synchronized with the fMRI study and visual stimulation by the trigger signal from the MRI scanner. The optical sources are laser diodes (690 and 830 nm) which are amplitude modulated at 150 MHz and time-multiplexed. Photons reaching the optical detectors are amplified by the photomultiplier tubes (PMT) and consequently converted into AC, DC, and phase signals for each of the source-detector combinations, or channels, at both wavelengths.
Constraints imposed by fMRI required rigorous optical probe design and optical fiber preparation. Due to the strong static magnetic (B0) fields and RF pulses (B1 field) generated, the design of the optical probe should be completely metal-free. The physical structure of the MRI scanner imposes another important constraint on the design of the optical probe for studying the visual cortex. As illustrated in Figure 1(a), the optical probe has to be positioned within fairly limited space between the back of the head and the inner wall of the head-coil; optical fibers have to be placed in parallel with the long axis of the birdcage head coil, i.e. the B0 field of the MRI scanner.
In order to maintain homogeneity of the B0 field the optical fibers were “ferruled” using plastic tubing instead of stainless steel. The frame of the optical probe was made of the rubber (polyurethane, 70A durometer, FDA approved, McMaster-Carr) that produced the least amount of visible artifact in MR images among those with appropriate mechanical characteristics, which, from the structural point of view, is robust enough to maintain its structure yet flexible enough to fit the shape of the head and provide good contact. The topology of the optodes was designed such that the optical channels overlap and the distribution of source-detector distances evenly covers the optimal range9 ranging approximately from 20 to 30 mm, as shown in Figure 1(b). The optodes consist of 16 pairs of 400-μm-diameter core plastic clad multimode silica source fibers (FT-400-EMT, Thorlabs) and 4 detector fiber bundles (Fiberoptics Technology). The height of the optical probe can be reliably kept within 15–20 mm. A specially designed head pad ensures that the probe can be comfortably placed between the back of the head and the bottom of the birdcage head coil. An MRI visible marker is attached adjacent to each of the 16 sources and to the middle of the 4 detectors so that accurate positions of the optodes can be recovered from MRI images.
2.2 Data analysis
MR images are processed to identify the MRI markers on the optical probe, which are subsequently used to correct the deformation of the optical probe. As a result, the exact positions of the optodes can be recovered. The 3-D anatomical full-head MR image (MPRAGE) is segmented into 4 types of tissues, namely scalp-skull, cerebrospinal fluid (CSF), white matter, and gray matter. The segmented head phantom is used to produce the head model. Based on the positions of optodes and the structure of the head model, the forward problem of optical image reconstruction under baseline condition (without activation) is solved using Monte Carlo simulations, which in turn determine the integral kernel of the perturbation (Born approximation) equation. The inverse problem is solved using SIRT from the optical signal. The baseline optical properties used for Monte Carlo simulations are listed in Table 1.
Table 1.
Optical Properties used for Monte Carlo Simulations
| Tissue | μa (mm−1) | μs (mm−1) | G | n |
|---|---|---|---|---|
| Scalp and skull | 0.014 | 0.860 | 0 | 1.4 |
| Cerebrospinal Fluid | 0.004 | 0.100 | 0 | 1.4 |
| Gray Matter | 0.010 | 1.110 | 0 | 1.4 |
| White Matter | 0.010 | 1.110 | 0 | 1.4 |
Structural and physiological a priori knowledge is applied to reduce the number of unknowns in image reconstruction and for image registration. From the anatomical MR image (MPRAGE), the brain tissue can be used as a spatial constraint to the solution. Another spatial constraint to the solution is via the estimation of the optical sensitivity region, which consists of voxels with significant contributions to the optical signal. Two different methods were used to estimate such a sensitivity region. The first method is to threshold the integral kernel of the perturbation equation, i.e. to threshold the probability that photons pass through voxels. A value of 0.01 was used in this paper. In addition, for each voxel, its time-series values are compared with the paradigm of the visual stimulation with a 6 s delay. Voxels that have a correlation coefficient higher than a threshold value (±0.5 used in this paper) are considered as being activated. This also allows the possibility that voxels have negative activation. The other method is to find voxels that produce signal with magnitudes greater than the noise level of the optical signal of all channels/measurements. In other words, the forward problem is solved for each voxel (an activation of 5% from the baseline value was used in this paper); the result (estimated optical signal due to the activation from that particular voxel) is compared with the normalized noise level to determine if this channel/measurement is sensitive to that particular voxel. Finally, the magnitude of activation in both methods is determined by averaging over the whole time period of visual stimulation, but delayed by 6 seconds to represent the hemodynamic response.
The above procedure of image reconstruction is applied to the optical signals obtained at 830 and 690 nm and produces the changes in absorption coefficient at both wavelengths. These changes are consequently converted into changes in the oxy- and deoxyhemoglobin concentrations, i.e. Δ[HbO2] and Δ [Hb], respectively.
The event-related optical signal (EROS10) associated with checkerboard pattern reversal was obtained from the phase of the frequency-domain optical signal. For each source-detector channel and each condition (checkerboard reversing frequency) the data were averaged over all trials and eight subjects. The early neuronal signal was mapped using simple backprojection.
3. RESULTS AND DISCUSSION
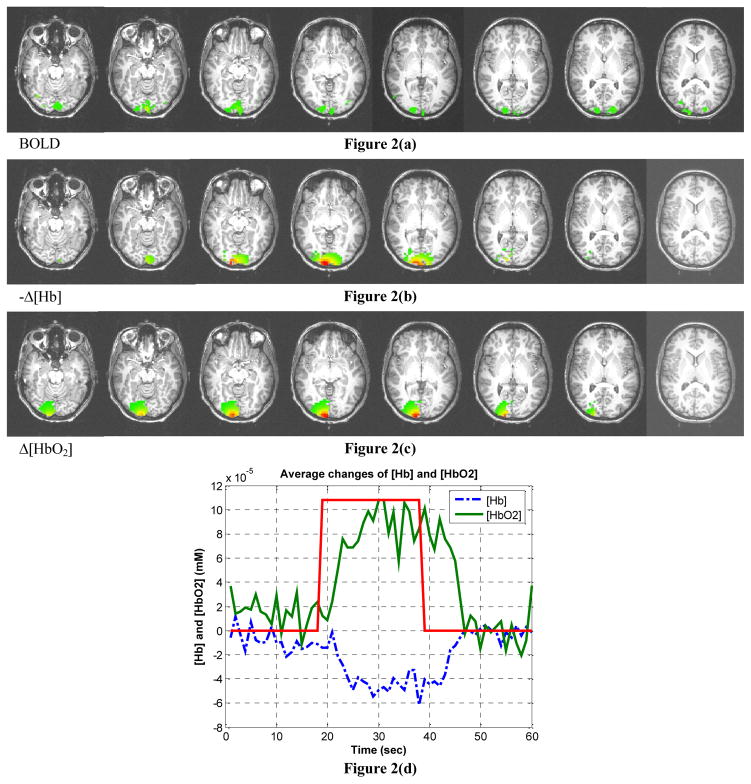
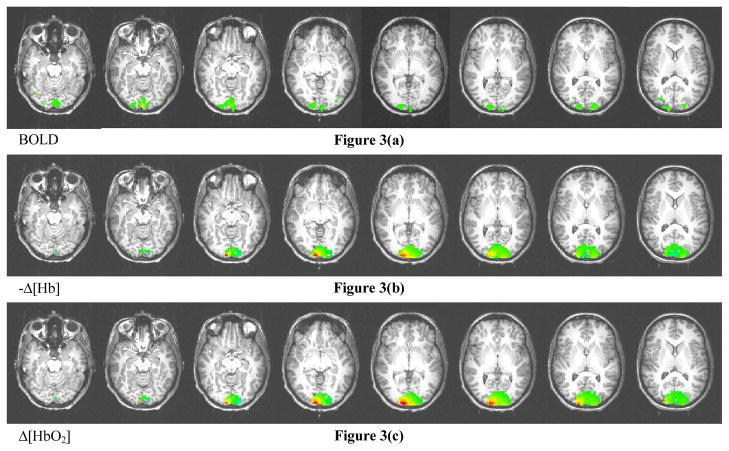
The hemodynamic result presented in this paper was obtained from a single subject and were averaged over 4 measurements at a visual stimulation rate of 2 Hz. The hemodynamic response (changes of oxy- and deoxyhemoglobin concentration, i.e., Δ[HbO2] and Δ[Hb]) of activated voxels identified using the first method (thresholding the integral kernel and correlation coefficient) is shown in Figure 2. The time-series signals of Δ[HbO2] and Δ[Hb] averaged over activated voxels, which are determined using the first method, are shown in Figure 2(d). The result using the second thresholding method is shown Figure 3. Also shown is the BOLD signal from the fMRI study.
Figure 2.
Image reconstruction results using threshold and correlation analysis to identify activation. (a) BOLD fMRI signal, (b) changes of deoxy- and (c) oxyhemoglobin concentration obtained from diffuse optical tomography. (d) The time-series signal of Δ [Hb] and Δ[HbO2] averaged over all activated voxels. Note that (b) shows the negative of Δ[Hb].
Figure 3.
Image reconstruction results using thresholding according to the noise level of the optical signal. (a) BOLD fMRI signal, (b) changes of deoxy- and (c) oxyhemoglobin concentration obtained from diffuse optical tomography. Note that (b) shows the negative of Δ[Hb].
The activation patterns of Δ[Hb] shown in Figure 2(b) and 3(b) are consistent with the pattern of the BOLD signal. Nonetheless, as shown in Figure 2(c) and 3(c), the images of Δ[HbO2] demonstrate similar yet slightly different patterns. Note that the red spots represent regions with large changes of hemoglobin concentration. In Figure 2(d), the hemodynamic response in the time-series indicates an increased total hemoglobin concentration. One can see that it shows an increment of cerebral blood volume (CBV) during physiological activation. Note that the plotted hemodynamic response is averaged over all activated voxels, and that its maximum values are approximately 4 times as large as the values averaged over all voxels. No significant negative activations are observed from the experimental data in this particular subject. It should also be noted that the baseline values of the optical properties used for the Monte Carlo simulations were not measured in situ. However, as our simulations have suggested, the optical image reconstruction methodology is very robust with respect to differences in baseline optical properties (especially the absorption coefficient). More accurate baseline optical properties could be determined by incorporating in vivo optical property measurement11 into the procedure. On the other hand, if the values of the baseline optical properties do not substantially deviate from the correct values, and stay within the range where the Born approximation is still valid, such biased optical properties can be regarded to constitute a virtual baseline In other words, such systematic error can be easily eliminated by forcing the actual baseline to be zero.
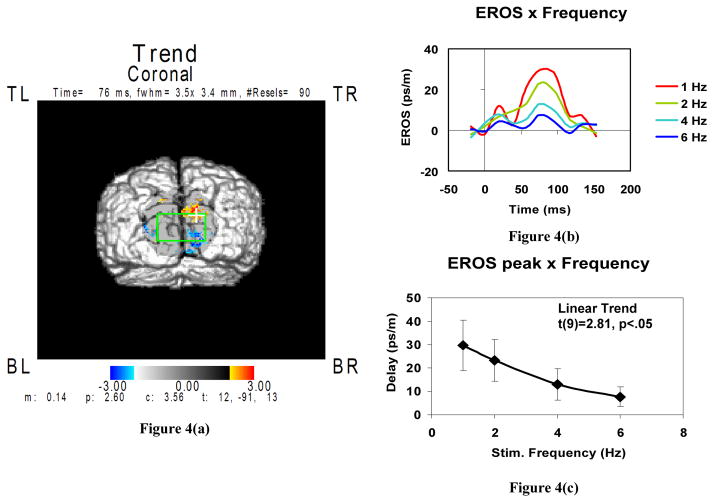
Figure 4 shows cross-subject averaged results of EROS analysis. In Figure 4(a) areas exhibiting positive and negative changes in the refraction index are plotted in red and blue, respectively. The location of the maximum of activity in the right side of the primary visual cortex agrees with the results of previous fMRI studies. As Figures 4(b) and (c) show, the EROS magnitude reduces with an increase in the checkerboard reversal frequency.
Figure 4.
Averaged results of the EROS analysis in eight subjects: (a) backprojection image showing positive (red) and negative (blue) changes in the reduced scattering coefficient; (b) time courses of changes in the speed of light (proportional to that of the scattering coefficient) for different checkerboard reversing frequencies; (c) EROS peak amplitude versus checkerboard reversing frequency.
4. CONCLUSION
We have successfully verified that our new methodology allows integration of fMRI, hemodynamic, and event-related neuronal signal measurement in humans. The capability of such simultaneous neuroimaging data collection promises significant advancement in understanding physiological mechanisms of brain function. Our early results indicate that the changes in the deoxyhemoglobin concentration from the optical data are co-localized with fMRI BOLD signal changes, but changes in the oxyhemoglobin concentration (not measurable using fMRI) show interesting spatial differences. We have found that the neuronal response to repetitive visual stimulation is strongly dependent on the frequency of the stimulus. In future we plan to implement an inverse reconstruction procedure for scattering changes similar to the one we are using for the absorption changes. This procedure will provide a 3D localization of neuronal signals.
References
- 1.Strangman G, Culver JP, Thompson JH, Boas DA. A quantitative comparison of simultaneous BOLD fMRI and NIRS recording during functional brain activation. Neuroimage. 2002;17:719–731. [PubMed] [Google Scholar]
- 2.Toronov V, Walker Scott, Gupta R, CHoi JH, Gratton E, Hueber D, Webb AG. The roles of changes in deoxyhemoglobin concentration and regional cerebral blood volume in the fMRI BOLD signal. Neuroimage. 2003;19:1521–1531. doi: 10.1016/s1053-8119(03)00152-6. [DOI] [PubMed] [Google Scholar]
- 3.Okamoto M, Dan H, Shimizu K, Takeo K, Amita T, Oda I, Konishi I, Sakamoto K, Isobe S, Suzuki T, Kohyama K, Dan I. Multimodal assessment of cortical activation during apple peeling by NIRS and fMRI. Neuroimage. 2004;21:1275–1288. doi: 10.1016/j.neuroimage.2003.12.003. [DOI] [PubMed] [Google Scholar]
- 4.McGowan JC, Wallace SK. Synergy of a combined near-infrared spectroscopy and blood oxygenation level dependent functional activation study. American Journal of Neuroradiology. 2004;25:1127–1128. [PMC free article] [PubMed] [Google Scholar]
- 5.Chen Y, Tailor DR, Intes X, Chance B. Correlation between near-infrared spectroscopy and magnetic resonance imaging of rat brain oxygenation modulation. Physics in Medicine and Biology. 2003;48:417–427. doi: 10.1088/0031-9155/48/4/301. [DOI] [PubMed] [Google Scholar]
- 6.Siegel AM, Culver JP, Mandeville JB, Boas DA. Temporal comparison of functional brain imaging with diffuse optical tomography and fMRI during rat forepaw stimulation. Physics in Medicine and Biology. 2003;48:1391–1403. doi: 10.1088/0031-9155/48/10/311. [DOI] [PubMed] [Google Scholar]
- 7.Boas DA, Dale AM, Franceschini MA. Diffuse optical imaging of brain activation: approaches to optimizing image sensitivity, resolution, and accuracy. Neuroimage. 2004;23:S275–S288. doi: 10.1016/j.neuroimage.2004.07.011. [DOI] [PubMed] [Google Scholar]
- 8.Boas DA, Culver JP, Stott JJ, Dunn AK. Three dimensional Monte Carlo code for photon migration through complex heterogeneous media including the adult human head. Optical Express. 2001;10:159–170. doi: 10.1364/oe.10.000159. [DOI] [PubMed] [Google Scholar]
- 9.Toronov V, D’Amico E, Hueber D, Gratton E, Barbier B, Webb AG. Optimization of the signal-to-noise ratio of frequency-domain instrumentation for near-infrared spectro-imaging of the human brain. Optics Express. 2003;11:2717–2729. doi: 10.1364/oe.11.002717. [DOI] [PubMed] [Google Scholar]
- 10.Gratton G, Fabiani M. The event-related optical signal (EROS) in visual cortex: replicability, consistency, localization, and resolution. Psychophysiology. 2003;40:561–71. doi: 10.1111/1469-8986.00058. [DOI] [PubMed] [Google Scholar]
- 11.Choi J, Wolf M, Toronov V, Wolf U, Polzonetti C, Hueber D, Safonova L, Gupta R, Michalos A, Mantulin W, Gratton E. Noninvasive determination of the optical properties of adult brain: Near-infrared spectroscopy approach. Journal of Biomedical Optics. 2004;9:221–229. doi: 10.1117/1.1628242. [DOI] [PubMed] [Google Scholar]


