Abstract
To adhere and migrate, cells generate forces through the cytoskeleton that are transmitted to the surrounding matrix. While cellular force generation has been studied on 2D substrates, less is known about cytoskeletal-mediated traction forces of cells embedded in more in vivo-like 3D matrices. Recent studies have revealed important differences between the cytoskeletal structure, adhesion, and migration of cells in 2D and 3D. Because the cytoskeleton mediates force, we sought to directly compare the role of the cytoskeleton in modulating cell force in 2D and 3D. MDA-MB-231 cells were treated with agents that perturbed actin, microtubules, or myosin, and analyzed for changes in cytoskeletal organization and force generation in both 2D and 3D. To quantify traction stresses in 2D, Traction Force Microscopy was used; in 3D, force was assessed based on single cell-mediated collagen fibril reorganization imaged using Confocal Reflectance Microscopy. Interestingly, even though previous studies have observed differences in cell behaviors like migration in 2D and 3D, our data indicate that forces generated on 2D substrates correlate with forces within 3D matrices. Disruption of actin, myosin or microtubules in either 2D or 3D microenvironments disrupts cell-generated force. These data suggest that despite differences in cytoskeletal organization in 2D and 3D, actin, microtubules and myosin contribute to contractility and matrix reorganization similarly in both microenvironments.
Keywords: cytoskeleton, ECM remodeling, traction forces, 3D, collagen
1. Introduction
Cellular traction forces mediate a variety of complex responses including adhesion, migration, and extracellular matrix (ECM) remodeling [1,2]. While much is known about cellular contractility and traction forces of cells in 2D, force generation in more physiologically-relevant 3D environments has not been well characterized. In 2D, traction forces largely result from the interactions of the actomyosin cytoskeleton within the cell, where actin stress fibers are tensed by myosin motors that generate contractility and allow cells to exert forces on the extracellular environment [3,4]. In addition to actomyosin interactions, microtubules (MTs) also play a role in mediating cellular contractility and force generation [5,6]. It has been shown that disruptions in MT polymerization alter cellular contraction and the organization of cytoplasmic actin [7], and myosin activity [8]. These data indicate that the actomyosin and MT cytoskeleton are involved in crosstalk that dynamically regulates cellular behaviors including contractility and traction force generation in 2D. However, the role of the cytoskeleton in force generation in cells embedded in 3D matrices is not well understood.
In vivo, most cells reside in a complex 3D microenvironment, and direct comparisons between 2D and 3D microenvironments have revealed important differences in cell-matrix adhesions and cytoskeletal organization [9]. These differences alter key cell responses in 2D and 3D, including morphology, migration, and proliferation [10-12]. Specifically, compared to their 2D counterparts, cell-matrix adhesions in 3D differ in structure, localization, and function [11]. Additionally, in contrast to 2D substrates, where actin bundling is prominent, cells in 3D exhibit a dramatic change in cell morphology and a reduction in actin fiber bundling that is relegated to the lateral borders of cell extensions [13]. Interestingly, while some studies have shown that cells such as fibroblasts have increased motility in 3D [11], recent work has shown that differences in 2D and 3D motility may be cell-type specific, and that focal adhesion proteins differentially regulate motility in 2D and 3D [12]. While these data indicate that there are significant differences in some cell responses in 2D and 3D, the specific relationship between cellular forces and contractility in 2D and 3D is not well established.
The primary limitation in investigating cellular contractility in a 3D microenvironment is the lack of tools available to make this measurement. Multiple platforms exist for 2D force measurements, including Traction Force Microscopy, a technique used by our own lab [14,15]. However, few methods exist to directly measure the forces exerted by cells embedded in 3D matrices, although this is a burgeoning area of research [16]. Here, to address this limitation and to characterize forces generation of cells embedded in 3D matrices, we used Confocal Reflectance Microscopy to image the rearrangement of collagen fibrils by single cells and we quantified this ECM reorganization using an exponential decay model as an indirect measure of single cell force. Additionally, we used whole collagen contraction as a metric of collective forces by a cell population.
The goal of this study was to elucidate the role of the cytoskeleton in modulating contractility and traction force generation in 2D and 3D microenvironments. MDA-MB-231 highly metastatic breast cancer cells were treated with pharmacological agents that perturbed actin, MTs, or myosin, and were analyzed for differences in 2D and 3D in the organization of the actin and microtubule cytoskeleton, cellular contractility, and ECM remodeling. While there are clear differences in the cytoskeletal structure of cells in 2D as compared to 3D, disruption of the cytoskeleton had similar effects on force generation. These data indicate that cells may use similar cytoskeletal-based force generating mechanisms in both 2D and 3D.
2. Materials and Methods
2.1 Cell Culture and Reagents
MDA-MB-231 highly metastatic breast adenocarcinoma cells (American Type Culture Collection, Rockville, MD, HTB-26) were maintained at 37°C and 5% CO2 in Minimum Essential Medium (Invitrogen, Carlsbad, CA) supplemented with 10% fetal bovine serum and 1% penicillin-streptomycin (Invitrogen).
Cytochalasin D, paclitaxel, nocodazole, blebbistatin, and calyculin A were purchased from Sigma-Aldrich (St. Louis, MO). All pharmacological agents were solubilized in dimethyl sulfoxide (DMSO, Sigma-Aldrich) and used at the concentrations listed in Table 1. The concentrations and treatment duration times were chosen based on common values found in the literature as listed in the table references.
Table 1.
Cytoskeletal effectors used in this study, with their respective treatment concentrations, duration of treatment in 2D, and established effects
| Agent | Duration | Concentration | Cytoskeletal Effect |
|---|---|---|---|
| Cytochalasin D (CD) | 30 min | 5 μM | Depolymerizes actin [27] |
| Nocodazole (Noco) | 5 min | 10 μM | Depolymerizes microtubules [28,29] |
| Paclitaxel (Ptx) | 24 h | 20 nM | Stabilizes microtubules [30,31] |
| Blebbistatin (Bleb) | 30 min | 50 μM | Disrupts actin-myosin interaction [2,28,29] |
| Calyculin A (CLA) | 30 min | 1 nM | Augments myosin II activity [2,28,29] |
2.2 Polyacrylamide Gel Synthesis and 2D Cell Seeding
All 2D experiments were performed on polyacrylamide (PA) gel substrates with a Young’s Modulus (E) of 5 kPa to mimic physiological breast tumor stiffness [17]. Polyacrylamide gel substrates were prepared using a polymerization solution with a constant ratio of 0.175% (v/v) bis-acrylamide to 7.5% (v/v) acrylamide as previously described [14]. Gel surfaces were functionalized using N-6-((acryloyl)amido)hexanoic acid, synthesized in our lab [18] and subsequently bound to type I collagen at an applied concentration of 0.1 mg/mL (Becton Dickinson, Franklin Lakes, NJ) as described previously [1,18].
Cells were seeded sparsely to minimize cell-cell interactions, and allowed to adhere to polyacrylamide gels for 10 hours. Pharmacological agents were administered to the cells by replacing the cell media with fresh medium containing the agent of interest. Concentrations and incubation times were chosen based on effective values found in the literature (table 1). Control cells were treated with a 1:1000 dilution of DMSO for 30 minutes.
2.3 Phase Imaging
Cells were imaged in a temperature, humidity, and CO2- controlled stage of a Zeiss Axio Observer Z1m inverted phase contrast microscope with a Hamamatsu ORCA-ER camera. Phase images were analyzed using ImageJ (version 1.42q) [19]. Isolated cells were outlined and circularity was measured for each condition (n ≥ 78). Circularity (shape index) is defined as (4πArea / Perimeter2), where a circle has a value of 1, and a straight line has a value of 0 [20].
2.4 Fluorescent Staining of Actin and Microtubules
Cells on 2D polyacrylamide gels and in 3D collagen matrices were fixed with 3.7% (v/v) formaldehyde in PBS and permeabilized with 1% (v/v) Triton (JT Baker) in PBS. Samples were blocked with PBS/0.02% (v/v) Tween (JT Baker) with 3% (w/v) bovine serum albumin (BSA, Sigma-Aldrich) and incubated 1:50 with a monoclonal anti-alpha-tubulin primary antibody (Santa Cruz Biotechnology Inc., Santa Cruz, CA) in PBS/1% (w/v) BSA. Gels were incubated with an Alexa Fluor 488-conjugated secondary antibody (Santa Cruz) in PBS/1% (w/v) BSA (1:200) and with Alexa Fluor 594-conjugated phalloidin (Invitrogen) in PBS (1:20) to localize filamentous actin. Nuclei were stained with 4′,6-diamidino-2-phenylindole (DAPI, Sigma-Aldrich) diluted 1:50 in purified deionized water. Simultaneous fluorescence and reflectance confocal microscopy was performed on a Zeiss 710 Confocal Microscope and images were pseudo-colored with Zen software (v. 2009, Carl Zeiss, Germany). For confocal reflectance microscopy imaging of collagen fibrils, samples were illuminated through an 80/20 dichroic mirror with 488 nm laser light, which was reflected off of collagen fibrils and detected by a photomultiplier tube through a 488 nm emission filter.
2.5 Actin and MT Intensity Analysis
Quantification of fluorescent images for actin and MTs was performed on images acquired at the same exposure settings between treatments. Individual cells were outlined using ImageJ software, and integrated densities were measured. Integrated densities were background-subtracted and averaged for each treatment condition. Average integrated densities were normalized to control values and reported as arbitrary units.
2.6 Traction Force Microscopy
Cells were plated on polyacrylamide gels (E = 5kPa) embedded with 0.5 μm fluorescent beads (Invitrogen) and allowed to adhere for 10 hours. Pharmacological agents were applied at the concentration and duration listed in Table 1. The magnitude and orientation of cellular traction stresses were determined by tracking displacements of fluorescent beads within the gel substrate created by a cell. Cells were then imaged in phase and fluorescence as previously described (n = 17-84). Bead distributions were imaged before and after removal of the cell with trypsin (Invitrogen). The bead displacements were converted into a strain field and traction stresses were calculated using the LIBTRC analysis library developed by Professor Micah Dembo of Boston University, who also invented the basic theory that underlies TFM [21]. Images were processed with LIBTRC software to determine the cellular traction vectors, T, the total magnitude of the force, |F|, and the projected cell area. |F| is an integral of the traction field over the entire area of the cell, , where is the continuous field of local traction vectors defined at local spatial coordinates (x,y) in the projected cell area [14]. Traction stress projections along the long and short axes of the cell were computed in LIBTRC by taking the integral of the absolute value of the traction magnitudes dotted with a unit vector directed along the long axis of the cell or a unit vector perpendicular to this, along the short axis.
2.7 Collagen Matrix Synthesis for Gel Contraction Assay and 3D Confocal Imaging
Collagen type I gels with a final collagen concentration of 1.5 mg/mL were used for gel contraction and 3D single-cell studies. Type I collagen was isolated from rat tails and reconstituted in 0.1% acetic acid at 10 mg/mL [22]. After neutralization with 1N NaOH, the appropriate volume of MDA-MB-231 cell suspension was gently mixed into the collagen solution. To minimize cell-cell interactions and enable confocal analysis in single-cell studies, 200 μL gels seeded at 150,000 cells/mL were cultured in 10 mm glass bottom Petri dishes (MatTek, Ashland, MA). For gel contraction measurements, 500 μL gels seeded at 550,000 cells/mL were cultured in 24-well plates. Collagen solution was placed into culture wells pre-blocked with 1% (w/v) BSA and allowed to polymerize at 37°C and 5% CO2 for 1 hour. 500 μL of media was added and gels were released from the sides of the well. After 4 additional hours of culture, 500 μL of media containing pharmacological agents were added. 4 hours was chosen to allow the cells to adhere and begin to spread, while minimizing collagen reorganization prior to treatment. After 24 hours of incubation, the change in gel area (Ainitial-A24hrs) for each pharmacological agent was compared to the average change in gel area for DMSO-treated controls.
2.8 Quantification of ECM Remodeling and 3D Cellular Forces
After 24 hours of incubation with treatment, the gels were fixed and stained as described in Section 2.4. Gels containing no cells were fixed and compared to unfixed gels. No differences in collagen organization were observed (data not shown). The extent of ECM remodeling around isolated cells in 3D was quantified from 3 μm thick confocal reflectance sections of collagen fibrils. Using ImageJ [19], the cell area was subtracted from the reflectance channel and a 40 μm selector line was drawn from the cell’s centroid into the surrounding matrix. A custom-written ImageJ script rotated the selector line around the entire cell at 2-degree increments and captured an intensity profile at each step. Zero-intensity values were removed, defining the cell membrane as the origin, and reflectance intensities were averaged as a function of distance. The resulting collagen intensity profiles were analyzed individually for n = 4-6 cells per treatment. Profiles were normalized by subtracting the baseline intensity measured 30-32 μm from the cell membrane. Collagen intensity profiles were fit to the following exponential decay model, allowing I0 and τ to vary to minimize the sum of squared error,
| (1) |
where I is the intensity of collagen reflectance, d is the distance from the cell membrane, I0 is the intensity of collagen reflectance at the cell membrane (d = 0), and τ describes the nature of the exponential decay.
2.9 Statistical Analysis
Data for figures 2-4 were analyzed with Analysis of Variance (ANOVA) and Dunnett’s test after transformation by natural logarithm in JMP (v. 8.0, SAS, Cary, NC). Data for figure 7b were analyzed with a Mann-Whitney test. Statistical significance was considered with p < 0.05. Data is presented as Mean + standard error of the mean (SEM).
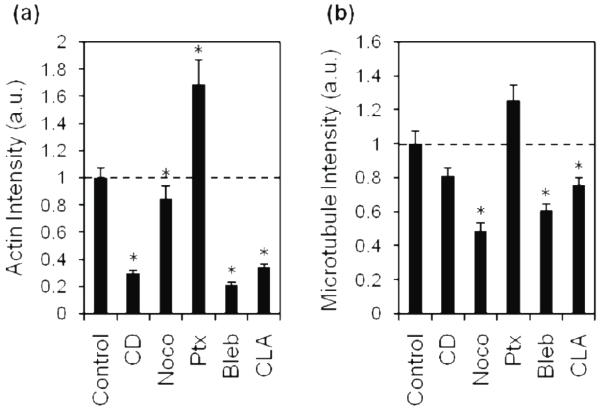
Fig. 2.
Quantification of average fluorescence intensities of actin and MTs in treated cells.
Actin (a) and MT (b) fluorescence was imaged and the average intensity of each treatment was quantified by measuring integrated density. Average intensities were normalized to control. Dashed line indicates control value. CD, cytochalasin D; Noco, nocodazole; Ptx, paclitaxel; Bleb, blebbistatin; CLA, calyculin A; a.u., arbitrary units. Mean + SEM. (*) indicates statistical difference from control.
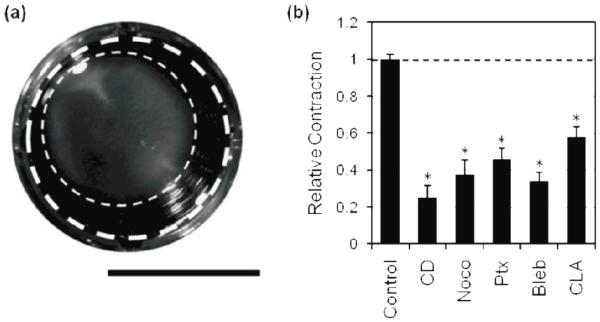
Fig. 4.
Effect of cytoskeletal agents on 3D collagen contraction.
Cells were seeded in collagen gels and treated with pharmacological agents over 24 hours. Original gel area (thick dashed line) and area after 24 hours of contraction (thin dashed line) were measured, scale bar is 1 cm (A). Relative collagen matrix contraction was quantified by normalizing the change in area of each condition to the change in area of the control (B). Dashed line indicates control value. Mean + SEM. (*) indicates statistical difference from control. CD, cytochalasin D; Noco, nocodazole; Ptx, paclitaxel; Bleb, blebbistatin; CLA, calyculin A.
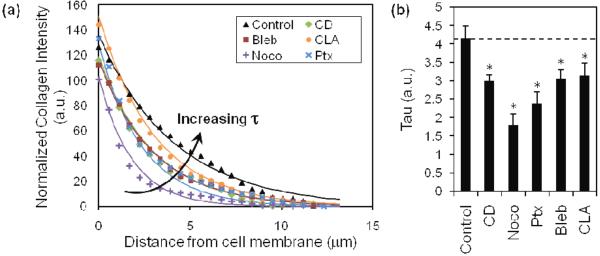
Fig. 7.
Quantification of cell-mediated collagen remodeling.
Quantification of confocal reflectance imaging of collagen fibers. Collagen intensity decreases exponentially as a function of distance from the cell membrane, and decreases differentially upon treatment with pharmacological agents (A). Each treatment is fit with an exponential decay model, from which tau (τ) is extracted as a descriptive parameter of decay of collagen intensity (B). Control (▲); CD, cytochalasin D (◆); Noco, nocodazole (+); Ptx, paclitaxel (×); Bleb, blebbistatin (■); CLA, calyculin A (●). Mean + SEM. (*) indicates statistical difference from control.
3. Results
3.1 Cytoskeletal perturbation and organization in 2D
To compare the role of the cytoskeleton in 2D versus 3D, we first investigated the structure of actin and MT in MDA-MB-231 cells (highly metastatic breast adenocarcinoma cells) on 2D substrates after treatment with actin, MT and myosin disruptors. Cells were seeded on polyacrylamide hydrogels with a Young’s Modulus of 5kPa, which approximates the stiffness of the breast tumor tissue [17], and then treated with specific pharmaceutical agents listed in Table 1. Confocal fluorescent images of actin and microtubules (MT) were taken to visualize changes in the cytoskeletal structure relative to control (figure 1), and actin intensities and microtubule intensities were measured (figure 2).
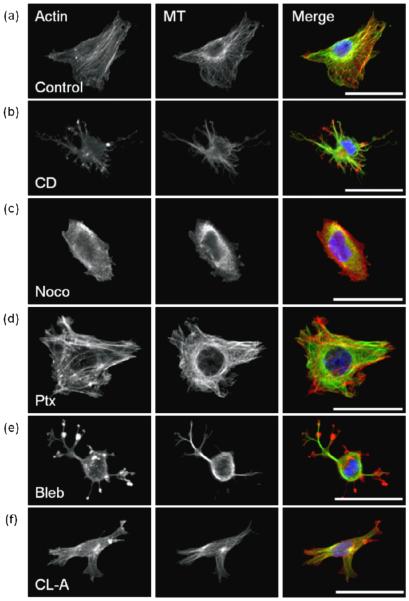
Fig. 1.
Cytoskeletal effectors affect cell morphology and cytoskeletal organization of MDA-MB-231 cells in 2D.
Fluorescent staining of actin (left), microtubules (MT, middle), and merge (right), with actin (red), MT (green), and nucleus (blue), scale bar is 50 μm. Cells were treated with DMSO control (a); actin-acting agent cytochalasin D [CD] (b); microtubule-acting agents nocodazole [Noco] (c) and paclitaxel [Ptx] (d); and myosin-acting agents blebbistatin [Bleb] (e) and calyculin A [CLA] (f).
On 2D substrates, untreated MDA-MB-231 cells were well spread, with heterogeneous morphologies, ranging from stellate to spindle-like (figure 1a). Cells exhibited prominent actin and MTs that appeared fibrous throughout the cell. To perturb the actin cytoskeleton, cells were treated with a filamentous actin inhibitor, cytochalasin D. Cytochalasin D-treated cells had a stellate morphology (figure 1b), and notably, punctate masses of actin were observed but well-defined actin fibers were not present. Fibrous MTs were localized in elongated membrane protrusions (figure 1b). As expected after treatment with cytochalasin D, fluorescence intensities reflected a significant decrease in polymerized actin (figure 2a), while MT intensity was observed to be similar to controls (figure 2b).
To assess the role of MTs in cytoskeletal morphology of cells on 2D substrates, MTs were perturbed with nocodazole, an inhibitor of MT polymerization, and paclitaxel, an agent that stabilizes polymerized MTs. Nocodazole-treated cells exhibited a rounded morphology (figure 1c), and both actin and MT fluorescence appeared diffuse throughout the cell, suggesting a lack of cytoskeletal organization. This observation was confirmed by quantification of actin and MT fluorescence intensities which were significantly lower than controls (figure 2). In contrast to nocodazole, paclitaxel-treated cells had prominent MTs and actin fibers (figure 1d). Quantification of fluorescence intensities revealed that paclitaxel-treated cells had significantly increased polymerized actin, and fibrous MTs similar to controls (figure 2). While both nocodazole and paclitaxel specifically target MTs, they each significantly affected the actin organization of the cell; nocodazole-treated cells exhibited decreased actin intensity while paclitaxel-treated cells exhibited an increase in actin intensity.
To probe the role of myosin on cytoskeletal organization of cells on 2D substrates, MDA-MB-231 cells were treated with blebbistatin, which suppresses myosin activity, and calyculin A, which promotes myosin activity by inhibiting myosin light chain phosphatase. Treatment with blebbistatin resulted in punctate clustering of actin that co-localized with bulbous regions within the cell protrusions (figure 1e). Fibrous MTs were not clearly visible in the cell body due to significant rounding in the perinuclear region. Calyculin A-treated cells were well-spread, but displayed less prominent actin and MT fibers than controls (figure 1f). Fluorescence intensity quantification indicates that the presence of both actin and MT fibers is significantly decreased in both blebbistatin and calyculin A-treated cells (figure 2) compared to controls.
These data indicate that treatment with agents which disrupt actin, MTs, and myosin activity caused observable and quantifiable changes in cytoskeletal morphology of cells plated on 2D substrates, and that there is crosstalk between the actomyosin and MT cytoskeleton.
3.2 Traction force generation on 2D substrates in cells with disrupted cytoskeleton
Because the cytoskeleton is known to mediate cellular force generation, we sought to investigate the role of actin, myosin and MTs in traction generation in 2D in MDA-MB-231 cells, and compare these effects to the effects of cytoskeletal perturbation of cells in 3D. To characterize cellular force in 2D, Traction Force Microscopy was used to measure the traction stress distribution and magnitude exerted by cells after cytoskeletal disruption.
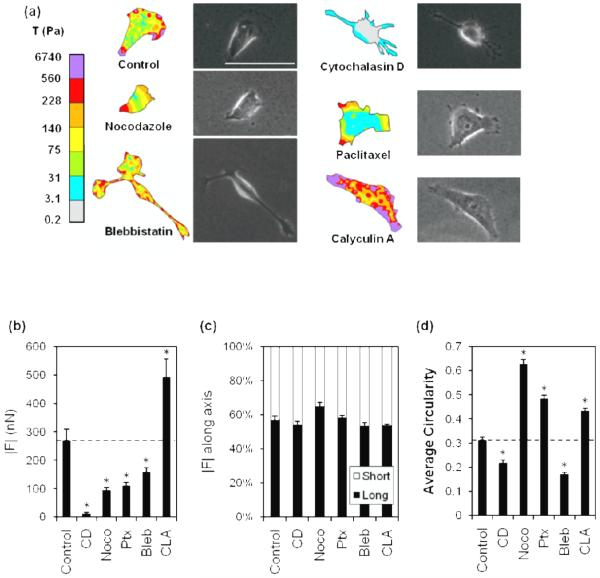
Color contour plots of traction stress magnitudes (figure 3a) indicated that, regardless of treatment with pharmacological agents, the greatest stresses were distributed along the cell edges, and the weakest stresses were distributed throughout the cell body. However, net traction force was significantly altered by treatment (figure 3b). MDA-MB-231 cells treated with cytochalasin D, nocodazole, paclitaxel, and blebbistatin exhibited significantly decreased force generation compared to controls while calyculin A-treated cells showed increased force generation (figure 3b).
Fig. 3.
Effect of cytoskeletal agents on 2D traction force generation and morphology.
Traction stress, T, distribution in cytochalasin D [CD]-, nocodazole [Noco]-, paclitaxel [Ptx]-, blebbistatin [Bleb]-, and calyculin A [CLA]- treated cells and controls (a). Force maps (left) and phase images (right) shown, scale bar = 50 μm. Average total traction force magnitude, |F|, in CD-, Noco-, Ptx-, Bleb-, and CLA- treated cells (b). Plot of the relative percentage each projection (long, black bars; short, white bars) contributed to the total of both traction integrals (c). The circularity of treated cells (d) was calculated (4πArea / Perimeter2). Dashed line indicates control value. Mean + SEM. (*) indicates statistical difference from control.
Notably, treatment with various pharmacological agents did not induce significant changes in the polarization of traction forces (figure 3c). However, while there were no significant differences in overall force polarization with treatment, there were differences in circularity (figure 3d). For example, MDA-MB-231 cells treated with cytochalasin D or blebbistatin exhibited a decrease in circularity (less rounded morphology) with pharmacological treatment (figure 3d) but had similar force polarity to cells with increased circularity (cells treated with nocodazole, paclitaxel, and calyculin A). These data suggest that MDA-MB-231 cells have an innate directionality of force that is slightly biased toward the long cell axis and insensitive to cytoskeletal perturbation in 2D.
3.3 Cytoskeletal perturbation and cellular contractility in 3D
Our data taken using 2D substrates indicate that actin, myosin and MTs each contribute to traction generation. However, less is known about how these findings in 2D translate to cell behaviors in more physiologically-relevant 3D matrices. To investigate the specific role of the cytoskeleton in cells in 3D matrices as compared to cells on 2D substrates, cells were embedded in collagen matrices and the effect of cytoskeletal perturbation on aggregate cellular force generation was quantified using a collagen contraction assay (figure 4a). Cells were treated with pharmacological agents for 24 hours using the same concentrations used in the 2D experiments described above and listed in table 1. When treated with pharmacological agents targeting actin (cytochalasin D), MTs (nocodazole, paclitaxel) or myosin (blebbistatin, calyculin A), matrix contraction decreased significantly compared to controls (figure 4b). These data indicate that a perturbation of cytoskeletal elements that contribute to cellular contractility leads to decreases in cells’ ability to contract the surrounding ECM, and suggest an overall decrease in cellular force generation.
3.4 Cytoskeletal organization and single cell force generation in 3D matrices
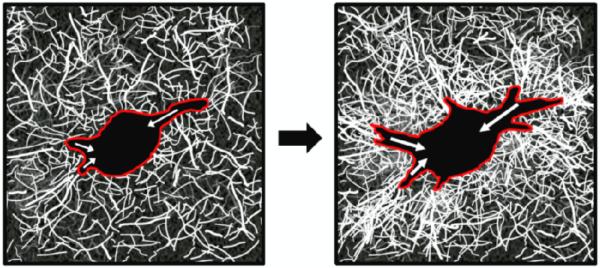
While the collagen contraction assay probes the collective response of cells en masse, it does not allow for the quantification of individual cellular traction forces in 3D. To determine the effects of cytoskeletal perturbation on cytoskeletal organization at the single cell level in 3D, cells were embedded in collagen gels at low density, and their cytoskeleton was imaged with and without pharmacological agents directed towards disrupting the cytoskeleton using confocal microscopy. To describe the forces generated by cells in 3D, cell-mediated matrix reorganization was observed using confocal reflectance microscopy to image collagen fibrils surrounding single cells with and without treatment (schematic shown in figure 5). Because cellular traction forces in 3D matrices result in the reorganization of matrix [23,24], matrix remodeling and changes in collagen intensity surrounding the cells were used to assess cell force (figures 6, 7). As cells reorganize their matrix and collagen becomes more fibrillar and dense, the confocal signal increases. Therefore, light intensity can be used to assess
Fig. 5.
Cartoon schematic of ECM remodeling as a metric of force generation in 3D.
Cells (red outline) generate contractile forces (white arrows), which develop over time and contribute to local ECM remodeling, as indicated by increased collagen fiber density and orientation relative to the cell body. Collagen organization and density can by visualized using Confocal Reflectance Microscopy.
Fig. 6.
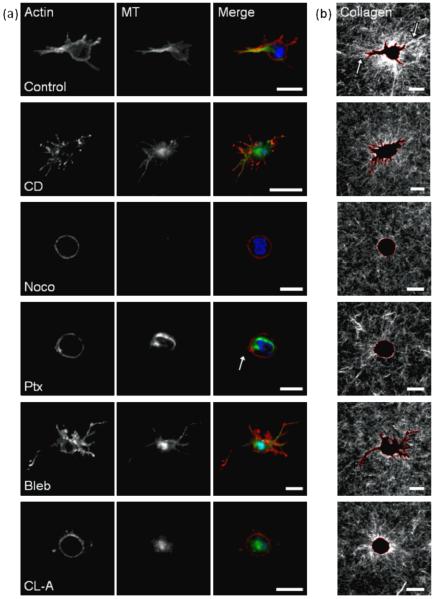
Effect of cytoskeletal agents on cell morphology and ECM reorganization in 3D collagen matrices.
Fluorescent staining of actin and microtubules (MT) in MDA-MB-231 cells embedded in 3D collagen matrices (A), and confocal reflectance of surrounding collagen fibers (B). Cells were treated with DMSO control; actin-acting agent cytochalasin D [CD]; microtubule-acting agents nocodazole [Noco] and paclitaxel [Ptx]; and myosin-acting agents blebbistatin [Bleb] and calyculin A [CLA] and imaged after 24 hours. Scale bar is 20 μm. Merge image pseudocolored red (actin), green (MTs), blue (nuclei).
Control cells treated with a DMSO vehicle for 24 hours were well-spread within the collagen matrices, with prominent actin and MTs localized to cell protrusions (figure 6a), rather than throughout the cell body as was observed in 2D (figure 1a). Notably, control cells dynamically reorganized the collagen matrix, as observed by changes in collagen fibril alignment and density (figure 6b, arrows) around the cell body. While collagen fibers far from the cell edge are randomly oriented, fibers near the cell appear to be radially oriented relative to the cell.
When treated with an actin destabilizer (cytochalasin D), cells in 3D matrices exhibited elongated membrane protrusions with punctate masses of actin at the cell membrane (figure 6a), similar to cells in 2D (figure 1b). Unlike their fibrous appearance in 2D, MTs in cytochalasin D-treated cells in 3D were diffuse throughout the cell body and protrusions. Collagen fibril reorganization was minimal around the cells, indicating that actin destabilization inhibits cell-mediated collagen reorganization (figure 6b).
The disruption of MTs (nocodazole) resulted in rounded morphologies. As expected, polymerized MTs were not detectable. Actin localized to the membrane and no detectable stress fibers were observed (figure 6a), similar to observations on 2D substrates (figure 1c). Collagen reorganization around the cell was minimal, indicating minimal cell force generation upon disruption of MTs (figure 6b), consistent with 2D and 3D force measurements (figures 3b, 4b). When treated with a MT stabilizer (paclitaxel), cell morphology was rounded but with some observable small membrane protrusions (figure 6a, arrow). Unlike the organized stress fibers observed in 2D, actin fibers in 3D were localized to the membrane, while MT organization was prominent throughout the cell body (figure 6a). Collagen fibril reorganization was minimal (figure 6b). These data suggest that the maintenance of MDA-MB-231 cell polarity is dependent on dynamic MTs, and that dynamic MTs are required for ECM remodeling.
When MDA-MB-231 cells were treated with an inhibitor of myosin activity (blebbistatin), they exhibited thin, elongated membrane protrusions with punctate actin and MTs (figure 6a) similar to blebbistatin-treated cells in 2D (figure 1e). Little collagen reorganization was detectable, and no collagen alignment was observed around membrane protrusions (figure 6b) indicating minimal cell traction force generation, consistent with force measurements in 2D and 3D (figures 3b, 4b). Promoting myosin activity (calyculin A) resulted in rounded cell morphologies unlike the well-spread morphologies observed in 2D (figure 1f), actin localized predominantly to the cell membrane, and diffuse MTs throughout the cell body (figure 6a). Radially-oriented collagen fibers around the cell body indicate that calyculin A-treated cells were able to reorganize their collagen matrix, but to a lesser extent than controls (figure 6b).
To quantify the observed changes in collagen remodeling with cytoskeletal perturbation, we plotted the collagen intensity as a function of distance from the cell membrane (figure 7a), fit each treatment condition with an exponential decay function (equation 1), and extracted τ as a descriptor of the decay, or decline in collagen intensity (figure 7b). In this model, the τ parameter indicates the rate of distance-dependent decay of collagen intensity. Our data indicate that control MDA-MB-231 cells, in comparison to treated cells, fit to a greater value of τ in our model, indicating that control cells exert greater traction forces in 3D, as evidenced by their ability to remodel the matrix at a greater distance from the cell membrane. Upon treatment with pharmacological agents that disrupt the cytoskeleton, our model indicates that τ is decreased and matrix remodeling and traction forces in 3D are significantly diminished. Measurements of the integrated collagen density surrounding the cells show a similar trend as τ, where disruption of the cytoskeleton results in a decrease of collagen intensity surrounding the cell (data not shown). Taken together, these data suggest that actin, MT or myosin disruption decreases the ability of cells to exert force that results in local ECM reorganization.
4. Discussion
While much is known about single cell force generation of cells on 2D substrates, much less is known about traction stresses of cells embedded in 3D matrices. Here, we directly compare the effects of cytoskeletal disruption on cellular forces in both 2D and 3D environments. To gain insight into the forces exerted by cells in 3D, we used Confocal Reflectance Microscopy to observe cell-mediated collagen fibril reorganization and analyzed collagen intensity using an exponential decay model. We compared force generation of MDA-MB-231 metastatic breast cancer cells in 2D and 3D microenvironments and the relative roles of actin, MTs and myosin in force generation. Despite cytoskeletal differences in 2D and 3D, our results indicate that differences in traction force in 2D generally correlated with differences in ECM remodeling and contraction in 3D collagen matrices, suggesting that actin, MTs, and myosin may play similar qualitative roles in mediating force in 2D and 3D.
Interestingly, the only treatment studied here that produced different effects in 2D compared to 3D was calyculin A which augments myosin II activity. In 2D, calyculin A treatment resulted in greater traction force generation compared to controls (figure 3b), whereas in 3D calyculin A treatment resulted in a significant decrease in contractility and ECM remodeling (figures 4b, 7). Previous studies have reported that enhanced actomyosin contractility in cells with an established actin cytoskeleton on 2D substrates increased traction force generation, but inhibited the temporal redistribution of traction forces [2] that may be required for continuous ECM remodeling in 3D. Additionally, local depletion of myosin II has been shown to be required for the formation of lamellipodia [25], indicating that endogenous regulation of actomyosin is important for cell spreading and contractility. Our studies in 3D have shown that after treatment with calcyulin A, cells exhibited rounded morphologies (figure 6a) and exhibited little contractility (figure 4b) and ECM remodeling (figure 6b). Therefore, we speculate that interfering with the ability to dynamically regulate myosin prevents MDA-MB-231 cells from spreading, exerting contractile forces, and reorganizing the local ECM. Future studies should focus on the role of myosin dynamics in mediating cell behavior in 3D matrices.
While our data indicate that treatment of MDA-MB-231s with nocodazole caused a significant decrease in force in 2D (figure 3b) and 3D (figures 4b, 7), these results are in contrast to previously published work by others [7,8,26]. Data in fibroblasts indicates that disruption of MTs with nocodazole results in either no apparent change in actin stress fiber organization or traction forces [26], or, in most cases, in an increase in stress fibers and cellular contractility [7-9]. Data from others suggests that when cells are treated with nocodazole, increased contractility and force generation result from a more prominent and organized actin cytoskeleton through release of the compressive elements within the tensegrity model or the activation of GTPases which activate myosin. However, in our study, when MDA-MB-231 cells were treated with nocodazole, we measured a significant decrease in the organization of both MTs and actin (figure 2), with no observable stress fibers, and a decrease in force. Together, these data indicate that treatment with nocodazole may result in cell-type specific behaviors. It is possible that the different response to nocodazole in MDA-MB-231 cells is linked to their metastatic potential and may reveal a differential role of microtubules in transformed cells. Future studies should include investigation of the role of microtubules in force generation during metastasis.
It is important to note that while the focus of this study has been a comparison of force generation of cells plated on 2D substrates in comparison to cells in 3D matrices, there are additional considerations that should be made in the future in comparing 2D versus 3D behaviors. Namely, 3D collagen matrices, including those used in this study, are typically considerably more compliant (~0.2-0.3 kPa) than polystyrene dishes, glass or the 2D polyacrylamide substrates we employ (5 kPa). Therefore, it is possible that some of the differences we observe could be due to differences in substrate stiffness. Future work should focus on the specific roles of substrate stiffness and dimensionality on cytoskeletal morphology and cell contractility.
5. Conclusion
We found that dynamic regulation of the actomyosin and MT cytoskeleton is required for the control of contractility in both 2D and 3D in MDA-MB-231 cells. In general, 2D traction force microscopy results correlated with ability of cells to remodel and contract 3D collagen matrices; however these results appear to be cell-type specific. Because of the distinctive differences in cytoskeletal organization and cell-matrix adhesions in cells on 2D substrates compared to those in 3D matrix, future work should focus on dynamic movements in the cytoskeleton as compared to force generation to more fully understand the role of the cytoskeleton in force generation and matrix remodeling in vivo.
Acknowledgements
This work was supported by the Cornell Center on the Microenvironment & Metastasis through Award Number U54CA143876 from the National Cancer Institute and R21RR025801 to CRK. This work was also supported by National Science Foundation Graduate Research Fellowships to CMK and BNS, and by a Howard Hughes Medical Institute Med-into-Grad Fellowship to SPC.
Footnotes
This study is part of an invited focus issue on the topic of “Physical Oncology.”
References
- 1.Reinhart-King CA. Endothelial cell adhesion and migration. Methods Enzymol. 2008;443:45–64. doi: 10.1016/S0076-6879(08)02003-X. [DOI] [PubMed] [Google Scholar]
- 2.Lemmon CA, Chen CS, Romer LH. Cell traction forces direct fibronectin matrix assembly. Biophys J. 2009;96(2):729–38. doi: 10.1016/j.bpj.2008.10.009. [DOI] [PMC free article] [PubMed] [Google Scholar]
- 3.Kumar S, Maxwell IZ, Heisterkamp A, Polte TR, Lele TP, Salanga M, Mazur E, Ingber DE. Viscoelastic retraction of single living stress fibers and its impact on cell shape, cytoskeletal organization, and extracellular matrix mechanics. Biophys J. 2006;90(10):3762–73. doi: 10.1529/biophysj.105.071506. [DOI] [PMC free article] [PubMed] [Google Scholar]
- 4.Cai Y, et al. Nonmuscle myosin IIA-dependent force inhibits cell spreading and drives F-actin flow. Biophys J. 2006;91(10):3907–20. doi: 10.1529/biophysj.106.084806. [DOI] [PMC free article] [PubMed] [Google Scholar]
- 5.Wang N, Naruse K, Stamenovic D, Fredberg JJ, Mijailovich SM, Tolic-Norrelykke IM, Polte T, Mannix R, Ingber DE. Mechanical behavior in living cells consistent with the tensegrity model. Proc Natl Acad Sci U S A. 2001;98(14):7765–70. doi: 10.1073/pnas.141199598. [DOI] [PMC free article] [PubMed] [Google Scholar]
- 6.Stamenovic D, Mijailovich SM, Tolic-Norrelykke IM, Chen J, Wang N. Cell prestress. II. Contribution of microtubules. Am J Physiol Cell Physiol. 2002;282(3):C617–24. doi: 10.1152/ajpcell.00271.2001. [DOI] [PubMed] [Google Scholar]
- 7.Danowski BA. Fibroblast contractility and actin organization are stimulated by microtubule inhibitors. J Cell Sci. 1989;93(Pt 2):255–66. doi: 10.1242/jcs.93.2.255. [DOI] [PubMed] [Google Scholar]
- 8.Kolodney MS, Elson EL. Contraction due to microtubule disruption is associated with increased phosphorylation of myosin regulatory light chain. Proc Natl Acad Sci U S A. 1995;92(22):10252–6. doi: 10.1073/pnas.92.22.10252. [DOI] [PMC free article] [PubMed] [Google Scholar]
- 9.Rhee S, Jiang H, Ho CH, Grinnell F. Microtubule function in fibroblast spreading is modulated according to the tension state of cell-matrix interactions. Proc Natl Acad Sci U S A. 2007;104(13):5425–30. doi: 10.1073/pnas.0608030104. [DOI] [PMC free article] [PubMed] [Google Scholar]
- 10.Zaman MH, Trapani LM, Sieminski AL, Mackellar D, Gong H, Kamm RD, Wells A, Lauffenburger DA, Matsudaira P. Migration of tumor cells in 3D matrices is governed by matrix stiffness along with cell-matrix adhesion and proteolysis. Proc Natl Acad Sci U S A. 2006;103(29):10889–94. doi: 10.1073/pnas.0604460103. [DOI] [PMC free article] [PubMed] [Google Scholar]
- 11.Cukierman E, Pankov R, Stevens DR, Yamada KM. Taking cell-matrix adhesions to the third dimension. Science. 2001;294(5547):1708–12. doi: 10.1126/science.1064829. [DOI] [PubMed] [Google Scholar]
- 12.Fraley SI, Feng Y, Krishnamurthy R, Kim DH, Celedon A, Longmore GD, Wirtz D. A distinctive role for focal adhesion proteins in three-dimensional cell motility. Nat Cell Biol. 12(6):598–604. doi: 10.1038/ncb2062. [DOI] [PMC free article] [PubMed] [Google Scholar]
- 13.Beningo KA, Dembo M, Wang YL. Responses of fibroblasts to anchorage of dorsal extracellular matrix receptors. Proc Natl Acad Sci U S A. 2004;101(52):18024–9. doi: 10.1073/pnas.0405747102. [DOI] [PMC free article] [PubMed] [Google Scholar]
- 14.Reinhart-King CA, Dembo M, Hammer DA. The dynamics and mechanics of endothelial cell spreading. Biophys J. 2005;89(1):676–89. doi: 10.1529/biophysj.104.054320. [DOI] [PMC free article] [PubMed] [Google Scholar]
- 15.Califano JP, Reinhart-King CA. Substrate Stiffness and Cell Area Predict Cellular Traction Stresses in Single Cells and Cells in Contact. Cellular and Molecular Bioengineering. 2010;3(1):68–75. doi: 10.1007/s12195-010-0102-6. [DOI] [PMC free article] [PubMed] [Google Scholar]
- 16.Legant WR, Miller JS, Blakely BL, Cohen DM, Genin GM, Chen CS. Measurement of mechanical tractions exerted by cells in three-dimensional matrices. Nat Methods. doi: 10.1038/nmeth.1531. [DOI] [PMC free article] [PubMed] [Google Scholar]
- 17.Paszek MJ, et al. Tensional homeostasis and the malignant phenotype. Cancer Cell. 2005;8(3):241–54. doi: 10.1016/j.ccr.2005.08.010. [DOI] [PubMed] [Google Scholar]
- 18.Califano JP, Reinhart-King CA. A Balance of Substrate Mechanics and Matrix Chemistry Regulates Endothelial Cell Network Assembly. Cellular and Molecular Bioengineering. 2008;1(2-3):122–132. [Google Scholar]
- 19.Rasband WS. ImageJ. 1997-2009. Available from: U.S. National Institutes of Health, Bethesda, Maryland, USA, http://rsb.info.nih.gov/ij/ [Google Scholar]
- 20.Cornhill JF, Levesque MJ, Herderick EE, Nerem RM, Kilman JW, Vasko JS. Quantitative study of the rabbit aortic endothelium using vascular casts. Atherosclerosis. 1980;35(3):321–37. doi: 10.1016/0021-9150(80)90130-6. [DOI] [PubMed] [Google Scholar]
- 21.Dembo M, Wang YL. Stresses at the cell-to-substrate interface during locomotion of fibroblasts. Biophys J. 1999;76(4):2307–16. doi: 10.1016/S0006-3495(99)77386-8. [DOI] [PMC free article] [PubMed] [Google Scholar]
- 22.Bornstein MB. Reconstituted rattail collagen used as substrate for tissue cultures on coverslips in Maximow slides and roller tubes. Lab Invest. 1958;7(2):134–7. [PubMed] [Google Scholar]
- 23.Yamato M, Adachi E, Yamamoto K, Hayashi T. Condensation of collagen fibrils to the direct vicinity of fibroblasts as a cause of gel contraction. J Biochem. 1995;117(5):940–6. doi: 10.1093/oxfordjournals.jbchem.a124824. [DOI] [PubMed] [Google Scholar]
- 24.Provenzano PP, Inman DR, Eliceiri KW, Trier SM, Keely PJ. Contact guidance mediated three-dimensional cell migration is regulated by Rho/ROCK-dependent matrix reorganization. Biophys J. 2008;95(11):5374–84. doi: 10.1529/biophysj.108.133116. [DOI] [PMC free article] [PubMed] [Google Scholar]
- 25.Fischer RS, Gardel M, Ma X, Adelstein RS, Waterman CM. Local cortical tension by myosin II guides 3D endothelial cell branching. Curr Biol. 2009;19(3):260–5. doi: 10.1016/j.cub.2008.12.045. [DOI] [PMC free article] [PubMed] [Google Scholar]
- 26.Pelham RJ, Jr., Wang Y. High resolution detection of mechanical forces exerted by locomoting fibroblasts on the substrate. Mol Biol Cell. 1999;10(4):935–45. doi: 10.1091/mbc.10.4.935. [DOI] [PMC free article] [PubMed] [Google Scholar]
- 27.Wakatsuki T, Schwab B, Thompson NC, Elson EL. Effects of cytochalasin D and latrunculin B on mechanical properties of cells. J Cell Sci. 2001;114(Pt 5):1025–36. doi: 10.1242/jcs.114.5.1025. [DOI] [PubMed] [Google Scholar]
- 28.Lu L, Feng Y, Hucker WJ, Oswald SJ, Longmore GD, Yin FC. Actin stress fiber pre-extension in human aortic endothelial cells. Cell Motil Cytoskeleton. 2008;65(4):281–94. doi: 10.1002/cm.20260. [DOI] [PubMed] [Google Scholar]
- 29.Liu Z, Tan JL, Cohen DM, Yang MT, Sniadecki NJ, Ruiz SA, Nelson CM, Chen CS. Mechanical tugging force regulates the size of cell-cell junctions. Proc Natl Acad Sci U S A. 107(22):9944–9. doi: 10.1073/pnas.0914547107. [DOI] [PMC free article] [PubMed] [Google Scholar]
- 30.Arisan ED, Kutuk O, Tezil T, Bodur C, Telci D, Basaga H. Small inhibitor of Bcl-2, HA14-1, selectively enhanced the apoptotic effect of cisplatin by modulating Bcl-2 family members in MDA-MB-231 breast cancer cells. Breast Cancer Res Treat. 119(2):271–81. doi: 10.1007/s10549-009-0343-z. [DOI] [PubMed] [Google Scholar]
- 31.Aoudjit F, Vuori K. Integrin signaling inhibits paclitaxel-induced apoptosis in breast cancer cells. Oncogene. 2001;20(36):4995–5004. doi: 10.1038/sj.onc.1204554. [DOI] [PubMed] [Google Scholar]


