

Abstract
An in vitro 3D model was developed utilizing a synthetic microgravity environment to facilitate studying the cell interactions. 2D monolayer cell culture models have been successfully used to understand various cellular reactions that occur in vivo. There are some limitations to the 2D model that are apparent when compared to cells grown in a 3D matrix. For example, some proteins that are not expressed in a 2D model are found up-regulated in the 3D matrix. In this paper, we discuss techniques used to develop the first known large, free-floating 3D tissue model used to establish tumor spheroids. The bioreactor system known as the High Aspect Ratio Vessel (HARVs) was used to provide a microgravity environment. The HARVs promoted aggregation of keratinocytes (HaCaT) that formed a construct that served as scaffolding for the growth of mouse melanoma. Although there’s an emphasis on building a 3D model with the proper extracellular matrix and stroma, we were able to develop a model that excluded the use of matrigel. Immunohistochemistry and apoptosis assays provided evidence that this 3D model supports B16F10 cell growth, proliferation and synthesis of extracellular matrix. Immunofluorescence showed that melanoma cells interact with one another displaying observable cellular morphological changes. The goal of engineering a 3D tissue model is to collect new information about cancer development and develop new potential treatment regimens that can be translated to in vivo models while reducing the use of laboratory animals.
Keywords: 3D, Melanoma, Scaffolding, Keratinocytes, HARVs
Introduction
Biologically compatible 3D models produced in artificial microenvironments are typically utilized to study how similar or dissimilar cell types interact, communicate, and signal in the presence of one another (Licato et al. 2001, Smalley et al. 2005; Griffith and Swartz 2006; Fischbach et al. 2007). An ideal cell culture model is one where a 3D construct is capable of providing cells’ the ability to network with one another in an unrestricted manner and independent of other natural stimuli. Furthermore, adding individual mediators one by one to the system can provide information about cellular mechanisms, gene expression and signaling pathways in isolated biological systems (Licato et al. 2001, Griffith and Swartz 2006; Becker and Blanchard 2007; Fischbach et al. 2007; Yamada and Cukierman 2007). Investigators interested in 3D models want to analyze specific processes to better understand mechanisms such as receptor up-regulation, protein synthesis, protein phosphorylation, mutation of genes, uncontrollable cancer cell proliferation, and tumor evasion (Hammond and Hammond 2001, Feder-Mengus et al. 2008). Scientists also want to study what occurs to individual cells when stimulated with metabolites, immune factors, pH, stress, growth factors, hormones, and proliferation signals. A 3D model can serve as a good intermediate between an in vitro and in vivo prototype, reducing the use of laboratory animals for experiments (Hammond and Hammond 2001, Smalley et al. 2005; Yamada and Cukierman 2007; Feder-Mengus et al. 2008). An additional advantage of utilizing the in vitro 3D model was the ease of manipulating experimental variables that would provide immediate results compared to an in vivo animal model.
The 3D model in this study consists of growing keratinocytes (HaCaT) into spheroids using bioreactors (Synthecon and Ingram et al. 1997). HaCaT cells mimic epithelia found in mammals, specifically human and mouse, to act as scaffolding that supports cellular growth of tumor cells such as melanoma (Stark et al. 1999; Griffith and Swartz 2006). In nature and culture, keratinocytes can promote cellular development because they are known to synthesize their own basement membrane (BM) for structural stability similar to the BM sitting on the extracellular matrix (Sudbeck et al. 1997; Rovee and Maibach 2004, and Smalley et al. 2005). In theory, an in vitro 3D model may not need a BM to encourage keratinocyte growth or development. On the other hand, fibronectin is found to be secreted at the cell surface of B16.F10 aggregates when interacting with integrins. Fibronectin and integrins are involved in cell attachment and signaling between the inside and outside of the cells (Hindie et al 2006). Keratinocytes are known to regulate melanocyte growth and proliferation through expression of adhesion molecules such as cadherins. The aberrant cell-cell communication and expression of adhesive properties in neighboring keratinocytes along with mutations in the cell cycle pathways have been predicted to up-regulate the oncogenic properties of melanocytes. In one in vitro study, the over expression of E-cadherin caused E-cadherin negative melanoma cells to adhere to keratinocytes, subjecting melanoma to keratinocyte regulation. Keratinocyte regulation allows for continuous growth and survival of melanoma, the regulatory properties of keratinocytes are compromised when fibroblasts and other N-cadherin producing cells promote metastatic properties and invasion of melanoma cells into subcellular layers (Christofori and Semb 1999; Hsu et al. 2000; Li et al. 2002; Fang and Herlyn 2006). We hypothesized, that the adhesive properties of keratinocytes and production of B16.F10 extracellular matrix in this 3D model would support the structural stability needed to promote B16.F10 cell-cell interaction and tumor proliferation. Normally, B16.F10 cells form a solid tumor but when the tumor tissue is disrupted the cells are fluid and do not stick to one another easily (Ghosh and Maity 2007). Keratinocytes provided the structure to hold B16.F10 cells in proximity to one another and acts as a template for promoting cellular proliferation and differentiation. The studies reported in this paper demonstrate how HaCaT scaffolding aids in promoting B16.F10 tumor development.
Melanoma progression has been studied using other 3D methods, such as the liquid overlay method (Smalley et al. 2006), matrigel/algi matrix (Gibco), cytodex/plastic beads scaffold (Sigma/Solohill) and Extracel sponges (Glycosan). Experimentation using these methods has proven to be successful, promoting cellular aggregates of melanoma ranging in size between 50μm to 500μm in diameter. Although, these techniques provide useful information on a microscale, we were interested in obtaining tumor sizes closer to 1cm in diameter in order to test treatment regimens against melanoma on a macroscale. To our knowledge, this is the first report of generating a large free-floating 3D tumor model of about 1cm in diameter. Our objectives were to study the characteristics of this in vitro scaffold, how it promotes an environment suitable for tumorgenesis and how this model can be used to study delivery methods and therapeutic interventions against cancer.
Materials and Methods
Rotating Wall Vessel Bioreactor System
The High Aspect Ratio Vessels (HARVs) promote 3D cell culture growth in a microgravity setting (Synthecon, Houston TX, Swartz et al. 1992). The vessels are equipped with two luer locks ports, one sampling port and six tightening screws. These vessels rotate on their base at 1 gravitational force (G) providing an optimal environment for cells to grow in suspension experiencing minimal shearing and interference by the media or the vessel walls. Cellular expansion occurs in a state of free fall or solid body rotation while floating in media (Shwartz et al. 1992, Hammond and Hammond 2001, Licato et al. 2001, Gao et al. 1997, Nakamura et al. 2002). The vessels contain a silicon membrane that allows passive diffusion of oxygen and carbon dioxide enhancing successful growth of cells (Goodwin et al. 1993; Freed and Vunjak-Novakovic 1997; Gao et al. 1997; Doolin et al. 1999; Becker and Blanchard 2007).
Cell Lines
B16.F10 mouse melanoma cells (ATCC, Manassas VA) were primarily grown as a 2D monolayer in McCoy’s media 10% FBS and 0.2% Gentamycin (Mediatech, Cellgro, Manassas VA, Mid Sci St. Louis MO) HaCaT human keratinocytes were a generous gift from Dr. Mark Jaroszeski (University of South Florida, Tampa FL). These cells were grown in flasks without feeder cells because they had the ability to adhere tightly to the flask and to themselves (Coolen et al. 2007). The HaCaT cells were grown in DMEM Media 10% FBS and 0.2% Gentamycin. All cells were grown in a humidified incubator at 37°C and 5% CO2. Cells were removed from flasks using trypsin without EDTA. Following removal from the flasks, trypsinized cells were neutralized with media, washed in DPBS and kept on ice until they were ready to be utilized for the 3D model.
3D tissue culture
HaCaT cells were prepped for the HARVs (mentioned above) the total numbers of viable cells were determined using trypan blue and counted using a hemocytometer. Cells were resuspended in the final volume needed to fill the vessel of choice. 40-60×106 HaCaT cells injected into a HARV produced a spheroid with a 1cm diameter. To load the HARV, both luer locks were turned to the open position, a syringe attached to a 14 gauge cannula aspirated the HaCaT cells resuspended in media from a conical, then this syringe was fastened to one open luer lock port and then the cells were slowly injected into the HARV. All bubbles were removed from the vessel by injecting most of the cells into one port of the HARV and then slightly tilting the vessel at an angle to drive all the bubbles into another syringe attached to the opposite port. In a piston-like motion bubbles were gently forced out of the HARV avoiding increased pressure on the membrane. The removal of all bubbles reduced the disruption to spheroid formation (Gao et al. 1997).
HARV Equipment Set-up and Utilization
During the initial set-up of equipment, the bioreactor motor systems RCCS-1 or RCCS-4SCQ (Synthecon Houston TX) were disinfected with 70% ethanol and sporicide. Once the HARVs were placed in the incubator, the vessels were attached to the base of the bioreactors by fastening the HARV into place using a clockwise rotation. To begin aggregate formation, the cells were initially rotated at 15 to 17 rotations per minute depending on the amount of cells in the HARV. The cells remained suspended in media rotating with minimal interference. The pH and oxygen levels remained homeostatic because the passive diffusion of oxygen and carbon dioxide between the cells, media and incubator allowed even exchange of gases. This procedure of oxygenation ensured that viable cells received the necessary nutrients to continue replication. Once HaCaT cells formed the desired spheroid size, the vessel was removed from the base and the spheroid was manipulated towards the vessel’s sample port for injection of tumor cells.
Injection of B16.F10 into Spheroids
B16.F10 cells were harvested, washed, resuspended in McCoy’s media and counted using a hemocytometer. The cells were then concentrated to the desired volume containing 2-10×106 B16.F10 cells. A 28-½ gauge needle was used to inject B16.F10 into the HaCaT spheroids. The spheroid was maneuvered toward the sampling port, the cap removed and then the spheroid was delicately injected with 25-50μl of B16.F10 cells. The elastic spheroid expanded as the cells were injected, a slight ballooning of the spheroid was observed during the injection. The spheroid was durable enough to withstand one to three different injection sites, but one injection was sufficient. The sample port was sealed again and additional media was added to the HARV to remove excess bubbles. A mixture of two different media were used to promote the growth of B16.F10/Keratinocyte, this included 70% McCoy’s and 30% DMEM. The media mix was used in media changes that ranged from 20 to 50% of the total HARV volume. To avoid two media changes in one day the Co2 levels were decreased to 1.5-1.9%. The reusable HARVS were cleaned after each use, per manufactures’ instructions (Synthecon, Houston TX). Briefly, the HARVs were soaked in sterile deionized or nanopure water overnight. Then the HARVs were soaked in 70% ethanol for 8-16 hours (hr), air dried, wrapped in foil and autoclaved at 105-110°C for 30minutes (min).
Double Staining Immunohistochemistry
Immunohistochemistry (IHC) was used to identify different cell types within the spheroid. Spheroids containing proliferating B16.F10 cells were fixed in 4% paraformaldehyde or 10% formalin for at least 6 to 12hr up to 24hr, processed and embedded in paraffin wax. In order to perform a double immunostaining the samples were depariffinized using Xylene to break down paraffin. Then samples were dehydrated and rehydrated using different concentrations of ethanol. The following procedures were performed at room temperature (RT). The recipe for deparaffinization was as follows: sections were dipped in glass slide jars containing 3 Xylene washes, two 100% ethanol washes, one 95%, and one 80% ethanol wash. All steps described from here were performed in a humidified chamber. The samples were enzymatically pre-treated for antigen retrieval using 0.4% Pepsin in 0.01M HCL. After the incubation period, samples were rinsed with 1x phosphate buffered saline (PBS, Sigma St. Louis MO). Since two different secondary antibodies were used in this assay, an endogenous peroxide quenching step was necessary to avoid non-specific binding of secondary conjugated Strepavidin-HRP which reacts with diaminobenzidine (DAB). The samples were blocked with 10% hydrogen peroxide in methanol and also blocked with serum corresponding to the species source of their secondary antibodies. For mouse anti-human AE1/AE3 (MAB3412 Milipore, Billerica MA) the secondary antibody source was goat so all samples were blocked with 2.5% normal goat serum diluted (Thermo Scientific, Waltham MA) in 1x tris buffered saline (TBS, Boston Bioproducts, Worcester MA) containing 0.1% BSA. TBS was used instead of PBS to avoid any interference with the secondary antibody goat anti-mouse IgG bound to alkaline phosphatase AP (80200 QED Bioscience Inc. San Diego CA). For rabbit anti-mouse S100 (AB941 Millipore, Billerica MA) the secondary antibody source was bovine and this serum was used to block for the bovine anti-rabbit IgG HRP (sc-2370 Santa Cruz Biotech, Santa Cruz CA). In this experiment, AE1/AE3 (1-10mg/ml) was diluted first to 1:100 in TBS + 0.1%BSA. The secondary antibody goat anti-mouse IgG AP was diluted 1:20 in TBS + 0.1%BSA. The samples were developed with the East Red substrate chromogen developer solution. The East Red solution was used per manufacture’s instructions (Thermo Scientific, Waltham MA). Briefly, 3mL of Napthol Phosphate Substrate was mixed with 1 drop 40ul of Liquid Fast Red Chromogen. Then all staining procedures were repeated with the S100 primary antibody. The samples were blocked with 2.5% normal bovine serum and then incubated with S100 diluted to 1:800 in 2.5% normal bovine serum. Then the samples were incubated with secondary antibody bovine anti-rabbit IgG HRP diluted 1:20 in 2.5% normal bovine serum. A DAB substrate was used per manufacturer’s instructions. One 10 mg tablet was mixed in distilled water (Acros EASYtablets, Geel Belgium) to develop the stain. The sample slides were counterstained using Hemotoxylin (Sigma, St Louis MO), rinsed, mounted with an aqueous mounting media (Polysciences Inc., Warrington PA), covered with a 20×60mm cover slip (Corning, Corning NY) and slides were observed under a light microscope. Negative controls were included to show specificity of the primary antibodies to their secondary antibodies. The primary antibody was added to the slide but the respective secondary antibody that did not match was also added showing no reactivity.
Proliferation Assay and Extracellular Matrix Staining
A double IHC was performed to stain for proliferating cells and cells synthesizing their own extracellular matrix. An Abcam (http://www.abcam.com/ps/pdf/protocols/ihc_p.pdf) protocol was used to perform staining procedures. Briefly, slides were deparaffinized, rehydrated, antigens were unmasked using 20μg/mL of Proteinase K 30min 37°C and samples were blocked using goat serum plus 0.025% triton X. The slides were first labeled with an anti-Ki67 antibody at a 1:200 dilution (ab15580 Abcam Cambridge MA) or an anti-Fibronectin antibody at a 1:200 (ab2413 Abcam Cambridge MA) and then incubated with goat anti-rabbit IgG-HRP as the secondary antibody at a 1:20 (ab6721 Abcam Cambridge MA). The labeled samples were developed using DAB and then visualized under a light microscope. The slides were counterstained using AE1/AE3 1:200 and secondary antibody goat anti-mouse IgG AP 1:200 as mentioned above. A negative control was tested along with the sample slides where the secondary antibody was tested for non-specific binding in the absence of the primary antibody.
TdT assay and IHC
The TdT-FragEL DNA Fragmentation Detection assay (Calbiochem, San Diego CA) was performed on paraffin embedded samples to identify cells undergoing cell death followed by a double IHC assay to designate the cell types that were experiencing apoptosis. A methyl green counterstain distinguished normal cells from apoptotic cells by producing a tan or blue-green stain for viable cells and a dark brown stain for dead cells. A positive and negative control was performed simultaneously with the assay. The positive control included DNAse I (Promega, Madison WI) to intentionally nick the DNA ends and in the negative control the TdT reaction mix was not added to the sections. The assay was performed per manufacture’s instructions. Briefly, the samples on the slide were deparaffinized and rehydrated by immersing slides in Xylene, 100% ethanol, 90% ethanol, 80% ethanol, 70% ethanol, and rinsed in 1x TBS. The sections were permeabilization using 2mg/mL of Proteinase K diluted to 1:100 in 10mM Tris pH 8. Then blocked for endogenous peroxidases with 30% hydrogen peroxide diluted 1:10 in methanol. The sections were equilibrated with 5x TdT equilibration buffer diluted 1:5 in deionized water. TdT labeling reaction mix was prepared by mixing TdT Labeling Reaction and TdT enzyme. The labeling reaction was terminated with stop solution and then blocked with provided blocking buffer. The Strep-HRP conjugate was diluted 1:50 in blocking buffer and then developed using a DAB solution.
Before counterstaining, a double IHC was performed similar to the one described above. Briefly, endogenous peroxides were re-blocked with 10% hydrogen peroxide diluted in methanol and then samples were blocked with 2.5% normal goat serum. The primary mouse anti-human AE1/AE3 antibody was added to the sections diluted 1:200 in 2.5% normal goat serum (All chicken, goat and rabbit serum Molecular Probes, Carlsbad CA) and the secondary goat anti-mouse IgG AP was diluted 1:50 in 2.5% goat serum. Then all slides were developed using Fast Red. Next, sections were blocked with 2.5% rabbit serum and incubated with primary antibody S100 goat anti-mouse (sc-7849 Santa Cruz Biotech, Santa Cruz CA) diluted 1:100 in rabbit serum. The sections were incubated with the secondary rabbit anti-goat IgG HRP (HAF017 R&D Systems, Minneapolis MN) diluted 1:20 in rabbit serum and developed using DAB. Finally, the sections were counterstained with methyl green, mounted using permount (Fisher, Pittsburgh PA) and then observed under a light microscope. Viable cells were counted using a micrometer found in the ocular lens of the scope.
Double Immunofluorescence
This assay was performed based on an immunofluorescence (IF) protocol described by the Cell Signal website (www.cellsignal.com/support/protocols/IF.html). Briefly, the sections were deparaffinized and rehydrated using xylene, 100% ethanol, 95% ethanol, and rinsed in deionized water. The antigen retrieval step involved using 10mM of sodium citrate pH 6 in deionized water. The slides were placed in a glass container separate from one another and heated in a water bath up to 87°C for 20min. The sections were blocked using cocktail blocking buffer made up separately for the two different host serums. The total volume used was 25mL; 2.5mL 10x PBS, 1.25mL normal chicken or rabbit serum, 21.25mL of deionized water were mixed, and 75μl of TritonX-100 (100%, Sigma St. Louis MO). A primary antibody cocktail was prepared separately and then combined on the slide; a 10mL antibody dilution buffer was prepared using 400μl of 10x PBS, 3.6mL of deionized water mixed, 0.040g of Bovine Serum Albumin (BSA Fisher, Pittsburgh PA) and 12μl TritonX-100. Mouse anti-human AE1/AE3 was diluted 1:100 and goat anti-mouse S100 (sc7849 Santa Cruz Biotech, Santa Cruz CA) was diluted 1:50 in dilution buffer. The cocktail of antibodies were incubated at 4°C overnight. The following day the slides were washed in 1x PBS 3 times, between washes 2 and 3 an additional wash was added 0.4M high salt 1x PBS solution to reduce background staining. The sections were blocked a second time to ensure there would be no non-specific binding by the secondary antibodies. The rabbit anti-goat IgG FITC was diluted 1:100 and chicken anti-mouse IgG Rhodamine was diluted 1:100 (sc-2777 and sc-2861 Santa Cruz Biotech, Santa Cruz CA). The sections were washed with PBS and high salt PBS. The sections were also re-incubated with rabbit anti-goat IgG FITC diluted to 1:50 to ensure binding of this secondary antibody. The samples were mounted using vectashield medium (Vectashield, Burlingame CA) and excited at two different wave lengths Fluorescein Iso-thiocyanate 490/520nm and Tetramethyl Rhodamine Isothiocyanate 557/576nm for detection. A negative control was performed simultaneously with this assay. The primary antibodies were added but mis-matched secondary antibodies were used to check for cross reactivity.
Results
Growing cells without the scaffolding
B16.F10 cells injected into the HARV without a scaffold aggregated towards each other, but were loosely connected or simply floated in the vicinity of one another (data not shown). This was due to the HARV’s horizontal rotation exerting forces onto the denser particles driving the cells towards co-localizing cells in the same quadrant of the vessel (Gao et al. 1997, Hammond and Hammond 2001). These aggregates were easily disturbed when the vessel was removed from the base and during media changes. These observations suggested that a scaffold would be needed.
Establishing the scaffolding
The HaCaT cells also migrated towards each other when cultured in the HARV however, due to their tightly adhesive properties they formed a stable spheroid scaffold. Injecting 40-60×106 cells into the HARV resulted in the formation of a 1cm diameter spheroid aggregate after 24hr to 48hr (Figure 1A). These spheroids were stable and could be transferred from the HARV to a petri dish without disruption. The cells were also malleable and able to resist needle punctures as well as absorb the forces applied when injecting fluid into them. The maximum volume that could be injected into the spheroid before rupturing ranged between 50-200μl depending on the aggregate’s size and thickness (Figure 1B).
Figure 1.
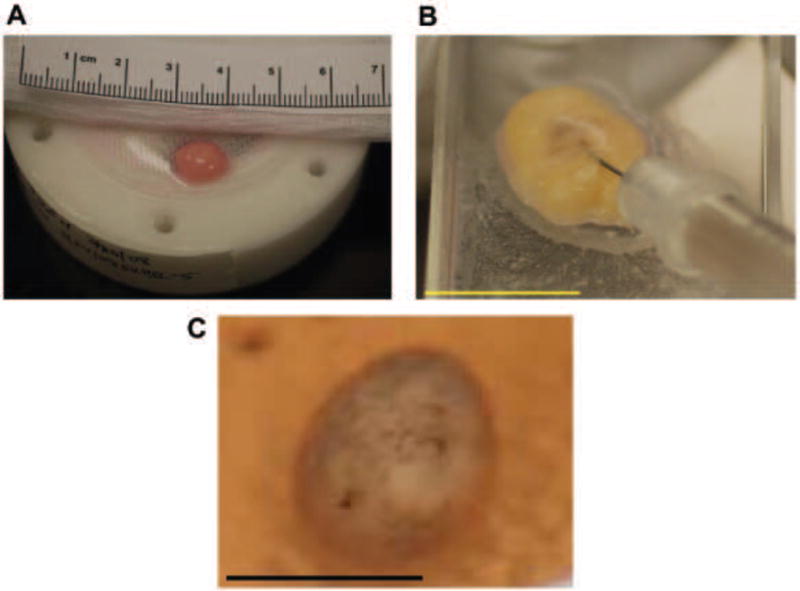
Spheroid developments in the HARV. (A) Spheroid development after 1-2 days with a diameter of about 1cm. (B) Representative spheroid being injected with 1.5 × 10⁶ B16.F10 cells in a volume 100-200 μl (C) 2-4 days after B16.F10 cells were injected into the spheroid and the beginning or melanin producing cells proliferating and differentiating within the spheroid.
Melanoma Spheroid
It was determined that B16.F10 cells could be injected into HaCaT cell spheroids after 48hr to 72hr post spheroid formation. B16.F10 cells injected into the center of the HaCaT scaffold underwent proliferation for 5-7 days after inoculation. Figure 1C demonstrates that the cells were proliferating and had begun to differentiate into pigment producing mature cells.
Assessing Cellular Viability
An immunohistochemistry assay was performed to confirm that the cells within the tumor spheroid were viable (Figure 2). It was observed that 80% of the cells remained viable in this environment up to 4-6 days while residing in culture. Histological evaluation verified that the nucleus was intact, the cytoplasm was free of granules and that more HaCaT cells were found in culture compared to B16.F10 with a 3:1 ratio. Although 10 times the amount of HaCaT cells was used to construct the scaffold; the rapidly proliferating B16.F10 cells made up one third of the construct.
Figure 2.
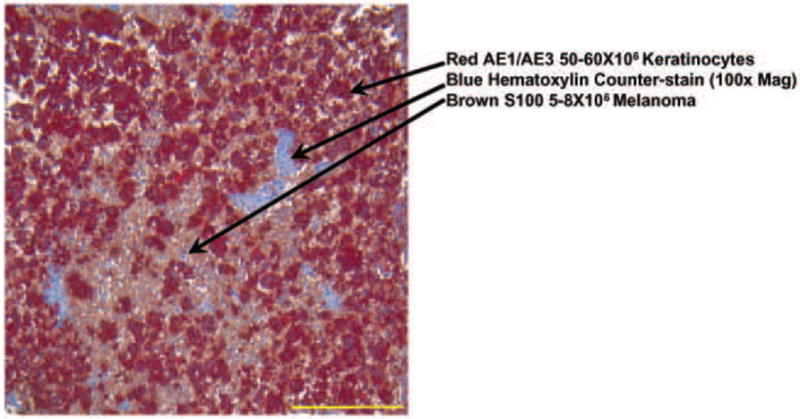
Double IHC Staining Image: Light Microscope 100x mag. B16.F10 (brown) and Keratinocytes (red) showing a 1:3 cell ratio in the section with 80% viability This image shows viability of melanoma cells surrounded by the keratinocytes in an in vitro 3-D tumor model 4-6 days after injection. These results are representative of 3 replicate experiments.
Evidence of Cellular Viability
The TdT and double immunohistochemistry (IHC) assays were preformed to provide additional evidence of cellular viability. It was observed that 80-90% of the B16.F10 cells remained viable after being in the HARV up to 7 days. The positive control slide was subjected to DNAseI (Figure 3A) which nicked the DNA and allowed for labeling by TdT to produce a dark brown stain indicating cells had undergone apoptosis. The negative control showed that the nuclei of cells did not stain (data not shown). In addition, IHC was performed to show the specific cells such as HaCaT and B16.F10 were either reactive or non-reactive to the TdT assay (Figure 3B). The sample slides showed that >80% of B16.F10 and HaCaT nuclei had a blue-green or tan staining. We observed that B16.F10 looked as though they were proliferating and grouping together forming isolated populations.
Figure 3.
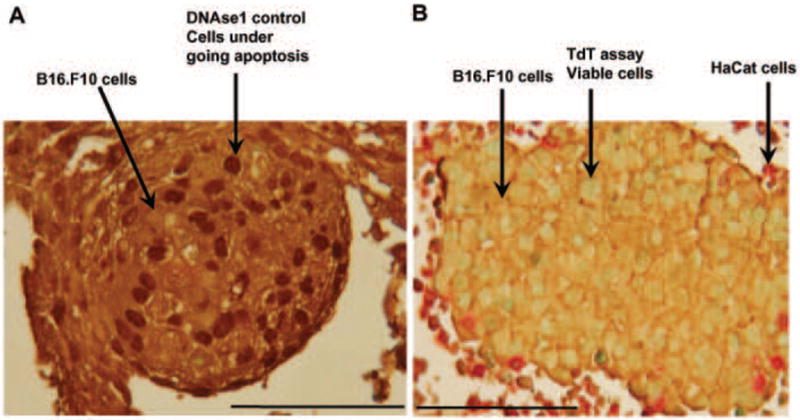
TdT and IHC assay. A) Positive control slide treated with DNAseI which nicked DNA and then TdT labeled cells with dark brown pigment to display the cells undergoing apoptosis. The cells were stained with IHC for contrast, the B16.F10 cells stained brown. B) Sample slide of B16.F10 stained in brown and HaCaT stained in red. The viable cells display tan or blue green nuclei and dead cells display dark brown nuclei. Results are representative of 3 replicate experiments. 400x magnification.
B16.F10 proliferation and extracellular matrix synthesis
An IHC assay was performed on spheroids to stain for proliferating B16.F10 cells using Ki67 antibody. The nuclei of the cells were observed to be stained different shades of brown which indicated differences in proliferation. The nuclear staining procedure can be used to determine if cells are in various stages of the cell cycle based on the intensity of the stain (see arrows in Figure 4B). A negative control demonstrated that non-specific binding of Ki67 is not observed (Figure 4A). The spheroids were also stained to identify whether B16.F10 cells proliferating in the spheroids have the ability to produce their own extracellular matrix. Spheroid was sectioned and stained with Fibronectin antibody. Fibronectin, a component of the extracellular matrix, was observed at the surface of cells as depicted in Figure 5. Fibronectin staining displays a matrix like component that surrounds the cells. A negative control slide showed that fibronectin is a specific antibody to surface antigens (data not shown). The AE1/AE3 antibody binds to keratinocyte surface marker and allowed for localization of specific cell types within the spheroid (Figure 5). Dual staining indicates that extracellular matrix is being produce by both cell types since AE1/AE3 negative cells were found to be fibronectin positive.
Figure 4.
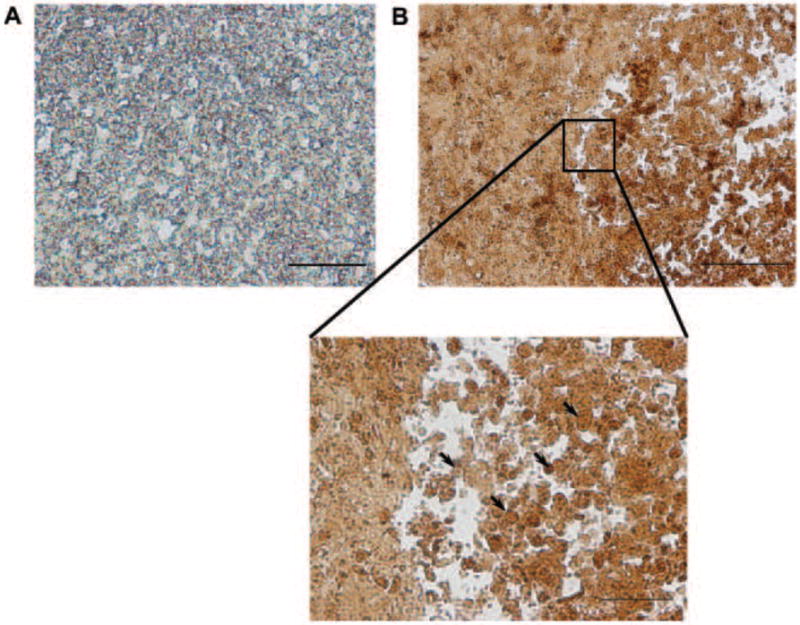
IHC Proliferation assay. A) Double IHC negative control slide. The primary antibody Ki67 was not added to the slide but the corresponding secondary antibody was tested for non-specific binding. B16.F10 resided in spheroid a total of 3-7 days. Bar = 50μm. B) 200x mag. Sample slide of B16.F10 and HaCaT nuclear staining. Dark and light brown staining display cells undergoing proliferation and present at different stages of the cell cycle. Enlarged image demonstrates variable staining of cells’ nuclei. Arrows point to areas of variable staining. B16.F10 resided in spheroid a total of 3-7 days. Bar = 100μm (B) and 50μm (Zoom). Results are representative of 3 replicate experiments. 200x + 16x magnification.
Figure 5.

Double IHC Extracellular matrix production. The HaCaT and B16.F10 promote the production of their own extracellular matrix stained using Fibronectin antibody. B16.F10 resided in spheroid a total of 3-7 days. Results are representative of 3 replicate experiments. Bar = 100μm. 200x magnification
Localization and Orientation of B16.F10 and HaCaT
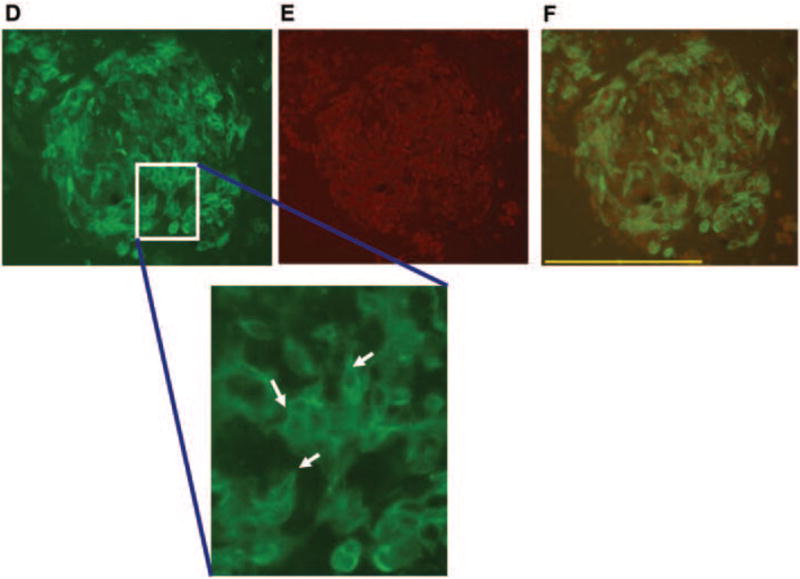
A double immunofluorescence (IF) assay was performed to evaluate spatial orientation of HaCaT cells relative to B16.F10 tumorgenic cells (Figure 4). This particular spheroid was harvested 5 days after incubating in the HARV. Figure 4A shows the fluorescent excitation of B16.F10 cells by FITC wavelengths and Figure 4B shows excitation of HaCaT cells by TRITC wavelengths independent of one another. The images were merged to show the amount of overlap that occurred between cells when growing in the scaffold (Figure 4C). The green fluorescent label shows grouping of B16.F10 surrounded by or integrated within HaCaT cells in red (single arrows). The B16.F10 cells appeared as though they were grouped in isolated populations as well as growing on top of the HaCaT cells (single arrows). The HaCaT cells appeared as though they were organized; flattening and stacking making up the walls of the spheroid with B16.F10 growing on top of the HaCaT (triple arrows). These cellular arrangements and growth patterns were clearly identified in the separate fluorescent signal images compared to the merged image where the strong fluorescent signal seemed to be quenched (Figure 4AB) while the B16.F10 appeared as though they were growing processes and beginning to display elongated morphological changes (arrows in Figure 4DEF).
Discussion
While several scaffolds were evaluated for their ability to construct a 3D tissue model, HaCaT spheroids provided a useful framework that could support the development and proliferation of B16.F10 cells. HaCaT cells grown in the HARV were able to stick together forming a malleable, stable construct that could mimic the complex environment needed to support the growth and differentiation of melanoma. The horizontal rotation, laminar fluid flow, hydrodynamic forces and oxygenation provided by the HARV (Hammond and Hammond 2001) allowed for this 3D modeling to be possible (Fig 1). Evidence that strengthens our hypothesis includes the IHC, TdT and IF assays. These results demonstrated that B16.F10 cells were able to proliferate and differentiate normally; producing mature pigmented cells as seen in malignant cancer development (Tai et al. 1983). HaCaT cells formed spheroids in less time than expected, about 1 to 2 days, with a size of about 1cm in diameter. The scaffold was able to keep the loose, fluid B16.F10 cells close in proximity to promote tumorogenesis as observed with IF and IHC (Figures 1, 2, 3 and 4).
The key to developing the 3D growth of tumor cells was the use of the HaCaT scaffold. The tight adhesive properties of HaCaT cells did not allow much diffusion of nutrients into the center of the construct, but when B16.F10 were injected into the scaffold surrounded by media it caused an influx of media providing the inner cells nutrients to survive (Figure 1B). In future studies, it is possible that the use of growth factors along with fibroblasts could expedite the expansion and development of B16.F10 in less time (Griffith and Swartz 2006).
In the IHC analysis, we observed a 3:1 ratio of HaCaT to B16.F10, so it is inferred that keratinocytes adhesive proteins were regulating melanoma cells proliferation and survival (Figure 2). Evidence of proliferation was provided in the IHC assay (Figure 4B). Staining of B16.F10 and HaCaT nuclei indicated the cells were in different stages of the cell cycle. Stable cellular growth, communication, signaling and survival were observed in HaCaT and B16.F10 cells. These cells were also observed to have the ability to produce their own extracellular matrix while residing in the 3D spheroid construct (Figure 5). The IF showed that there was some cell-cell communication between B16.F10/B16.F10 and B16.F10/HaCaT. We observed groupings of B16.F10 in smaller populations while residing in the spheroid and we also observed B16.F10 cells growing on top, adjacent and integrated with the HaCaT cells. The IF demonstrated HaCaT/B16.F10 cells stacked upon one another forming a pseudo wall or barrier (Figure 4 DEF). We think the HaCaT cells could be expanding at a slow rate, remain in an undifferentiated state or possibly driven to a state of differentiation to allow continuous survival of B16.F10 cells. The evidence that supports these observations was revealed through the specific antibodies AE1/AE3 used in IF. The AE1/AE3 are broad spectrum pan cytokeratins that measure all states of epithelial cell development. A strong fluorescent signal was observed indicating that HaCaT maybe undergoing proliferation and/or differentiation (Figure 4ABC). Further studies need to be conducted to provide additional evidence for the identification of epithelial growth stage while residing in the HARV; absent of a basement membrane and stroma. The S100 surface marker provided the information that malignant melanoma was present, but further evidence of melanoma developmental is also needed to confirm the predictions of this study. We also observed changes in B16.F10 morphology; the cells were undergoing elongation and forming dendrite-like processes. These results support that B16.F10 were interacting and communicating with adjacent B16.F10 and HaCaT cells while residing in this 3D model (Figure 4DEF).
Conclusions
This is the first known report of the development of a 3D model that produces a free floating tumor spheroid that can be grown to a size of at least 1 cm. Previously, there was a report of a study that described producing an organotypic coculture system that produced a 3D model ranging 1-2cm over a 2wk period. This other model was not free floating and was evaluated for potential skin transplantation not for tumorigenesis (Schoop et al. 1999). The study we report here demonstrated that keratinocytes were able to provide a template for melanoma proliferation in a 3D in vitro model. In this semi-synthetic environment, keratinocytes were a well organized cellular construct (Jong et al. 2004) that promoted tumor replication and development of B16.F10 cells after injection into the scaffold. The time period it took for the scaffold to organize its cells and support tumor mass formation exceeded the dimensions and time it took cancer cells to develop in the bead, sponge and matrix scaffolding (data not shown) (Goodwin et al. 1997; Becker and Blanchard 2007). We observed that tumors did not need the extracellular matrix “stiffness” or basement membrane to proliferate or survive in this environment (Griffith and Swartz 2006). However, results of this study provided evidence that B16.F10 cells can promote synthesis of extracellular matrix. This suggests that the cells were functional and that there was signaling between B16.F10 and HaCaT. Natural occurring HaCaT cells react similar in the 3D model regulating B16.F10 growth and survival through cell-cell interaction, promoting the production of extracellular matrix, displaying organized growth patterns and formation of dendrite-like processes (Li and Herlyn 2000; Hindie et al 2006, Hsu et al. 2002). HaCaT and B16.F10 cells remained viable in the center of the scaffold because they received even exchange of nutrients and oxygen while rotating in this system uninterrupted. The heavily pigmented cells located in the center of the scaffold did not appear necrotic over a 10-15 day period (data not shown). Additionally, the physical rotation of cells in the HARV promoted aggregation formation facilitating “normal” cellular behavior in a well controlled, reproducible environment (Hammond and Hammond 2001, Becker and Blanchard 2007; Fischbach et al. 2007). There are many factors that can be controlled to ensure that cells behave in a desirable manner including salt, pH, protein concentrations, ligand/receptor concentration, temperature, adhesive properties, and oxygen solubility (Griffith and Swartz 2006). Cellular behavior that reacts to specifically enhanced stimulus can be measured by obtaining multiple samples from the 3D culture without jeopardizing the integrity of the experiment. This system is beneficial because it decreases live animal experiments, increases ability to evaluate different aspects of 3D cellular environment, increase sampling size between assays, can isolate particular cells systems and control experimental conditions for desired experimental analysis.
We are currently using this model to establish treatment regimens that can be translated into in vivo cancer treatments. This model can be used for other applications such as understanding tumorgenic properties, how tumor cells react in the absence of an immune response and how cells react in the presence of other stimuli that promote or inhibit tumor development. The information gathered from an immune absent environment can be used and compared to similar reactions that occur in NUDE or SCID mouse models (Fischbach et al. 2007). This model can help investigators study proteins that are present during tumorogenesis such as FGF, VEGF, and interleukin 8, signifying that tumor cells can promote their own angiogenic properties. Additionally, at the DNA level investigators may be interested in specific gene expression, mutations, and cell signaling such as autocrine loop activity that regulates tumorgenesis. This 3D model could also help uncover the differences in cellular properties between a 3D and 2D model, in the hopes of discovering new information about cells grown in vitro (Hammond and Hammond 2001, Licato et al. 2001, Griffith and Swartz 2006; Becker and Blanchard 2007; Fischbach et al. 2007; Ghosh and Maity 2007; Yamada and Cukierman 2007). Future studies utilizing this 3D model can include identifying clinical therapies for wound healing, plastic surgery, organ transplantation, species specific diseases, and toxicity of drugs (Licato et al. 2001, Griffith and Swartz 2006).
Figure 6.
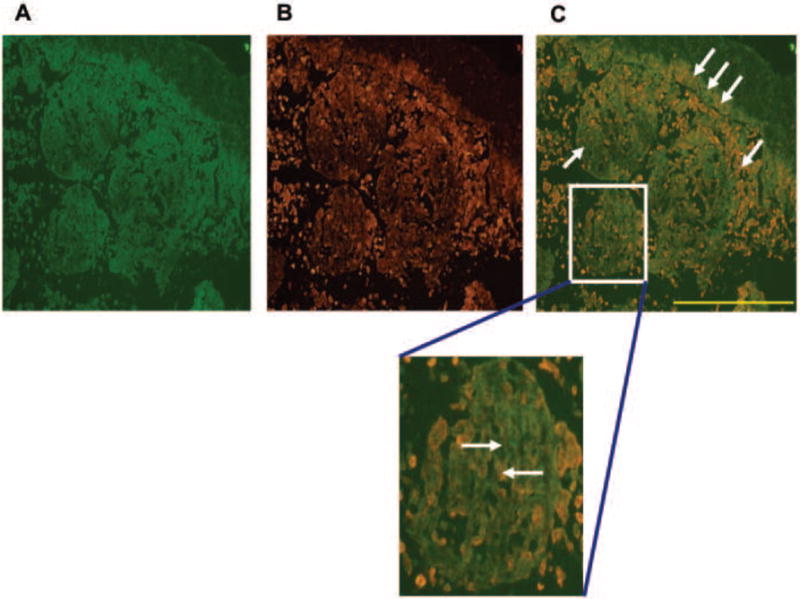
Panel 1: Double IF assay Fluorescence Scope 200x mag. (A) B16.F10 cells were labeled with FITC emited a green color and (B) HaCaT were labeled with TRITC emitting a red color. (C) Merged image showing localization of B16.F10 relative to HaCaT. The single arrows show location of B16.F10 and HaCaT separately. The three arrows show stacking of B16.F10 on top of HaCaT forming a wall-like barrier. The enlarged image emphasizes that HaCaT are providing the template for B16.F10 interaction and development. Results are representative of 3 replicate experiments.
Panel 2: Double IF assay 200x mag. (A) B16.F10 labeled with FITC. The enlarged image displays a closer view of changes in B16.F10 cellular morphology. Arrows show B16.F10 flattening and production of dendritic-like processes. (B) HaCat labeled with TRITC and (C) shows a merged image of overlapping cells growing on top, integrated or adjacent to one another. Results are representative of 3 replicate experiments.
Acknowledgments
This work was supported by grants from the National Institutes of Health (1F31CA119950-01A2) and National Aeronautics and Space Administration (NNJ05HE62G). Don Cameron Ph.D., University of South Florida for his assistance in the initial use of the HARVs. Mary Zhang Ph.D., for the gift of NIH3T3 cells. Mark J. Jaroszeski, Ph.D. for the gift of HaCaT cells. USF Health histology core for their assistance. The Frank Reidy Bioelectrics Research Center for the use of Olympus Microscope and Camera.
References
- Becker JL, Blanchard DK. Characterization of Primary Breast Carcinomas Grown in Three-Dimensional Cultures. J of Surgi Res. 2007;142(2):256–262. doi: 10.1016/j.jss.2007.03.016. [DOI] [PubMed] [Google Scholar]
- Coolen NA, Verkerk M, Reijnen L, Vlig M, Van den Bogaerdt AJ, Breetveld M, Gibbs S, Middelkoop E, Ulrich MM. Culture of keratinocytes for transplantation without the need of feeder layer cells. Cell Transplant. 2007;16(6):649–61. [PubMed] [Google Scholar]
- Christofori G, Semb H. The role of the cell-adhesion molecule E-cadherin as a tumor-suppressor gene. Trends Biochem Sci. 1999;24(2):73–6. doi: 10.1016/s0968-0004(98)01343-7. [DOI] [PubMed] [Google Scholar]
- Doolin EJ, Geldziler B, Strande L, Kain M, Hewitt C. Effects of microgravity on growing cultured skin constructs. Tissue Eng. 1999;5(6):573–82. doi: 10.1089/ten.1999.5.573. [DOI] [PubMed] [Google Scholar]
- Fang D, Herlyn M. The dynamic roles of cell-surface receptors in melanoma development. Humana Press Inc; Totowa NJ: 2006. [Google Scholar]
- Fischbach C, Chen R, Matsumoto T, Schmelzle T, Brugge JS, Polverini PJ, Mooney DJ. Engineering tumor with 3D scaffolds. Nature Methods. 2007;4(10):855–860. doi: 10.1038/nmeth1085. [DOI] [PubMed] [Google Scholar]
- Freed LE, Vunjak-Novakovic G. Microgravity Tissue Engineering. In vitro Cell Dev Biol. 1997;33:381–385. doi: 10.1007/s11626-997-0009-2. [DOI] [PubMed] [Google Scholar]
- Ghosh S, Maity P. Augmented antitumor effects of combination therapy with VEGF antibody and cisplatin on murine B16F10 melanoma cells. Int Immunopharmacol. 2007;7(13):1598–608. doi: 10.1016/j.intimp.2007.08.017. [DOI] [PubMed] [Google Scholar]
- Gao H, Ayyaswamy PS, Ducheyne P. Dynamics of a microcarrier Particle in the Simulated Microgravity Environment of a Rotating-Wall Vessel. Microgravity Sci Technol. 1997;9(3):154–165. [PubMed] [Google Scholar]
- Goodwin TJ, Prewett TL, Wolf DA, Spaulding GF. Reduced shear stress: a major component in the ability of mammalian tissues to form three-dimensional assemblies in simulated microgravity. J Cell Biochem. 1993;51(3):301–11. doi: 10.1002/jcb.240510309. [DOI] [PubMed] [Google Scholar]
- Goodwin TJ, Prewett TL, Spaulding GF, Becker JL. Three-dimensional culture of a mixed mullerian tumor of the ovary: expression of in vivo characteristics. In Vitro Cell Dev Biol Anim. 1997;33(5):366–74. doi: 10.1007/s11626-997-0007-4. [DOI] [PubMed] [Google Scholar]
- Griffith LG, Swartz MA. Capturing complex 3D tissue physiology in vitro. Nature Reviews Molecular Cell Biology. 2006;7:211–224. doi: 10.1038/nrm1858. [DOI] [PubMed] [Google Scholar]
- Hammond TG, Hammond JM. Optimized suspension culture: the rotating-wall vessel. Am J Physiol Renal Physiol. 2001;281:F12–F25. doi: 10.1152/ajprenal.2001.281.1.F12. [DOI] [PubMed] [Google Scholar]
- Hindie M, Vayssade M, Dufresne M, Queant S, Warocquier-Clerout R, Legeay G, Vigneron P, Oliver V, Duval J-L, Nagel M-D. Interactions of B16F10 melanoma Cells Aggregated on a cellulose substrate. J Cell Biochem. 2006;99:96–104. doi: 10.1002/jcb.20833. [DOI] [PubMed] [Google Scholar]
- Hsu MY, Meier FE, Herlyn M. Melanoma development and progression: a conspiracy between tumor and host. Differentiation. 2002;70:522–536. doi: 10.1046/j.1432-0436.2002.700906.x. [DOI] [PubMed] [Google Scholar]
- Hsu MY, Meier FE, Nesbit M, Hsu JY, Van Belle P, Elder DE, Herlyn M. E-cadherin expression in melanoma cells restores keratinocyte-mediated growth control and down-regulates expression of invasion-related adhesion receptors. Amer J of Path. 2000;156(5):1515–25. doi: 10.1016/S0002-9440(10)65023-7. [DOI] [PMC free article] [PubMed] [Google Scholar]
- Ingram M, Techy GB, Saroufeem R, Yazan O, Narayan KS, Goodwin TJ, Spaulding GF. Three-dimensional growth patterns of various human tumor cell lines in simulated microgravity of a NASA bioreactor. In Vitro Cell Dev Biol Anim. 1997;33(6):459–66. doi: 10.1007/s11626-997-0064-8. [DOI] [PubMed] [Google Scholar]
- Jong BK, Robert S, O’Hare MJ. Three-dimensional in vitro tissue culture models of breast cancer – a review Breast Cancer Research and Treatment. 2004;85:281–291. doi: 10.1023/B:BREA.0000025418.88785.2b. [DOI] [PubMed] [Google Scholar]
- Li G, Herlyn M. Dynamics of intracellular communication during melanoma development. Mol Med Today. 2000;6:163–169. doi: 10.1016/s1357-4310(00)01692-0. [DOI] [PubMed] [Google Scholar]
- Li G, Satyamoorthy K, Herlyn M. Dynamics of cell interactions and communications during melanoma development. Crit Rev Oral Bio Med. 2002;13(1):62–70. doi: 10.1177/154411130201300107. [DOI] [PubMed] [Google Scholar]
- Licato LL, Prieto VG, Grimm EA. A novel preclinical model of human malignant melanoma utilizing bioreactor rotating wall-vessels. In vitro Cell Dev Biol-Animal. 2001;37:121–126. doi: 10.1290/1071-2690(2001)037<0121:ANPMOH>2.0.CO;2. [DOI] [PubMed] [Google Scholar]
- Mengus-Feder C, Ghosh S, Reschner A, Martin I, Spagnoli GC. New dimensions in tumor immunology: what does 3D culture reveal? Trends in Molecular Medicine. 2008;14(8):333–340. doi: 10.1016/j.molmed.2008.06.001. [DOI] [PubMed] [Google Scholar]
- Nakamura K, Kuga H, Morisaki T, Baba E, Sato N, Mizumoto K, Sueishi K, Tanaka M, Katano M. Simulated microgravity culture system for a 3-D carcinoma tissue model. Biotechniques. 2002;33(5):1068–70. 1072, 1074–6. doi: 10.2144/02335rr02. [DOI] [PubMed] [Google Scholar]
- Rovee DT, Maibach HI. The Epidermis in Wound Healing. Informa Health Care. 2004:408. [Google Scholar]
- Schoop VM, Mirancea N, Fusenig NE. Epidermal organization and differentiation of HaCaT keratinocytes in organotypic coculture with human dermal fibroblasts. J Invest Dermatol. 1999;112:343–353. doi: 10.1046/j.1523-1747.1999.00524.x. [DOI] [PubMed] [Google Scholar]
- Smalley KSM, Lioni M, Herlyn M. Life isn’t flat: Taking Cancer Biology to the Next Dimension. Invitro Cell & Dev Biolo. 2006;42(8-9):242–247. doi: 10.1290/0604027.1. [DOI] [PubMed] [Google Scholar]
- Smalley KSM, Bradfford PA, Herlyn M. Selective evolutionary pressure from the tissue microenvironment drives tumor progression. Semi in Can Bio. 2005;15:451–459. doi: 10.1016/j.semcancer.2005.06.002. [DOI] [PubMed] [Google Scholar]
- Stark HJ, Baur M, Breitkreutz D, Mirancea N, Fusenig ME. Organotypic keratinocyte cocultures in defined medium regular epiderma; morphogenesis and differentiation. J of Invest Derma. 1999;112(5):681–691. doi: 10.1046/j.1523-1747.1999.00573.x. [DOI] [PubMed] [Google Scholar]
- Sudbeck BD, Pilcher BK, Welgus HG, Parks WC. Induction and Repression of Collagenase-1 by Keratinocytes Is Controlled by Distinct Components of Different Extracellular Matrix Compartments. The J of Biol Chem. 1997;272(35):22103–22110. doi: 10.1074/jbc.272.35.22103. [DOI] [PubMed] [Google Scholar]
- Swartz RP, Goodwin TJ, Wolf DA. Cell culture for three-dimensional modeling in rotating-wall vessels: an application of simulated microgravity. J Tiss Culture Meth. 1992;14:51–58. doi: 10.1007/BF01404744. [DOI] [PubMed] [Google Scholar]
- Synthecon Incorporation. [28 June 2007];2007 http://www.synthecon.com.
- Yamada KM, Cukierman E. Modeling Tissue Morphogenesis and Caner in 3D. Cell. 2007;130:601–610. doi: 10.1016/j.cell.2007.08.006. [DOI] [PubMed] [Google Scholar]