Abstract
Skeletal muscle wasting is an important public health problem associated with aging, chronic disease, cancer, kidney dialysis, and HIV/AIDS. 1,25-Dihydroxyvitamin D (1,25-D3), the active form of vitamin D, is widely recognized for its regulation of calcium and phosphate homeostasis in relation to bone development and maintenance and for its calcemic effects on target organs, such as intestine, kidney, and parathyroid glands. Emerging evidence has shown that vitamin D administration improves muscle performance and reduces falls in vitamin D-deficient older adults. However, little is known of the underlying mechanism or the role 1,25-D3 plays in promoting myogenic differentiation at the cellular and/or molecular level. In this study, we examined the effect of 1,25-D3 on myoblast cell proliferation, progression, and differentiation into myotubes. C2C12 myoblasts were treated with 1,25-D3 or placebo for 1, 3, 4, 7, and 10 d. Vitamin D receptor expression was analyzed by quantitative RT-PCR, Western blottings and immunofluorescence. Expression of muscle lineage, pro- and antimyogenic, and proliferation markers was assessed by immunocytochemistry, PCR arrays, quantitative RT-PCR, and Western blottings. Addition of 1,25-D3 to C2C12 myoblasts 1) increased expression and nuclear translocation of the vitamin D receptor, 2) decreased cell proliferation, 3) decreased IGF-I expression, and 4) promoted myogenic differentiation by increasing IGF-II and follistatin expression and decreasing the expression of myostatin, the only known negative regulator of muscle mass, without changing growth differentiation factor 11 expression. This study identifies key vitamin D-related molecular pathways for muscle regulation and supports the rationale for vitamin D intervention studies in select muscle disorder conditions.
Vitamin D deficiency has been linked to fractures from falling, mainly in the older population, as a consequence of muscle weakness and waste (1). Common clinical manifestations of vitamin D deficiency in relation to muscle include symmetric low back pain, proximal muscle weakness, and muscle aches (2, 3).
Vitamin D deficiency correlates with a substantial decline in physical performance (4). Observational studies support a positive association between vitamin D levels and muscle strength and/or lower extremity function in both active and inactive older adults (5–7). In one report, over 90% of patients presented to a community clinic, with nonspecific musculoskeletal pain, were found to have vitamin D deficiency (8). Moreover, the vitamin D receptor (VDR) is expressed in human muscle tissue (9), which provides a rationale for a direct role of vitamin D in muscle function. Muscle biopsies in adults with profound vitamin D deficiency showed predominantly type II (fast-twitch) muscle, which may help explain the falling tendency of vitamin D-deficient elderly individuals (10). It has been reported that 1,25-dihydroxyvitamin D (1,25-D3) induces genomic effects, leading to the synthesis of new proteins that affect muscle cell contractility, proliferation, and differentiation (11). Furthermore, mice lacking the VDR show a skeletal muscle phenotype with smaller and variable muscle fibers and persistence of immature muscle gene expression during adult life, suggesting a role of vitamin D in muscle development (12, 13). However, little is known of the underlying mechanism or the role it plays in association with myogenic differentiation.
Vitamin D, a fat-soluble secosteroid prohormone, is obtained from sun exposure or from dietary sources. During exposure to sunlight 7-dehydrocholesterol in the skin is converted to previtamin D3, which is immediately converted by a heat-dependent process to vitamin D3. Vitamin D2 and vitamin D3 from dietary sources are incorporated into chylomicrons, transported by the lymphatic system into the venous circulation. Vitamin D in the circulation is bound to the vitamin D-binding protein, which transports it to the liver, where vitamin D is converted by the vitamin D-25 hydroxylase to 25-hydroxivitamin D3. 25-Hydroxivitamin D3 is biologically inactive and is converted primarily in the kidney by the 25-hydroxyvitamin D-1α-hydroxylase to its biologically active form 1,25-D3 or calcitriol (14).
Mouse C2C12 skeletal muscle cells are an “in vitro” system widely used to study genes that regulate muscle growth and differentiation (15–17). C2C12 myoblast cells differentiate rapidly, forming contractile myotubes and producing characteristic muscle proteins (16, 17).
The aim of the present study was to test the hypothesis that 1,25-D3 promotes myogenic cell differentiation and to determine the associated molecular mechanism(s). This was done by investigating the expression of key pro- and anti-cell differentiation lineage markers and select growth factors modulated by 1,25-D3 in a well-known and widely used skeletal muscle cell line model.
Materials and Methods
Cell culture
The mouse C3H myoblast cell line C2C12 (CRL-1772; American Type Culture Collection, Manassas, VA) was propagated in DMEM supplemented with 10% dialyzed fetal bovine serum (FBS) at 37 C and 5% CO2 (14, 15) at 40–50% confluence in T75 flasks. FBS is dialyzed by tangential flow filtration using 10,000 MW cutoff filters; this procedure eliminates many low molecular weight hormones and cytokines that could impact the cell culture. Cells were distributed on the appropriate plates for each assay (Lab-Tek chamber slides two-, four-, eight-, or six-well plates; Thermo Fisher Scientific Inc., Rockford, IL). The next day, cells were incubated or not with 100 nm of 1,25-D3 (Sigma-Aldrich, St. Louis, MO) dissolved in less than 0.1% ethanol as vehicle in DMEM 10% dialyzed FBS for 1–10 d. The 100 nm concentration of 1,25-D3 employed in the experimental design was based on our prior dose-response studies and is in alignment with a commonly used dose used in the majority of publications related to 1,25-D3 effects on different cell lines or even in primary cell cultures (18–23). Because of the 10-h half-life of 1,25-D3, the cell culture media, incubated or not with 1,25-D3 (100 nm), were replaced daily (18).
Detection of VDR by immunofluorescence (IF)
At the completion of the incubation time, treated and untreated cells were washed thrice with PBS (1×) and fixed by immersion in 2% p-formaldehyde. The nonspecific binding sites/epitopes were blocked with 10% normal goat serum and incubated with an affinity purified rabbit polyclonal antibody raised against a peptide mapping at the C terminus of VDR at a dilution of 1:50 (Santa Cruz Biotechnology, Inc., Santa Cruz, CA). The detection was followed by a 1:200 dilution of antirabbit biotinylated secondary antibody (Calbiochem, La Jolla, CA), followed by Streptavidin-fluorescein isothiocyanate (FITC) (10 μg/ml; Vector Laboratories, Burlingame, CA). After several washes, the slides were detached and counterstained/mounted in “vectashield” mounting medium with 4′,6-diamidino-2-phenylindole (DAPI) (Vector Laboratories). The merge image was obtained by fusing the green (FITC) and the blue (DAPI) filters pictures. Fields were photographed with a SPOT-RT digital camera and acquisition software (Diagnostic Instruments, Sterling Heights, MI). Negative controls were done by either omitting the first antibody or using a rabbit nonspecific IgG (18).
PCR array analysis of skeletal muscle growth and differentiation factors
RT2 Profiler PCR pathway focused arrays (SABiosciences Corp., Frederick, MD) were applied in triplicate to detect changes in gene expression of skeletal muscle growth and differentiation factors. Total RNA from C2C12 cells control (untreated) and treated with 1,25-D3 (100 nm) for 4 d were isolated with Trizol-Reagent (Invitrogen, Carlsbad, CA). Total RNA aliquots were converted by RT, and the resulting cDNA were subjected to the Mouse Growth Factor (PAMM-041) and the Mouse Skeletal Muscle: Myogenesis & Myopathy (PAMM-099) PCR arrays (SABiosciences Corp.). The mouse growth factor RT2 Profiler PCR array contains genes related to growth factors that play vital roles in various normal biological processes, such as embryogenesis, wound healing, and inflammation. The Mouse Skeletal Muscle: Myogenesis & Myopathy RT2 Profiler PCR array contains genes related to skeletal muscle differentiation, function, and disease-related processes. Real-time PCR were performed as follows: melting for 10 min at 95 C, 40 cycles of two-step PCR, including melting for 15 sec at 95 C, annealing for 1 min at 60 C. The raw data were analyzed using the ΔΔCt (cycle threshold) method following the manufacturer's instructions (SABiosciences Corp.) (18, 19).
Real-time quantitative PCR
Total RNA was extracted using Trizol-Reagent (Applied Biosystems, Foster City, CA) and equal amounts (1 μg) of RNA were reverse transcribed using the RT2 First Strand kit (CO-3) (SABiosciences Corp.). Mouse gene PCR primer sets (RT2) for VDR, IGF-I, IGF-II, myostatin (Mstn), and follistatin (Fst) were obtained from SABiosciences Corp. The QIAGEN RT2 SYBR Green/ROX qPCR Master Mix (QIAGEN, Valencia, CA) was used with the ABI Step One Plus PCR thermocycler and fluorescent detector lid (Applied Biosystems) (18, 19). The protocol included melting for 15 min at 95 C, 40 cycles of two-step PCR including melting for 10 min at 95 C, 40 cycles of two-step PCR, including melting for 15 sec at 95 C, annealing for 1 min at 60 C. Samples of 25 ng of cDNA were analyzed in triplicate in parallel with glyceraldehide-3-phosphate dehydrogenase (GAPDH) and ribosomal protein, large P1, (data not shown) controls; standard curves (threshold cycle vs. log picogram of cDNA) were generated by log dilutions from 0.1 pg to 100 ng of standard cDNA (RT mRNA from C2C12 cells in growth medium). Experimental mRNA starting quantities were then calculated from the standard curves and averaged as previously described (17, 18). The ratios of marker experimental gene (e.g. VDR, IGF-I, IGF-II, Mstn, and Fst mRNA) to GAPDH mRNA were computed and normalized to control (untreated) samples as 100%.
Immunocytochemical analyses of proliferating cell nuclear antigen (PCNA), myogenic markers, and Mstn
After the corresponding incubation time with or without 1,25-D, cells were washed five times with PBS (1×) and fixed by immersion in 2% p-formaldehyde, quenched with H2O2, blocked with normal goat or horse serum, and incubated with the following antibodies: anti-PCNA monoclonal antibody (1:400; Millipore, Billerica, MA), antimyoblast determination (MyoD) rabbit polyclonal antibody (1:500; Santa Cruz Biotechnology, Inc.), antidesmin (1:100) and antimyosin heavy chain (MHC) type II (1:100) rabbit polyclonal antibodies (Abcam, Inc., Cambridge, MA), and anti-Mstn rabbit polyclonal antibody (1:200; Millipore, Temecula, CA). Detection was based on a secondary biotinylated antimouse or antirabbit antibody (1:200), followed by addition of the streptavidin-horseradish peroxidase avidin and biotinylated horseradish macromolecular complex (1:100), Vectastain (Elite ABC System; Vector Laboratories), and peroxidase substrate kit (Vector Laboratories). The cells were counterstained with Hematoxylin QS (Vector Laboratories). Negative controls were done by either omitting the first antibody or using a rabbit nonspecific IgG. To ensure specific staining of VDR and Mstn antibodies, negative controls were done by preabsorbing the primary antibodies with specific synthetic peptides. After 1 h of incubation at room temperature, the mixtures were centrifuged at full speed for 15 min, and the supernatants were used as primary antibodies at the same dilution used previously for the experiment. No positive staining was observed in the cells by immunocytochemistry (ICC) in those negative controls (19).
Western blot and densitometry analyses
Cell lysates (30–60 μg of protein) were subjected to Western blot analyses after separation of proteins on 4–15% Tris-HCl polyacrylamide gradient gels by electrophoresis (Bio-Rad, Hercules, CA) in running buffer (Tris, glycine, and sodium dodecyl sulfate). Proteins were horizontally transferred for 3 h to nitrocellulose membranes in transfer buffer (Tris, glycine, and methanol). The nonspecific binding was blocked by immersing the membranes into 5% nonfat dried milk, 0.1% (vol/vol) Tween 20 in 1× PBS overnight at 4 C. After several washes with washing buffer (PBS Tween 0.1%), membranes were incubated with the primary antibodies for 3 h at room temperature or overnight at 4 C, monoclonal antibodies were as follows: 1) PCNA (1:500) and 2) GAPDH (1:10,000; Millipore). Polyclonal antibodies were used for: 1) VDR (1:500; Santa Cruz Biotechnology, Inc.), 2) Mstn (1:500; Millipore), 3) IGF-I (1:500), 4) IGF-II (1:500), and 5) Fst (1:800; Abcam, Inc.). The washed membranes were incubated for 1 h at room temperature with 1:3000 dilution (antimouse) or 1:2000 dilution (antirabbit) of secondary antibody linked to horseradish peroxidase, respectively (Cell Signaling Technology, Inc., Danvers, MA). After several washes, the immunoreactive bands were visualized using the Amersham Enhanced Chemiluminescence Western blotting detection system (GE Healthcare, Buckinghamshire, UK). The densitometry analysis of the bands was done with ImageJ 1.40g Image software (National Institute of Health, Bethesda, MD) (18, 19).
Qualitative and quantitative immunocytochemical analyses
The immunoreactivity was quantified by Image Analysis using ImagePro-Plus 5.1 software (Media Cybernetics, Silver Spring, MD). Fields were counted blindly by two independent observers, and each experiment was repeated thrice. For PCNA and MyoD determinations, the number of positive cells at ×400 was counted in a computerized grid, and results were expressed as a percentage of positive cells per field. For desmin, and Mstn determinations, once the images were calibrated for background lighting, integrated optical density (IOD) was determined. The IOD results are proportional to the mean optical density per area and determine the amount of immunoreactive antigen present in each cell. The IOD values are expressed in arbitrary units and were determined in at least 20 pictures at ×400 per treatment and time points. For MHC type II determinations, the diameter defined as (mean) average length of diameters was measured at two-degree intervals and passing through objects centroid. Size (width) was measured and defined as feret diameter (i.e. caliper length) along minor axis of object. Diameter and size (width) of MHC positive cells were determined in at least 20 pictures at ×200 per treatment and time points. The results expressed as mean ± sem represent the average of three independent experiments (18, 19, 24).
Statistical analysis
All data are presented as mean ± sem. Multiple comparisons were analyzed by a one-way ANOVA (or t test). If the overall ANOVA revealed significant differences, then pair-wise comparisons between groups were performed by Tukey multiple comparison test. All comparisons were two-tailed, and P values of less than 0.05 were considered statistically significant. In vitro experiments were repeated thrice, and data from representative experiments are shown. Specifically, the RT2 Profiler PCR arrays were done in triplicate and in some cases confirmed by real-time quantitative PCR done in triplicate. For PCR array and real-time PCR analysis, we consider significant changes in gene expression values of ±2.0-fold change respect to control.
Results
Time course of expression and nuclear translocation of VDR in C2C12 skeletal muscle cells upon incubation with 1,25-D3
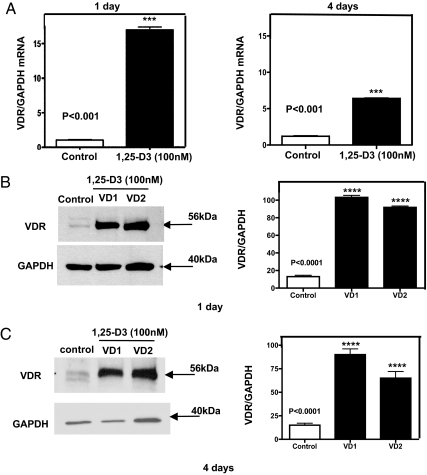
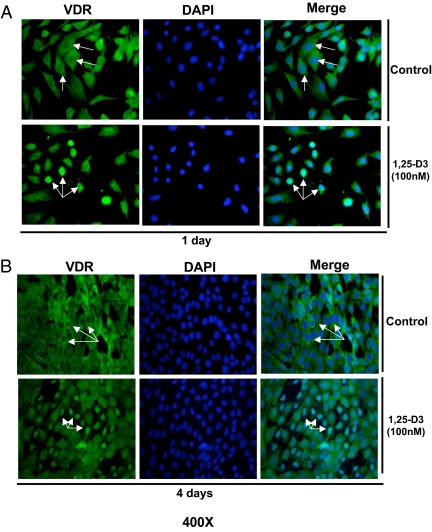
To determine whether the C2C12 skeletal muscle cells expressed VDR at a basal level and whether its expression and nuclear translocation is induced upon incubating the cells with 1,25-D3, experiments using quantitative real-time PCR, Western blottings, and IF were carried out at different time points. C2C12 skeletal muscle cells were continuously incubated or not with 1,25-D3 (100 nm) for 1 and 4 d. The increased expression of VDR after incubation with 1,25-D3 was demonstrated by real-time PCR [quantitative RT-PCR (qRT-PCR)] (Fig. 1A). VDR mRNA expression was increased by 15.1- and 6.4-fold at 1 and 4 d, respectively, compared with the controls (no 1,25-D3 addition). The increased expression of VDR after 1,25-D incubation at 1 and 4 d was further confirmed by Western blot analyses using whole-cell culture homogenates under the same conditions as above. The densitometric analysis of the bands showed an increased VDR expression upon incubation with 1,25-D at 1 and 4 d by 5- and 3.6-fold, respectively (Fig. 1, B and C). IF studies showed, both at 1 and 4 d, a basal cytoplasmic localization of VDR receptor (green). At 1 d, and even more evident after 4 d of 1,25-D3 incubation, most of the green-fluorescence staining corresponding to VDR was localized in the nucleus (Fig. 2, A and B). The counterstaining with DAPI (blue) and the merge of green and blue pictures confirmed the nuclear translocation/localization of VDR.
Fig. 1.
Steady-state mRNA and protein up-regulation levels of VDR expression upon incubation of C2C12 cells with 1,25-D3. Cultures of C2C12 cells were incubated or not with 1,25-D3 (100 nm) for 1 and 4 d. Total RNA and whole-protein extracts were isolated for qRT-PCR and Western blottings, respectively. A, Mean ± sem corresponds to experiments done in triplicate; ***, P < 0.001 and Western blottings. B and C, Mean ± sem corresponds to experiments done in triplicate; ****, P < 0.0001 at 1 and 4 d, respectively. VD1 and VD2 are different pools of two samples each. In both cases, real-time PCR and Western blottings, samples and controls were normalized with GAPDH housekeeping gene. VD, Vitamin treated cells whole extracts; VDR, vitamin D receptor.
Fig. 2.
Expression and nuclear translocation of VDR upon incubation of C2C12 cells with 1,25-D3. Cultures of C2C12 cells were treated as in Fig. 1 in four-well removable chamber slides and subjected to IF using a polyclonal antibody for VDR followed by a FITC-conjugated secondary antibody (green). Cells were counterstained with DAPI (blue) to show nuclear localization. Merge pictures were done combining the green and blue pictures together to show nuclear translocation of VDR. Magnification, ×400. A, Cells incubated or not with 1,25-D3 for 1 d. B, Cells incubated or not with 1,25-D3 for 4 d.
1,25-D3 inhibits cell proliferation of C2C12 skeletal muscle cells
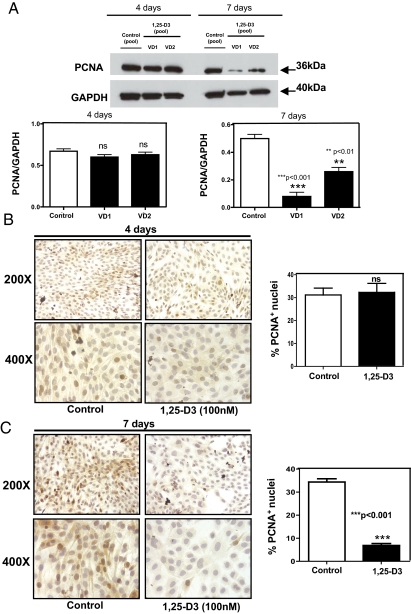
To evaluate the effects of 1,25-D3 on cell proliferation, C2C12 skeletal muscle cells were incubated with or without 1,25-D3 (100 nm) for 4 and 7 d. At the end of the respective incubation times, proliferation was evaluated by determining the expression of PCNA by Western blotting and ICC. C2C12 skeletal muscle cells incubated with 1,25-D for 4 d did not show any significant differences in PCNA expression with respect to control cells (Fig. 3, A and B). On the contrary, cells incubated with 1,25-D3 for 7 d showed a 75% reduction in the expression of PCNA by Western blotting. (Fig. 3A). The Western blotting results were further confirmed by ICC (Fig. 3C), where quantitative image analysis of the pictures at 7 d showed a reduction in 85% with respect to the control (P < 0.001).
Fig. 3.
1,25-D3 down-regulates the expression of PCNA. Cultures of C2C12 cells were treated as in Fig. 1 for 4 and 7 d. Western blottings and ICC reactions for PCNA were performed at the end of the incubation time. A, Western blots analysis was performed for whole-protein extracts at 4 and 7 d with different pools of samples (VD1 and VD2) done in triplicate with the corresponding densitometric analysis; ***, P < 0.001 and **, P < 0.01. B, Representative ICC pictures with the corresponding image analysis expressing percentage of positive cells (brown nuclear staining) for experiments done in triplicate at 4 d. C, Representative ICC pictures with the corresponding image analysis expressing percentage of positive cells (brown nuclear staining) for experiments done in triplicate at 7 d; ***, P < 0.001. Magnification, ×200 and ×400. ns, Not significant; VD, vitamin treated cells whole extracts.
1,25-D3 enhances myogenesis in C2C12 skeletal muscle cells
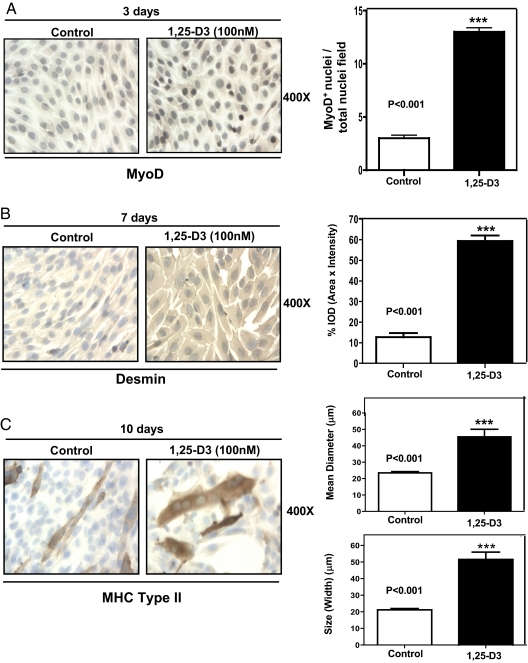
To demonstrate that 1,25-D3 promotes myogenic differentiation in C2C12 myoblasts, we evaluated the expression of sequential myogenic markers such as MyoD, desmin, and MHC type II at different time points by ICC followed by quantitative image analysis. Figure 4A shows that 3 d upon continuous incubation with 1,25-D3, an increased expression of the early myogenic marker MyoD was observed in the nucleus of C2C12 cells. This observation was confirmed by quantitative image analysis (Fig. 4A, right panel), where MyoD expression was significantly increased by 4-fold with respect to the control (P < 0.001). The expression of desmin, an intermediate myogenic marker, also was increased after 7 d of continuous incubation with 1,25-D3. As in the previous case, the visual inspection was confirmed by quantitative image analysis (Fig. 4B, right panel), where desmin expression was increased by 6-fold with respect to the control (P < 0.001). After 10 d of incubating the cells with 1,25-D3, the positive MHC type II polynucleated myotubes showed a significant 2-fold increase in the mean diameter of the fibers (P < 0.001) and an increase by 2.5-fold in size (width) with respect to the control (P < 0.001); this is a clear indication of fiber hypertrophy as a consequence of 1,25-D3 incubation (Fig. 4C).
Fig. 4.
1,25-D3 stimulates myogenic differentiation in C2C12 cells. Cultures of C2C12 cells were treated as in Fig. 1 for 3, 7, and 10 d. A, Representative immunocytochemistry pictures of MyoD+ cells with the corresponding image analysis expressing the ratio between MyoD+ nuclei per total nuclei field for experiments done in triplicate at 3 d. ***, P < 0.001. B, Representative ICC pictures of desmin+ cells with the corresponding image analysis expressing percentage IOD (area × intensity) for experiments done in triplicate at 7 d; ***, P < 0.001. C, Representative ICC pictures of MHC type II+ cells with the corresponding image analysis expressing mean diameter (μm) and size (width) (μm) for experiments done in triplicate at 10 d; ***, P < 0.001. Magnification, ×400.
1,25-D3 enhances myogenic commitment by modulating the expression of pro- and antimyogenic growth factors in C2C12 skeletal muscle cells
The effect of 1,25-D3 on specific myogenic markers of cell differentiation and growth factors were evaluated at the steady-state mRNA level by applying the mouse skeletal muscle myogenesis and growth factor PCR arrays. Table 1 shows the differential steady-state mRNA levels between 1,25-D3 treated (4 d) and untreated cells for determinations done in triplicate after 4 d of incubation with 1,25-D3. The PCR array analysis showed positive up-regulation of the expression of the myogenic markers such as MyoD (+3.01) and desmin (+2.39). The 1,25-D3 promyogenic effects are even more evident in the case of myogenin, showing a positive value of +4.85 in spite of previous findings that showed that the peak of myogenin expression is around 7 d after the initial myogenic differentiation (25).
Table 1.
Differential steady-state mRNA levels of pro- and antimyogenic growth factors and myogenic markers between 1,25-D3 treated and untreated C2C12 cells
| Gene symbol | Description | Reference Sequence | Fold up-regulation (+) or down-regulation (−) | Confidence interval (95%) |
|---|---|---|---|---|
| MyoD | Myogenic differentiation-1 | NM_010866 | +3.01 | (1.40, 4.73)b |
| Myog | Myogenin | NM_031189 | +4.85 | (1.42, 8.29)a |
| Des | Desmin | NM_010043 | +2.39 | (1.65, 4.05)b |
| IGF-I | IGF-I | NM_010512 | −9.79 | (0.03, 0.23)b |
| IGF-II | IGF-II | NM_010514 | +7.84 | (1.37, 17.37)a |
| Mstn | Mstn (GDF-8) | NM_010834 | −3.98 | (0.00001, 0.88)a |
| GDF11 | GDF-11 | NM_010272 | +1.19 | (0.00001, 4.29) |
Total RNA from cells treated as in Fig. 1 for 4 d was subjected to RT real-time PCR by the growth factor PCR array, and the ratios between the 1,25-D3-treated and 1,25-D3-untreated cells corrected by GAPDH were calculated for assays performed in triplicate. Experiments were done in triplicate.
P < 0.05.
P < 0.001.
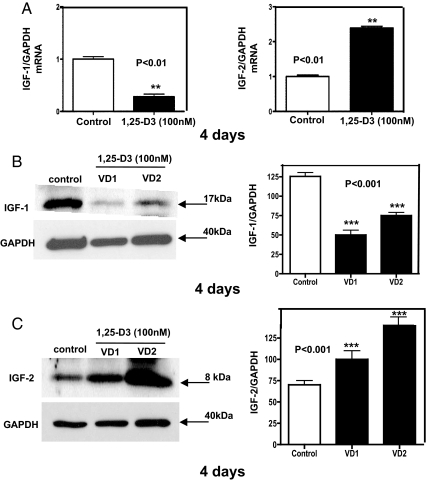
Changes in the expression of pro- and antimyogenic factors were also observed: 1) a down- regulation in the expression of IGF-I (−9.79), 2) an up-regulation in the expression of IGF-II (+7.84), and 3) most importantly, a marked down-regulation of Mstn (−3.98) and no significant change in growth differentiation factor 11 (GDF-11) (+1.19) expression, a TGFβ family member that shares a high level of homology with Mstn.
The decreased expression of IGF-I and the increased expression of IGF-II after 1,25-D3 incubation was further confirmed at 4 d by quantitative real-time PCR, where IGF-I expression decreased by 3-fold and IGF-II expression increased by 2.5-fold compared with the control (P < 0.01) (Fig. 5A). To confirm the previous results, not only at the steady-state mRNA level but also at the protein level, Western blottings with the respective densitometric analysis were done in triplicate for IGF-I (Fig. 5B) and for IGF-II (Fig. 5C). Similarly, a decreased expression of IGF-I and an increased expression of IGF-II were found by real-time PCR and Western blottings analysis after 7 d of incubation with 1,25-D3 (data not shown).
Fig. 5.
Steady-state mRNA and protein levels modulation of IGF upon incubation of C2C12 cells with 1,25-D3. Cultures of C2C12 cells were incubated as in Fig. 1 for 4 d. Total RNA and whole-protein extracts were isolated for qRT-PCR and Western blottings, respectively. A, Mean ± sem corresponds to experiments done in triplicate for IGF-I (left panel); **, P < 0.01 and IGF-II (right panel); **, P < 0.01. B, Western blottings with the respective densitometric analysis for IGF-I; ***, P < 0.001. C, Western blottings with the respective densitometric analysis for IGF-II; ***, P < 0.001. VD1 and VD2 correspond to different pools of two samples each. In both cases, real-time PCR and Western blottings, samples and controls were normalized with GAPDH housekeeping gene. VD, Vitamin treated cells whole extracts.
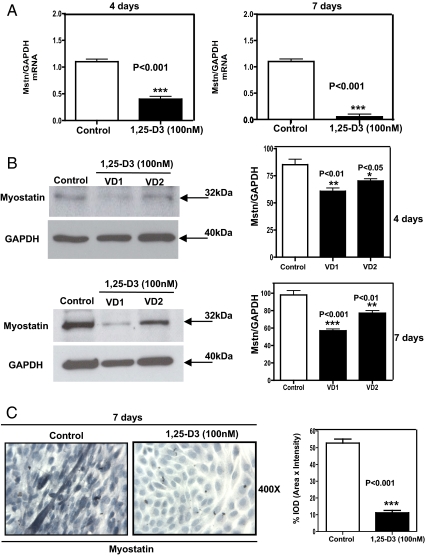
Because PCR arrays showed a decreased expression of Mstn upon incubating the cells with 1,25-D3, and because Mstn is the only known negative regulator of skeletal muscle mass, we further confirmed the PCR arrays by quantitative real-time PCR at d 4 and especially at d 7, where Mstn is highly expressed in C2C12 cells (16). The real-time PCR for Mstn performed at d 4 and 7 showed a remarkable decrease in Mstn expression by 2.5- and 10-fold, respectively, compared with the control (P < 0.001) (Fig. 6A). The decreased expression of Mstn at the protein level was shown by Western blottings, with the respective densitometric analysis, done in triplicate at 4 and 7 d (Fig. 6B). Moreover, ICC with the corresponding image analysis at 7 d revealed that Mstn was clearly localized primarily in the cytoplasm of control myotubes, and it was almost negligibly expressed in cells incubated with 1,25-D3 (Fig. 6C, left panel). The corresponding image analysis confirmed the visual observation showing that Mstn expression decreased by 5.5-fold compared with the control (P < 0.001) (Fig. 6C, right panel).
Fig. 6.
1,25-D3 down-regulates the expression of Mstn in C2C12 cells. Cultures of C2C12 cells were treated as in Fig. 1 for 4 and 7 d. Total RNA and whole-cell protein extracts were isolated for qRT-PCR and Western blottings, respectively. C2C12 were also subjected to Mstn ICC. A, Mean ± sem corresponds to experiments done in triplicate for Mstn at 4 d (left panel); ***, P < 0.001 and at 7 d (right panel); ***, P < 0.001. B, Western blottings with the respective densitometric analysis for Mstn at 4 d (upper panel); **, P < 0.01 and *, P < 0.05 and for 7 d (lower panel); **, P < 0.01 and ***, P < 0.01. VD1 and VD2 are different pools of two samples each. In both cases, qRT-PCR (A) and Western blottings (B), samples and controls were normalized with GAPDH housekeeping gene. C, Corresponds to representative ICC pictures of Mstn+ cells with the corresponding image analysis expressing percentage IOD (area × intensity) for experiments done in triplicate at 7 d; ***, P < 0.001. VD, Vitamin treated cells whole extracts.
1,25-D3 increases Fst expression in C2C12 skeletal muscle cells
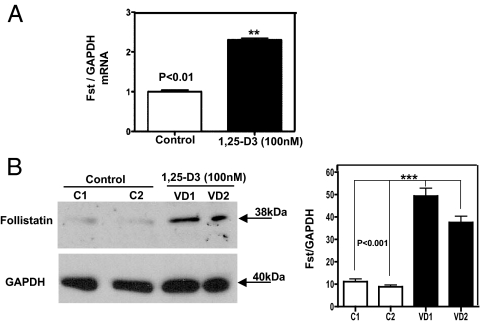
To determine whether Fst, which inhibits Mstn activity in vitro and “in vivo,” is involved in the mechanism by which 1,25-D3 promotes muscle growth, we investigated Fst expression in C2C12 myoblasts with and without 1,25-D3 incubation. Real-time qPCR revealed that after 4 d of continuous incubation with 1,25-D3, Fst expression was increased by 2.5-fold compared with controls (P < 0.01) (Fig. 7A). Because Mstn expression was substantially down-regulated at 7 d by 1,25-D3, we determined the expression of Fst at the protein level by Western blotting. Figure 7B shows that the expression of Fst was up-regulated by 4.5-fold compared with controls, suggesting that 1,25-D3 promotes myogenic differentiation by inhibiting Mstn activity, possibly through an increase in Fst expression.
Fig. 7.
Steady-state mRNA and protein up-regulation levels of Fst expression upon incubation of C2C12 cells with 1,25-D3. Cultures of C2C12 cells were incubated as in Fig. 1 for 4 and 7 d. Total RNA and whole-protein extracts were isolated for qRT-PCR and Western blottings. VD1 and VD2 are different pools of two samples each. Mean ± sem corresponds to experiments done in triplicate; **, P < 0.01 and ***, P < 0.001. A, Cells incubated or not with 1,25-D3 for 1 d. B, Cells incubated or not with 1,25-D3 for 4 d. VD, Vitamin treated cells whole extracts; C, control cells, non-incubated with 1,25-D3. C1 and C2 correspond to different pools of two samples each.
Discussion
The data presented in this manuscript demonstrate that the addition of 1,25-D3 to C2C12 skeletal muscle cells decreases cell proliferation and enhances myogenic differentiation through an increased expression and nuclear translocation of the VDR and modulation of pro- and antimyogenic factors. The increase in VDR expression, to some extent, is expected, because it is known that 1,25-D3 autoregulates the expression of the VDR gene through intronic and upstream enhancers (26).
We demonstrated that the 1,25-D3 effect on C2C12 skeletal muscle cell line involves 1) an up-regulation of IGF-II expression, 2) a down-regulation of IGF-I expression, 3) an up-regulation of Fst expression (a Mstn inhibitor), and 4) specifically and most importantly a decrease in the expression of Mstn, the only known negative regulator of muscle mass.
Myogenesis of skeletal muscle cells is a highly ordered and sequential process. It starts with a period of proliferation followed by a differentiation process that generates myoblasts from mesodermal stem cells. A withdraw from the cell cycle guided by the expression of muscle-specific transcription factors, such as MyoD, myogenic factor 5, myogenin, and myogenic factor 4, leads to the fusion of myoblasts into multinucleated myotubes (27).
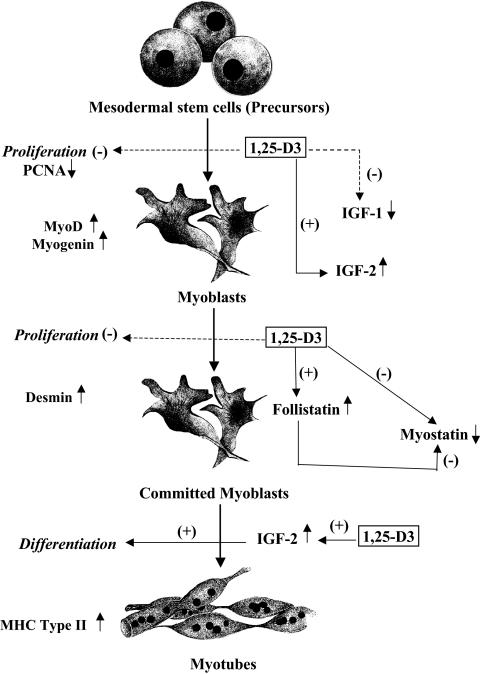
In this study, we demonstrated that addition of 1,25-D3 to skeletal muscle cells induced an increased expression of several myogenic markers and transcription factors (e.g. MyoD, myogenin, and desmin) at different stages of differentiation. Moreover, addition of 1,25-D3 significantly increased the mean diameter and size of the muscle fibers, indicated by the staining for MHC type II, a late myogenic marker (Fig. 8), a clear indication of fiber hypertrophy as a consequence of 1,25-D3 administration.
Fig. 8.
Diagram of the role of vitamin D on muscle growth and differentiation. During development, mesodermal stem cells become committed to the myogenic fate. Muscle precursors (myoblasts) remain in a proliferative state until they exit from the cell cycle and are instructed to differentiate. Differentiation is accompanied by cell fusion, where committed myoblasts become polynucleated myotubes. 1,25-D3 decreases cell proliferation and enhances myogenic cell differentiation by modulating the expression of key pro- and antimyogenic factors, such as IGF-I, IGF-II, Fst, and Mstn.
We also demonstrated that addition of 1,25-D3 induced gene expression of pathways involved in myogenic differentiation, such as IGF and TGFβ-related signaling pathways. 1,25-D3 displayed a differential effect on IGF, down-regulating IGF-I expression and simultaneously up-regulating IGF-II expression, which indicates that IGF-II is one of the main IGF factors responsible for muscle differentiation in the proposed system. The IGF signaling pathway plays a key role in regulating skeletal muscle growth, differentiation, and maintaining adult muscle tissue homeostasis (28). Moreover, IGF plays a critical role in adult muscle survival, regeneration, and hypertrophy (29, 30). Increased expression of IGF-II in muscle cells induces spontaneous differentiation with arrest in G0 and fusion of committed myoblast to form myotubes (Fig. 8) (28). Furthermore, it has been demonstrated that there is a correlation between the amount of IGF-II produced by the myoblast cell line and the extent of differentiation (28). IGF-II is expressed early in MyoD-induced myocyte differentiation and signals in an autocrine loop to activate phosphatidylinositol 3 kinase and serine-threonine kinase (31). It is known that IGF-II inhibition leads to a reduced expression of MyoD target genes, which suggests that IGF-II is essential for amplifying and maintaining MyoD efficacy (32).
Concerning the TGFβ signaling pathway, our study demonstrates, for the first time, that 1,25-D3 administration to C2C12 skeletal muscle cells reduced the expression of Mstn, the only negative regulator of muscle mass known to date (33–35). Specifically, the decrease in Mstn expression is more evident at d 7 than at d 4, which is in agreement with our previous findings, where we demonstrated that Mstn expression is more pronounced at later stages in myoblast cell differentiation (16). Furthermore, the decreased expression of Mstn by 1,25-D3 is specific and does not affect its highly related TGFβ family member GDF-11. It has been shown that loss of GDF-11 in mice causes dramatic anterior homeotic transformations of the axial skeleton but does not affect muscle size, fiber number, or fiber type (36).
Fst is a Mstn-binding protein that can inhibit Mstn activity in vitro and promote muscle growth in vivo (37). It has been demonstrated that Fst antagonizes Mstn by a direct protein interaction, preventing Mstn from executing its inhibitory effect on muscle development (37, 38). In the present study, we demonstrate, for the first time to our knowledge, a direct effect of 1,25-D3 on increasing Fst expression related to muscle differentiation. Our result reinforces the promyogenic effect of 1,25-D3 on skeletal muscle differentiation by decreasing Mstn at the steady-state mRNA and protein level and possible by inhibiting Mstn activity through an increase in Fst expression. Further studies need to be performed to confirm this assumption.
In summary, the data presented in this article demonstrate a direct effect of 1,25-D3 on myogenic cell differentiation by promoting a direct promyogenic effect by increasing IGF-II and Fst expression and by an indirect promyogenic effect, decreasing Mstn expression. Further studies addressing the possibility that 1,25-D3 regulation of myogenic gene expression could be secondary to primary control of up-stream transcription factors appear warranted.
This study provides a mechanistic justification for clinical studies to examine the administration of active vitamin D and/or novel VDR activators (to avoid the hypercalcemic side effects) and even the potential role of emerging therapies directed to trigger select vitamin D-regulated muscle pathways in the treatment of adverse muscle conditions.
Acknowledgments
This work was supported by National Institutes of Health Grants RR026138, RR022762, MD000182, SC1NS064611, and MD000103.
Disclosure Summary: The authors have nothing to disclose.
Footnotes
- 1,25-D3
- 1,25-Dihydroxyvitamin D
- DAPI
- 4′,6-diamidino-2-phenylindole
- FBS
- fetal bovine serum
- FITC
- fluorescein isothiocyanate
- Fst
- follistatin
- GAPDH
- glyceraldehide-3-phosphate dehydrogenase
- GDF-11
- growth differentiation factor 11
- ICC
- immunocytochemistry
- IF
- immunofluorescence
- IOD
- integrated optical density
- MHC
- myosin heavy chain
- Mstn
- myostatin
- MyoD
- myoblast determination
- PCNA
- proliferating cell nuclear antigen
- qRT-PCR
- quantitative RT-PCR
- VDR
- vitamin D receptor.
References
- 1. Holick MF. 2006. The role of vitamin D for bone health and fracture prevention. Curr Osteoporos Rep 4:96–102 [DOI] [PubMed] [Google Scholar]
- 2. Glerup H, Mikkelsen K, Poulsen L, Hass E, Overbeck S, Andersen H, Charles P, Eriksen EF. 2000. Hypovitaminosis D myopathy without biochemical signs of osteomalacic bone involvement. Calcif Tissue Int 66:419–424 [DOI] [PubMed] [Google Scholar]
- 3. Bordelon P, Ghetu MV, Langan RC. 2009. Recognition and management of vitamin D deficiency. Am Fam Physician 80:841–846 [PubMed] [Google Scholar]
- 4. Ceglia L. 2009. Vitamin D and its role in skeletal muscle. Curr Opin Clin Nutr Metab Care 12:628–633 [DOI] [PMC free article] [PubMed] [Google Scholar]
- 5. Wicherts IS, van Schoor NM, Boeke AJ, Visser M, Deeg DJ, Smit J, Knol DL, Lips P. 2007. Vitamin D status predicts physical performance and its decline in older persons. J Clin Endocrinol Metab 92:2058–2065 [DOI] [PubMed] [Google Scholar]
- 6. Bischoff-Ferrari HA. 2010. Vitamin D and fracture prevention. Endocrinol Metab Clin North Am 39:347–353, table of contents [DOI] [PubMed] [Google Scholar]
- 7. Bischoff-Ferrari HA, Dietrich T, Orav EJ, Hu FB, Zhang Y, Karlson EW, Dawson-Hughes B. 2004. Higher 25-hydroxyvitamin D concentrations are associated with better lower-extremity function in both active and inactive persons aged > or = 60 y. Am J Clin Nutr 80:752–758 [DOI] [PubMed] [Google Scholar]
- 8. Heath KM, Elovic EP. 2006. Vitamin D deficiency: implications in the rehabilitation setting. Am J Phys Med Rehabil 85:916–923 [DOI] [PubMed] [Google Scholar]
- 9. Bischoff-Ferrari HA, Borchers M, Gudat F, Dürmüller U, Stähelin HB, Dick W. 2004. Vitamin D receptor expression in human muscle tissue decreases with age. J Bone Miner Res 19:265–269 [DOI] [PubMed] [Google Scholar]
- 10. Snijder MB, van Schoor NM, Pluijm SM, van Dam RM, Visser M, Lips P. 2006. Vitamin D status in relation to one-year risk of recurrent falling in older men and women. J Clin Endocrinol Metab 91:2980–2985 [DOI] [PubMed] [Google Scholar]
- 11. Ceglia L. 2008. Vitamin D and skeletal muscle tissue and function. Mol Aspects Med. 29:407–414 [DOI] [PubMed] [Google Scholar]
- 12. Bouillon R, Bischoff-Ferrari H, Willett W. 2008. Vitamin D and health: perspectives from mice and man. J Bone Miner Res 23:974–979 [DOI] [PubMed] [Google Scholar]
- 13. Endo I, Inoue D, Mitsui T, Umaki Y, Akaike M, Yoshizawa T, Kato S, Matsumoto T. 2003. Deletion of vitamin D receptor gene in mice results in abnormal skeletal muscle development with deregulated expression of myoregulatory transcription factors. Endocrinology 144:5138–5144 [DOI] [PubMed] [Google Scholar]
- 14. Holick MF. 2011. Vitamin D: evolutionary, physiological and health perspectives. Curr Drug Targets 12:4–18 [DOI] [PubMed] [Google Scholar]
- 15. Willett M, Cowan JL, Vlasak M, Coldwell MJ, Morley SJ. 2009. Inhibition of mammalian target of rapamycin (mTOR) signalling in C2C12 myoblasts prevents myogenic differentiation without affecting the hyperphosphorylation of 4E-BP1. Cell Signal 21:1504–1512 [DOI] [PubMed] [Google Scholar]
- 16. Artaza JN, Bhasin S, Mallidis C, Taylor W, Ma K, Gonzalez-Cadavid NF. 2002. Endogenous expression and localization of myostatin and its relation to myosin heavy chain distribution in C2C12 skeletal muscle cells. J Cell Physiol 190:170–179 [DOI] [PubMed] [Google Scholar]
- 17. Taylor WE, Bhasin S, Artaza J, Byhower F, Azam M, Willard DH, Jr, Kull FC, Jr, Gonzalez-Cadavid N. 2001. Myostatin inhibits cell proliferation and protein synthesis in C2C12 muscle cells. Am J Physiol Endocrinol Metab 280:E221–E228 [DOI] [PubMed] [Google Scholar]
- 18. Artaza JN, Sirad F, Ferrini MG, Norris KC. 2010. 1,25(OH)2 vitamin D3 inhibits cell proliferation by promoting cell cycle arrest without inducing apoptosis and modifies cell morphology of mesenchymal multipotent cells. J Steroid Biochem Mol Biol 119:73–83 [DOI] [PMC free article] [PubMed] [Google Scholar]
- 19. Artaza JN, Norris KC. 2009. Vitamin D reduces the expression of collagen and key profibrotic factors by inducing an antifibrotic phenotype in mesenchymal multipotent cells. J Endocrinol 200:207–221 [DOI] [PMC free article] [PubMed] [Google Scholar]
- 20. Cardús A, Parisi E, Gallego C, Aldea M, Fernández E, Valdivielso JM. 2006. 1,25-Dihydroxyvitamin D3 stimulates vascular smooth muscle cell proliferation through a VEGF-mediated pathway. Kidney Int 69:1377–1384 [DOI] [PubMed] [Google Scholar]
- 21. Khanna-Jain R, Vuorinen A, Sándor GK, Suuronen R, Miettinen S. 2010. Vitamin D(3) metabolites induce osteogenic differentiation in human dental pulp and human dental follicle cells. J Steroid Biochem Mol Biol 122:133–141 [DOI] [PubMed] [Google Scholar]
- 22. Barbosa EM, Nonogaki S, Katayama ML, Folgueira MA, Alves VF, Brentani MM. 2004. Vitamin D3 modulation of plasminogen activator inhibitor type-1 in human breast carcinomas under organ culture. Virchows Arch 444:175–182 [DOI] [PubMed] [Google Scholar]
- 23. Ramirez AM, Wongtrakool C, Welch T, Steinmeyer A, Zügel U, Roman J. 2010. Vitamin D inhibition of pro-fibrotic effects of transforming growth factor β1 in lung fibroblasts and epithelial cells. J Steroid Biochem Mol Biol 118:142–150 [DOI] [PMC free article] [PubMed] [Google Scholar]
- 24. Artaza JN, Singh R, Ferrini MG, Braga M, Tsao J, Gonzalez-Cadavid NF. 2008. Myostatin promotes a fibrotic phenotypic switch in multipotent C3H 10T1/2 cells without affecting their differentiation into myofibroblasts. J Endocrinol 196:235–249 [DOI] [PubMed] [Google Scholar]
- 25. Artaza JN, Bhasin S, Magee TR, Reisz-Porszasz S, Shen R, Groome NP, Meerasahib MF, Fareez MM, Gonzalez-Cadavid NF. 2005. Myostatin inhibits myogenesis and promotes adipogenesis in C3H 10T(1/2) mesenchymal multipotent cells. Endocrinology 146:3547–3557 [DOI] [PubMed] [Google Scholar]
- 26. Pike JW, Meyer MB. 2010. The vitamin D receptor: new paradigms for the regulation of gene expression by 1,25-dihydroxyvitamin D(3). Endocrinol Metab Clin North Am 39:255–269, table of contents [DOI] [PMC free article] [PubMed] [Google Scholar]
- 27. Weintraub H. 1993. The MyoD family and myogenesis—redundancy, networks, and thresholds. Cell 75:1241–1244 [DOI] [PubMed] [Google Scholar]
- 28. Florini JR, Ewton DZ, Magri KA, Mangiacapra FJ. 1993. IGFs and muscle differentiation. Adv Exp Med Biol 343:319–326 [DOI] [PubMed] [Google Scholar]
- 29. Florini JR, Magri KA, Ewton DZ, James PL, Grindstaff K, Rotwein PS. 1991. Spontaneous differentiation of skeletal myoblasts is dependent upon autocrine secretion of insulin-like growth factor-II. J Biol Chem 266:15917–15923 [PubMed] [Google Scholar]
- 30. Lawlor MA, Rotwein P. 2000. Insulin-like growth factor-mediated muscle cell survival: central roles for Akt and cyclin-dependent kinase inhibitor p21. Mol Cell Biol 23:8983–8995 [DOI] [PMC free article] [PubMed] [Google Scholar]
- 31. Wilson EM, Hsieh MM, Rotwein P. 2003. Autocrine growth factor signaling by insulin-like growth factor-II mediates MyoD-stimulated myocyte maturation. J Biol Chem 278:41109–41113 [DOI] [PubMed] [Google Scholar]
- 32. Wilson EM, Rotwein P. 2006. Control of MyoD function during initiation of muscle differentiation by an autocrine signaling pathway activated by insulin-like growth factor-II. J Biol Chem 281:29962–29971 [DOI] [PubMed] [Google Scholar]
- 33. McPherron AC, Lawler AM, Lee SJ. 1997. Regulation of skeletal muscle mass in mice by a new TGF-β superfamily member. Nature 387:83–90 [DOI] [PubMed] [Google Scholar]
- 34. McPherron AC, Lee SJ. 1997. Double muscling in cattle due to mutations in the myostatin gene. Proc Natl Acad Sci USA 94:12457–12461 [DOI] [PMC free article] [PubMed] [Google Scholar]
- 35. Lee SJ, McPherron AC. 2001. Regulation of myostatin activity and muscle growth. Proc Natl Acad Sci USA 98:9306–9311 [DOI] [PMC free article] [PubMed] [Google Scholar]
- 36. McPherron AC, Huynh TV, Lee SJ. 2009. Redundancy of myostatin and growth/differentiation factor 11 function. BMC Dev Biol 19:9–24 [DOI] [PMC free article] [PubMed] [Google Scholar]
- 37. Amthor H, Nicholas G, McKinnell I, Kemp CF, Sharma M, Kambadur R, Patel K. 2004. Follistatin complexes myostatin and antagonises myostatin-mediated inhibition of myogenesis. Dev Biol 270:19–30 [DOI] [PubMed] [Google Scholar]
- 38. Lee SJ, Lee YS, Zimmers TA, Soleimani A, Matzuk MM, Tsuchida K, Cohn RD, Barton ER. 2010. Regulation of muscle mass by follistatin and activins. Mol Endocrinol 2010 24:1998–2008 [DOI] [PMC free article] [PubMed] [Google Scholar]


