Abstract
Cyclic nucleotide phosphodiesterase 3 (PDE3) is an important regulator of cyclic adenosine monophosphate (cAMP) signaling within the cardiovascular system. In this study, we examined the role of PDE3A and PDE3B isoforms in regulation of growth of cultured vascular smooth muscle cells (VSMCs) and the mechanisms by which they may affect signaling pathways that mediate mitogen-induced VSMC proliferation. Serum- and PDGF-induced DNA synthesis in VSMCs grown from aortas of PDE3A-deficient (3A-KO) mice was markedly less than that in VSMCs from PDE3A wild type (3A-WT) and PDE3B-deficient (3B-KO) mice. The reduced growth response was accompanied by significantly less phosphorylation of extracellular signal-regulated kinase (ERK) in 3A-KO VSMCs, most likely due to a combination of greater site-specific inhibitory phosphorylation of Raf-1Ser-259 by protein kinase A (PKA) and enhanced dephosphorylation of ERKs due to elevated mitogen-activated protein kinase phosphatase 1 (MKP-1). Furthermore, 3A-KO VSMCs, compared with 3A-WT, exhibited higher basal PKA activity and cAMP response element-binding protein (CREB) phosphorylation, higher levels of p53 and p53 phosphorylation, and elevated p21 protein together with lower levels of Cyclin-D1 and retinoblastoma (Rb) protein and Rb phosphorylation. Adenoviral overexpression of inactive CREB partially restored growth effects of serum in 3A-KO VSMCs. In contrast, exposure of 3A-WT VSMCs to VP16 CREB (active CREB) was associated with inhibition of serum-induced DNA synthesis similar to that in untreated 3A-KO VSMCs. Transfection of 3A-KO VSMCs with p53 siRNA reduced p21 and MKP-1 levels and completely restored growth without affecting amounts of Cyclin-D1 and Rb phosphorylation. We conclude that PDE3A regulates VSMC growth via two complementary pathways, i.e. PKA-catalyzed inhibitory phosphorylation of Raf-1 with resulting inhibition of MAPK signaling and PKA/CREB-mediated induction of p21, leading to G0/G1 cell cycle arrest, as well as by increased accumulation of p53, which induces MKP-1, p21, and WIP1, leading to inhibition of G1 to S cell cycle progression.
Keywords: Cell Cycle, Cyclic AMP (cAMP), MAP Kinases (MAPKs), Protein Kinase A (PKA), Retinoblastoma (Rb), Signal Transduction, CREB, ERK Signaling, VSMC, Cell Growth
Introduction
Multiple factors contribute to the pathogenesis of atherosclerosis, a major health problem worldwide (1). Proliferation of vascular smooth muscle cells (VSMCs),2 primarily responsible for the maintenance of vascular tone (2), is a key event in the development of atherosclerotic lesions and postangioplasty restenosis (3). In a normal artery, VSMCs are in a non-proliferative, quiescent state and exhibit a well differentiated, “contractile” phenotype. After vascular injury, this differentiated phenotype is lost with a shift to a “synthetic” phenotype that is accompanied by entry into the cell cycle and proliferation (4). Evidence that pathological events in the vessel wall play an important role in atherosclerosis is increasing. Development of atherosclerosis may involve perturbation of the homeostatic balance between antiatherosclerotic signaling (nitric oxide (NO), atrial natriuretic peptide, and cyclic nucleotides) and proatherosclerotic signaling (tumor necrosis factor α (TNF-α) and angiotensin II) (5). Both endothelial cells and VSMCs are critical targets for inflammatory molecules, such as interleukin-6 (IL-6), monocyte chemoattractant protein-1, and vascular cell adhesion molecule-1, that are increased during progression of atherosclerosis (6), and are capable also of producing these molecules. In normal tissues with functional endothelium, NO and C-type natriuretic peptide produced by endothelial cells increase cyclic guanosine monophosphate (cGMP), which together with cyclic adenosine monophosphate (cAMP) and prostaglandins, limits inflammation and proliferation, and decrease vascular remodeling and atherosclerosis (7).
Phosphodiesterases (PDEs), which catalyze hydrolysis of cAMP/cGMP, belong to a complex and diverse superfamily of at least 11 structurally related, highly regulated, and functionally distinct gene families (PDE1–PDE11). These enzymes differ in their primary structures, affinities for cAMP and cGMP, responses to specific effectors, sensitivities to specific inhibitors, and mechanisms by which they are regulated (8). Most PDE families comprise more than one gene, which yield multiple protein products via alternative mRNA splicing or utilization of different promoters and/or transcription initiation sites. The two PDE3 subfamilies, PDE3A and PDE3B, are encoded by closely related genes (9). PDE3A and PDE3B isoforms are expressed in VSMCs, but their exact role(s) is unclear in large part due to the lack of availability of specific inhibitors of individual PDE3 isoforms.
The goals of this study were to understand the role(s) of PDE3A and PDE3B isoforms in VSMC function and to define mechanisms by which PDE3 isoforms might affect signaling pathways that regulate VSMC growth. Yan et al. (10) have shown that, in cultured cardiomyocytes, down-regulation of PDE3A with concomitant up-regulation of inducible cAMP early repressor was associated with increased cardiomyocyte apoptosis. Studies by Masciarelli et al. (11) demonstrated that, in female mice, deletion of PDE3A resulted in infertility mainly due to arrest of oocyte meiosis via elevated cAMP/protein kinase A (PKA) signaling, which inhibited maturation-promoting factor. Several earlier studies demonstrated that cilostamide (a PDE3 inhibitor) and rolipram (a PDE4 inhibitor) increased accumulation of cAMP and inhibited arterial, lung, and mesangial smooth muscle cell growth and migration (12–15). Thus, we reasoned that PDE3A-deficient (3A-KO) and PDE3B-deficient (3B-KO) mice might be valuable models in which to dissect and reconstitute signaling pathways downstream of cAMP that could elucidate mechanisms controlling cell division and mitogenesis in other types of cells, including VSMCs.
Our results indicate that PDE3A depletion inhibited mitogen-induced VSMC proliferation via two complementary signaling pathways, i.e. PKA-catalyzed inhibitory phosphorylation of Raf-1, which interfered with activation of MAPK signaling, and PKA/CREB-induced elevation of p21, leading to cell cycle arrest in G0/G1, as well as by increased accumulation of p53, which induces mitogen-activated protein kinase phosphatase 1 (MKP-1), p21, and WIP1, leading to inhibition of G1 to S cell cycle progression.
EXPERIMENTAL PROCEDURES
Materials
All materials and reagents used were commercially available as detailed in the supplemental Materials.
Generation of 3A-KO and 3B-KO Mice
3A-KO mice were generated by targeted disruption of exon 13, which encodes a portion of the second putative metal-binding site in the PDE3A catalytic domain (11). Generation of 3B-KO mice (MPDE3BSvJ129) was also described earlier (16). Mice were maintained and studies were performed in accordance with protocols approved by the Animal Care and Use Committee at NHLBI, National Institutes of Health. Male 3A-KO (PDE3A−/−C57BL/6J-129/SvJ) mice from the F1 generation, 3A-KO (PDE3A−/−C57BL/6J) backcrosses from the F8 generation, and 3B-KO mice (MPDE3BSvJ129) from the F8 generation at the age of 8–12 weeks were used for isolation of primary VSMCs. Similar results were obtained with F1 and F8 generations of 3A-KO mice with respect to VSMC growth inhibition and alterations in signaling proteins. However, VSMCs grown from male F1 generation 3A-KO mice were largely epithelioid in shape, whereas VSMCs grown from 3A-WT littermates were largely spindle-shaped (see supplemental Fig. 1). The epithelioid morphology of 3A-KO VSMCs grown from F1 generation 3A-KO mice reverted to a spindle shape upon eight backcrosses with C57BL/6J mice (supplemental Fig. 1). Thus, differences in morphology were not causally related to differences in growth, MAPK, and cell signaling pathways between 3A-WT and 3A-KO VSMCs grown from F1 generation mice.
Isolation and Culture of VSMCs
VSMCs isolated by collagenase digestion of the aortic media layer as described (17) were not contaminated with fibroblasts or endothelial cells as evidenced by >99% positive immunostaining with fluorescein isothiocyanate-conjugated antibodies against smooth muscle α-actin (Sigma). VSMCs maintained in α-minimum Eagle's medium containing 10% fetal bovine serum and 1% antibiotic/antimycotic were grown to confluence and studied at passage 5 for all experiments.
Immunoblot Analysis of ERK and Other Signaling Proteins
Confluent, serum-starved VSMCs were treated with PDGF-BB (10 ng/ml) or insulin (100 nm) alone or with insulin followed by PDGF and extracted with lysis buffer. Proteins (50 μg) were separated by SDS-PAGE followed by Western immunoblot analysis and detected with enhanced chemiluminescence reagent and imaging with a charge-coupled device camera (LAS 1000 Plus, Fuji, Tokyo, Japan). ECL signals in the linear range were quantitated by densitometry as described in the figure legends.
Cell Proliferation Assay and Flow Cytometry
Cell proliferation was quantified by using BrdU cell proliferation assay kits (Roche Applied Science). DNA synthesis was assessed by [3H]thymidine incorporation as described earlier (18, 19). For cell cycle analysis, VSMCs were incubated with PDGF for 24 h, harvested with trypsin, and stained (1 × 10⁶ cells) with 100 μg/ml propidium iodide for 12 h in the dark at 4 °C. Fractions of cells present in each phase of the cell cycle (G0/G1, S, and G2/M) were determined by flow cytometry using a BD FACStar flow cytometer and ModiFit software.
Analyses of Gene Expression by Cell Cycle-specific Oligo GEArray
Cell cycle-specific gene expression was analyzed by Oligo GEArray mouse cell cycle arrays (SABiosciences, Frederick, MD) representing 112 genes critical to cell cycle regulation. RNA (1 μg) isolated from quiescent 3A-WT and 3A-KO VSMCs was used to synthesize biotin-16-UTP-labeled target cRNA probes, which were hybridized to array membranes, according to the manufacturer's directions. Chemiluminescent signals were detected, and the ECL images were analyzed using GEArray Expression Analysis suite software. Data were normalized to values for housekeeping genes.
PKA Assay
PKA activity was assayed in VSMC extracts using Upstate Biotechnology Inc. (Upstate, NY) kits with Kemptide as substrate and [γ-32P]ATP without or with protein kinase inhibitor peptide. PKC and calcium/calmodulin-dependent protein kinase activities were inhibited by including inhibitor peptide mixture in the assay mixture.
Assay of PDE Activities
PDE3 and PDE4 activities in VSMC extracts (5-μl samples) were measured in the presence and absence of cilostamide (PDE3 inhibitor) and rolipram (PDE4 inhibitor) using the SPA PDE assay kit (Amersham Biosciences) in accord with the manufacturer's instructions. The concentration of cAMP was 1 μm with 0.05 μCi of [3H]cAMP/assay.
Transfection of VSMCs with siRNAs
Subconfluent VSMCs were transfected according to the manufacturer's protocol with 100 nm scrambled RNAi as a control or with 100 nm PDE3A siRNA (sc-41593, Santa Cruz Biotechnology, Inc.), which is a pool of three target-specific 20–25-nucleotide siRNAs, or with 100 nm siGenome ON-TARGETplus SMARTpool mouse TRP53 (L-040642–00, Dharmacon), which is a pool of four target-specific siRNAs. After 48 h, VSMCs were serum-starved, incubated with PDGF, and examined for reductions in PDE3A or p53 protein by Western blotting. [3H]Thymidine incorporation was used to quantify DNA synthesis as described (17).
Protein Assay
Protein concentrations in cell homogenates were quantitated by the bicinchoninic acid method (20).
Statistics
Unless otherwise noted, all data are reported as means ± S.E. of values from at least four or five experiments performed in duplicate. Analysis of variance followed by Dunnett's test was used to compare mean values for different treatments or groups. A p value <0.05 was considered statistically significant.
RESULTS
Characterization of VSMCs Derived from 3A-KO and 3B-KO Mice
As seen in supplemental Fig. 2A, Western blot analyses with isoform-specific antibodies confirmed the absence of PDE3A and PDE3B isoforms in primary VSMCs grown from aortas of 3A-KO and 3B-KO mice, respectively, and their presence in WT counterparts. Of note, there was a compensatory increase in PDE3A protein in 3B-KO VSMCs but no such increase in PDE3B in 3A-KO VSMCs. As seen in supplemental Fig. 2B, analysis of PDE enzymatic activities indicated that most of the cAMP PDE hydrolytic activity in VSMCs was due to PDE3 and PDE4 isoforms based on inhibition of PDE activity by cilostamide and rolipram (21). In 3A-KO VSMCs, PDE3A deletion resulted in an ∼70% decrease in PDE3 activity, whereas PDE4 remained unaffected. 3B-WT VSMCs exhibited ∼50 and ∼30% increases in total PDE and PDE3 activities, respectively, when compared with 3A-WT VSMCs. In 3B-KO VSMCs, PDE3B deletion resulted in an ∼43% decrease in PDE3 activity. The magnitude of decrease in PDE3 activity, ∼43% in 3B-KO VSMCs, was less than the corresponding decrease of ∼70% in 3A-KO VSMCs (supplemental Fig. 2B). This may be due to the observed increase in PDE3A protein in 3B-KO VSMCs.
Increased PKA Activity in 3A-KO VSMCs
Cellular PKA activity in lysates of VSMCs from aortas of 3A-KO and 3B-KO mice was assayed as a measure of assessing altered cAMP signaling due to changed PDE3 expression. Basal PKA activity in 3A-KO VSMCs was more than twice that in 3A-WT cells (9.91 ± 1.5 versus 3.7 ± 0.59 pmol of phosphate incorporated into Kemptide/mg of protein/min; mean ± S.E., n = 4), whereas no such increase was observed in 3B-KO VSMCs (3.72 ± 0.68 versus 3.76 ± 0.47 pmol/mg of protein/min). This absence of increased PKA activity in 3B-KO VSMCs may also be due to, at least in part, the increased expression of PDE3A protein in 3B-KO VSMCs. Acute stimulation with PDGF for 5 min increased PKA activity in VSMCs by 60–70% over basal levels in all VSMCs (3A-WT, 6.3 ± 0.88; 3A-KO, 16.2 ± 1.83; 3B-WT, 6.5 ± 0.59; 3B-KO, 6.2 ± 0.59). PKA activity was completely inhibited when PKA peptide inhibitor was included in vitro during the enzyme assays and partially inhibited when VSMCs were incubated with (Rp)-8-bromo-cAMPS, a cAMP analog that inhibits PKA (data not shown).
Suppression of Proliferation in 3A-KO VSMCs
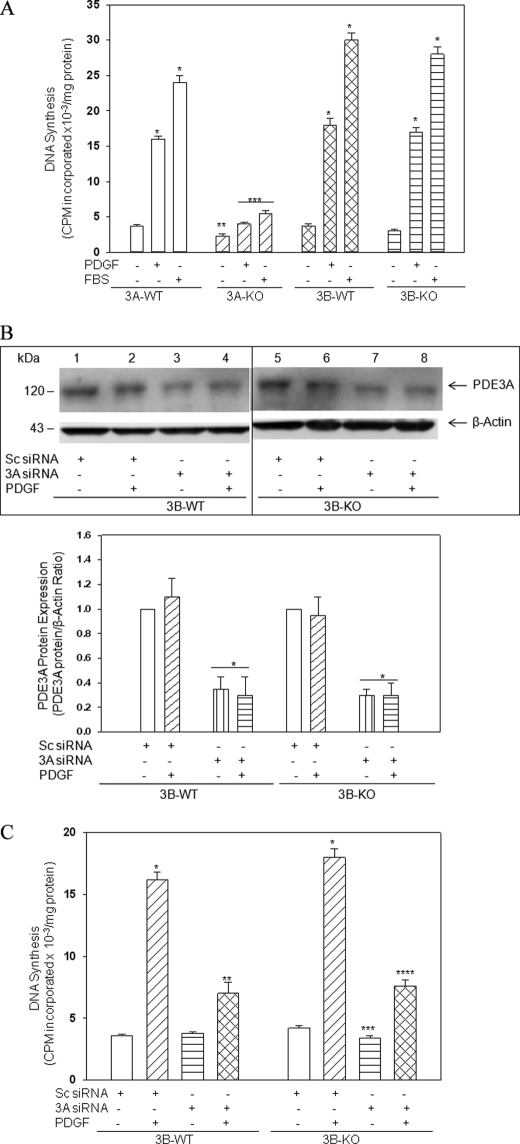
VSMC proliferation is known to play a crucial role in the development of restenosis after balloon angioplasty and in the progression of fatty streaks to atherosclerotic plaques (2). To determine the role of PDE3 isoforms in regulation of VSMC proliferation and growth, we measured [3H]thymidine incorporation into DNA after treatment of VSMCs with PDGF or serum. As seen in Fig. 1A, PDGF- or serum-induced DNA synthesis was increased 4–6-fold in 3A-WT, 3B-WT, and 3B-KO, but not in 3A-KO, VSMCs. Results were similar when growth rates were measured by colorimetric assays using anti-BrdU antibodies to mark proliferating cells (data not shown). Thus, in contrast to 3B-KO VSMCs, which were responsive to mitogenic stimuli, PDE3A depletion was accompanied by markedly less proliferation in response to mitogenic stimuli.
FIGURE 1.
A, PDE3A deficiency differentially suppresses VSMC growth and proliferation. Subconfluent VSMCs were incubated in serum-free medium for 24 h and then treated without or with PDGF-BB (20 ng/ml) or FBS (2%) before incubation with [3H]thymidine (1 μCi/ml) for 3 h. Quantification of its incorporation into DNA was measured as described under “Experimental Procedures.” Results, presented as cpm [3H]thymidine incorporated × 10−3/mg of protein/3 h, are mean ± S.E. values from four experiments, each performed in triplicate. *, p < 0.05, stimulated 3A-WT, 3B-WT, or 3B-KO versus respective basal; **, p < 0.05, basal (without additions) 3A-KO versus basal 3A-WT or 3B-WT; ***, p < 0.05, stimulated 3A-KO versus stimulated 3A-WT, 3B-WT, or 3B-KO. B, siRNA-induced depletion of PDE3A in 3B-WT and 3B-KO VSMCs. 3B-WT and 3B-KO VSMCs were transfected with 100 nm PDE3A siRNA or 100 nm scrambled siRNA (Sc siRNA) using transfection medium supplied by Santa Cruz Biotechnology, Inc. After 48 h, VSMCs were incubated in serum-free medium without or with 20 ng/ml PDGF (24 h) followed by immunoblot analysis of PDE3A protein. Linear signals from four different experiments were quantitated by densitometric analysis and normalized by dividing by β-actin signals. The ratio for basal scrambled siRNA (no additions) for 3B-WT and 3B-KO was set at 1, and the remaining values were calculated relative to basal (*, p < 0.05 versus 3B-WT and 3B-KO VSMCs transfected with scrambled siRNAs). C, siRNA-induced knockdown of PDE3A suppresses DNA synthesis in 3B-WT and 3B-KO VSMCs. [3H]Thymidine incorporation into DNA was measured as described in A. Data are mean ± S.E. values from four different experiments performed in triplicate. *, p < 0.05, 3B-WT and 3B-KO VSMCs transfected with scrambled siRNAs (Sc siRNA) plus PDGF versus no PDGF; **, p < 0.05, PDGF-treated 3B-WT, PDE3A siRNA versus scrambled siRNA; ***, p < 0.05, 3B-KO no additions, PDE3A siRNA versus scrambled siRNA; ****, p < 0.05, PDGF-treated 3B-KO, PDE3A siRNA versus scrambled siRNA.
siRNA-induced Depletion of PDE3A in 3B-KO VSMCs Decreased PDGF-stimulated DNA Synthesis
To confirm a major role for PDE3A in regulation of VSMC proliferation, PDE3A was depleted in 3B-WT and 3B-KO VSMCs using murine PDE3A siRNA (sc-41593 (Santa Cruz Biotechnology, Inc.), which is a pool of three target-specific 20–25-nucleotide siRNAs). Transfection with PDE3A siRNA resulted in 65–70% depletion of cellular PDE3A (Fig. 1B) and significantly decreased basal and PDGF-induced DNA synthesis in 3B-WT and 3B-KO VSMCs when compared with VSMCs transfected with scrambled siRNA (Fig. 1C). Thus, PDE3A depletion in 3B-WT and 3B-KO VSMCs is accompanied by a marked reduction in VSMC proliferative capacity in response to mitogenic stimuli.
Analysis of Cell Cycle Progression by Flow Cytometry
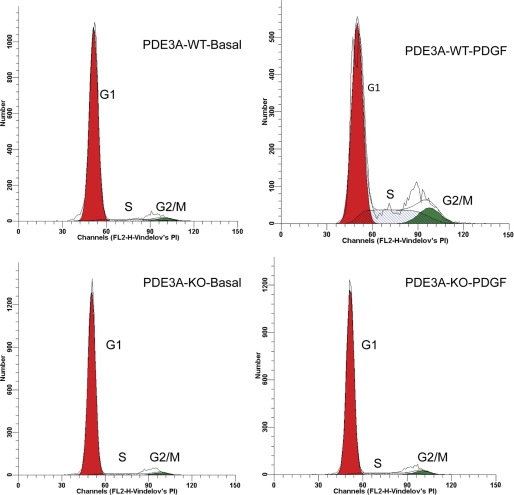
The effect of PDE3A deletion on cell cycle progression was assessed by FACS analysis of propidium iodide-labeled VSMCs (Fig. 2). In the basal state, a large fraction of 3A-WT and 3A-KO VSMCs accumulated in G0/G1 phase with a small fraction of each in S phase (Fig. 2). Incubation of 3A-WT VSMCs with PDGF (24 h) induced cell cycle progression into S phase, significantly decreasing the percentage of cells in G0/G1 and concomitantly increasing the numbers of cells in S phase (2.5-fold) and in G2/M phase (6-fold) (Fig. 2, top right). In contrast, 3A-KO VSMCs exhibited markedly decreased percentages of cells in G1/S and G2/M in response to PDGF (Fig. 2, bottom right; 86.2 ± 3.1% in G0/G1, 9.4 ± 1.4% in S phase, and 4.4 ± 1.0% in G2/M phase). These effects strongly correlated with the inhibition of mitogen-induced DNA synthesis in 3A-KO VSMCs (Fig. 1). Overall, these findings suggested that PDE3A deletion increased PKA activity and inhibited VSMC proliferation by blocking mitogen-induced G1 → S phase and G2 → M phase progression. This observation prompted us to investigate potential alterations in upstream and downstream signaling pathways that regulate cell cycle proteins involved in VSMC growth and proliferation.
FIGURE 2.
PDE3A deficiency causes G0/G1 cell cycle arrest. VSMCs grown in 100-mm dishes were incubated without serum for 24 h and then with or without 20 ng/ml PDGF (24 h) and harvested with trypsin. Cell DNA (1 × 10⁶ cells/ml) was stained with propidium iodide before flow cytometry, which was performed using a BD FACStar flow cytometer. ModiFit software analysis was performed as described under “Experimental Procedures,” and percentage of cells in G1 (first growth phase), synthetic phase (S), second growth phase (G2), and mitotic phase (M) were calculated. Results are the mean ± S.E. of four independent experiments performed in duplicate (G0/G1: 3A-WT basal, 88.9 ± 2.1%; PDGF, 64.7 ± 6.0% (*); 3A-KO basal, 90.6 ± 4.0%; PDGF, 86.2 ± 3.1% (**); S: 3A-WT basal, 8.3 ± 2.0%; PDGF, 20.3 ± 5.0% (*); 3A-KO basal, 6.7 ± 1.1%; PDGF, 9.4 ± 1.4% (**); G2/M: 3A-WT basal, 2.8 ± 0.3%; PDGF, 15.0 ± 3.0% (*); 3A-KO basal, 2.7 ± 0.20%; PDGF, 4.4 ± 0.30% (**)). *, p < 0.05 versus PDE3A-WT basal; **, p < 0.05 versus PDGF-treated PDE3A-WT.
Impaired MAPK/ERK Signaling in 3A-KO VSMCs
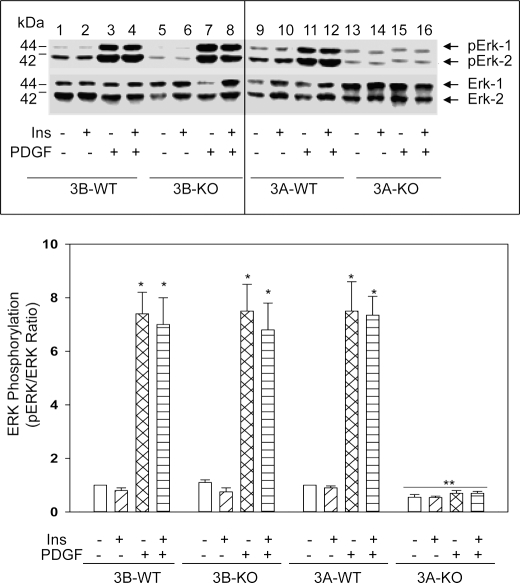
In VSMCs, growth factors activate two major mitogenic signaling pathways in early G1, MAPK/ERK and PI 3-kinase signaling pathways (22–24). MAPK/ERK activation is required for cell cycle initiation (G0-G1) as well as cell cycle progression (22–24). Phosphorylation/activation of upstream kinases (MEK and Raf-1) results in activation of MAPK, leading to phosphorylation of downstream kinases and enhanced expression of several immediate early gene products, which promote cell cycle progression through the restriction point of the cell cycle (25). To test whether growth inhibition in 3A-KO VSMCs might be related to alterations in MAPK/ERK signaling, immunoblot analyses were performed on cell extracts derived from VSMCs acutely stimulated for 5 min with PDGF, insulin, or a combination of both (Fig. 3, top). Insulin was included along with PDGF to determine whether it potentiated PDGF-induced MAPK/ERK phosphorylation/activation, which is required for proliferation of various cells, including VSMCs (22–25). PDGF treatment rapidly increased phosphorylation of ERK1 and ERK2 by severalfold in 3A-WT, 3B-WT, and 3B-KO VSMCs. In contrast, PDGF-induced ERK1 and ERK2 phosphorylations were markedly reduced in 3A-KO VSMCs, reflecting deficient enzyme activation. Insulin treatment alone or in combination with PDGF did not increase ERK phosphorylation. Densitometric analyses revealed that these reductions in ERK phosphorylations were not due to reductions in ERK protein (Fig. 3, bottom). The time course of PDGF-induced ERK phosphorylation revealed persistent reductions in 3A-KO VSMCs at all times studied (data not shown). Incubation of 3B-KO and 3B-WT VSMCs with cAMP agonists ((Sp)-cAMPS; 100 μm) for 30 min also abrogated subsequent PDGF-induced ERK phosphorylation (supplemental Fig. 3). p38 MAPK phosphorylation was also reduced in 3A-KO VSMCs (data not shown). Earlier studies with cilostamide (a PDE3 inhibitor) and cAMP agonists have shown similar reductions in ERK phosphorylation (12–15, 26) that were accompanied by growth inhibition. Studies by Inoue et al. (13) have shown that cilostamide, which increased VSMC cAMP content, inhibited DNA synthesis stimulated by fetal calf serum but did not affect VSMC migration stimulated by PDGF. This earlier report (13) suggested that cilostamide suppressed rat arterial intimal hyperplasia in single and double balloon injury models presumably by inhibiting proliferation rather than migration of VSMCs.
FIGURE 3.
PDE3A deletion blocks PDGF-induced phosphorylation of ERKs. Top, serum-starved VSMCs were incubated in serum-free medium without or with 100 nm insulin (Ins) or 10 ng/ml PDGF for 5 min or with insulin for 5 min followed by PDGF for 5 min. Equal amounts of cell homogenates (50 μg of proteins) were analyzed by Western blots using phospho-p44/42 ERK (pErk) antibody (Thr-202/Tyr-204 MAPK) and by densitometric quantification. A representative image is shown. Bottom, linear ECL signal images from five independent experiments were scanned, and the densitometric ratio (in arbitrary densitometric units) between phosphorylated ERK (pERK) and ERK protein was quantified. The ratio for basal (no additions) 3A-WT and 3A-KO was set at 1, and the remaining values were calculated relative to basal. Data are mean ± S.E. values (n = 5). *, p < 0.05, PDGF-stimulated or PDGF followed by insulin-stimulated versus respective basal values; **, p < 0.05, PDGF-stimulated or PDGF followed by insulin-stimulated, 3A-KO versus 3A-WT, 3B-WT, or 3B-KO.
Preservation of PI 3-Kinase/Akt Signaling in 3A-KO VSMCs
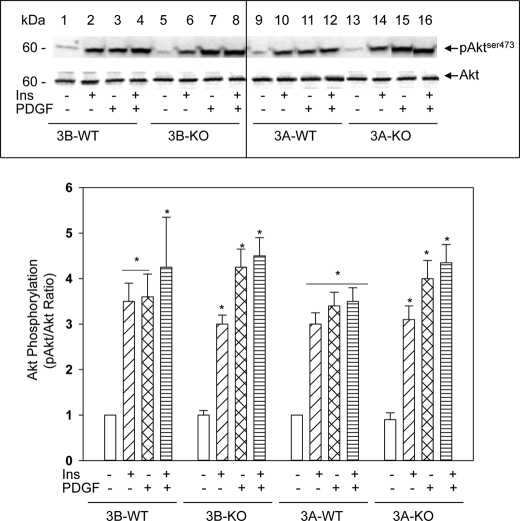
PI 3-kinase signaling pathways are also essential for cell proliferation, cell survival, and differentiation (27). As shown in Fig. 4 (top), insulin or PDGF rapidly increased phosphorylation of AktSer-473, a target of PI 3-kinase signaling. AktSer-473 phosphorylation was similar in 3A-KO, 3A-WT, 3B-WT, and 3B-KO VSMCs (Fig. 4, bottom). Thus, PI 3-kinase/Akt signaling appeared to be preserved in 3A-KO VSMCs. Additional studies indicated that pBad phosphorylation in 3A-KO VSMCs was comparable with that in WT cells (data not shown). Because Akt inhibits apoptosis by phosphorylation and inactivation of several proteins, including FoxO1, Bad, and caspase-9, preservation of PI3K/Akt signaling in 3A-KO VSMCs supported the hypothesis that the reduction in proliferation of 3A-KO VSMCs was not likely to be due to excessive apoptosis.
FIGURE 4.
Akt phosphorylation is preserved in 3A-KO VSMCs. Top, confluent, serum-starved VSMCs were incubated in serum-free medium without or with 100 nm insulin (Ins) or 10 ng/ml PDGF for 5 min or with insulin for 5 min followed by PDGF for 5 min. Equal amounts of cell homogenates (50 μg of proteins) were analyzed by Western blots using phospho-AktSer-473 (pAkt) and Akt antibodies and by densitometric quantification. A representative image is shown. Bottom, linear ECL images from five independent experiments were scanned, and the densitometric ratio (in arbitrary densitometric units) between phosphorylated Akt and Akt protein was quantified. The ratio for 3A-WT and 3A-KO basal (no additions) was set at 1, and the remaining values were calculated relative to basal. Results are mean ± S.E. values (n = 5). *, p < 0.05, stimulated versus respective basal values.
Increased Raf-1Ser-259 Inhibitory Site Phosphorylation in 3A-KO VSMCs
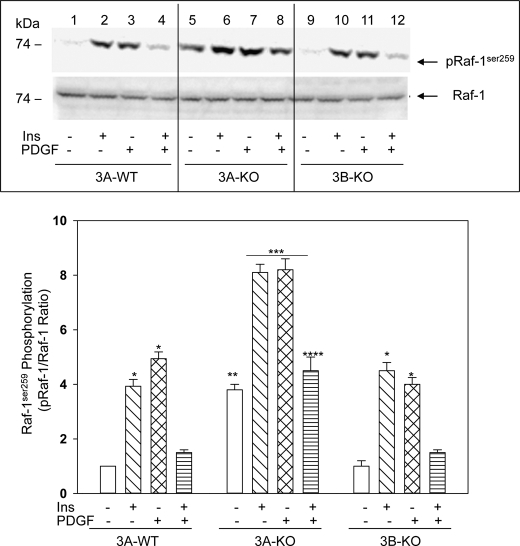
cAMP/PKA signaling is known to increase phosphorylation of Raf-1 at Ser-259, which results in inhibition of Raf-1 kinase activity (28) and consequently inhibition of ERK phosphorylation/activation. As seen in Fig. 5 (top), basal Raf-1Ser-259 inhibitory site phosphorylation was elevated more than 3-fold in 3A-KO VSMCs compared with that in 3A-WT or 3B-KO VSMCs (Fig. 5, bottom, 3A-KO basal versus 3A-WT or 3B-KO basal) consistent with increased PKA activity in 3A-KO VSMCs. Treatment with insulin or PDGF for 5 min increased Raf-1 phosphorylation in all VSMCs. However, phosphorylation of Raf-1Ser-259 by insulin or PDGF was higher in 3A-KO VSMCs compared with that in 3A-WT or 3B-KO VSMCs. In all VSMCs, treatment with insulin for 5 min followed by incubation with PDGF for 5 min reverted the phosphorylation state to basal or near-basal levels. The observed transient increase in Raf-1Ser-259 phosphorylation in 3A-WT and 3B-KO VSMCs with a rapid return to the basal level in 10 min may be to due to a transient PKA activation that elicits the transient increase in Raf-1 phosphorylation to limit/prevent excessive PDGF-induced MAPK phosphorylation/activation. Indeed, acute stimulation with PDGF increased PKA activity in VSMCs by 60–70% over basal levels in WT, 3A-KO, and 3B-KO VSMCs. Earlier studies by Hoffmann et al. (29) demonstrated that EGF triggered the phosphorylation of PDE4D3 by ERK2, causing its inhibition and resulting in an increase in cAMP. The authors also showed that this inhibition of PDE4 was transient due to the consequent increase in cAMP, which allowed PKA to phosphorylate/activate PDE4D3 and reverse the inhibition. Such a possibility could explain the rapid reversal of Raf-1 phosphorylation seen in these experiments (Fig. 5).
FIGURE 5.
Phosphorylation of Raf-1Ser-259 is increased in 3A-KO VSMCs. VSMCs were incubated in serum-free medium without or with PDGF and insulin (Ins) as described in Figs. 3 and 4. Top, equal amounts of cell homogenates (50 μg of proteins) were analyzed by Western blots with anti-Raf-1Ser-259 and anti-Raf-1 antibodies and by densitometric quantification. A duplicate membrane was probed with anti-Raf-1 antibody for loading control. A representative image is shown. Bottom, linear ECL images from five independent experiments were scanned, and the densitometric ratio (in arbitrary densitometric units) between phosphorylated Raf-1Ser-259 (pRaf-1) and Raf-1 protein was quantified. The ratio for 3A-WT basal (no additions) was set at 1, and other values were calculated relative to 3A-WT basal. Results are mean ± S.E. values (n = 5). *, p < 0.05, stimulated 3A-WT or stimulated 3B-KO versus 3A-WT basal (no additions); **, p < 0.05, 3A-KO basal versus 3A-WT basal or 3B-KO basal; ***, p < 0.05, stimulated 3A-KO versus stimulated 3A-WT or stimulated 3B-KO; ****, p < 0.05, insulin followed by PDGF-stimulated 3A-KO versus insulin followed by PDGF-stimulated 3A-WT or insulin followed by PDGF-stimulated 3B-KO.
Phosphorylation of MEK, which is downstream of Raf-1, was also decreased in 3A-KO VSMCs (data not shown). Thus, reduced proliferation in 3A-KO VSMCs may be mechanistically related to inhibition of the Raf/MEK/ERK signaling pathway.
Increased MKP-1 Expression in 3A-KO VSMCs
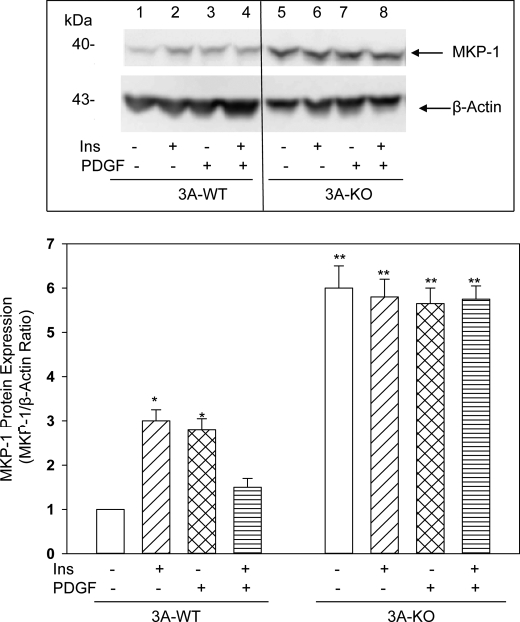
MAPKs, especially ERKs, JNK, and p38, are activated by phosphorylation by upstream kinases and inactivated by dephosphorylation of critical tyrosine and threonine residues via dual specificity tyrosine/threonine-specific phosphatases known as MKPs (30), several isoforms of which have been identified (31). In VSMCs, MKP-1 is rapidly induced by FBS and insulin (32). Studies by Kusari et al. (33) have indicated that cAMP/PKA signaling also induces expression of MKP-1, an early inducible gene. As seen in Fig. 6, immunoblot analyses indicated that very low levels of MKP-1 were found in 3A-WT VSMCs. Both insulin and PDGF caused a small but transient increase in MKP-1 protein levels in these cells. In contrast, basal MKP-1 was increased 5-fold in 3A-KO VSMCs, and treatment with insulin or PDGF did not further increase MKP-1 (Fig. 6). In contrast, VSMCs from 3B-KO mice did not show elevations in MKP-1 (supplemental Fig. 4). Thus, in 3A-KO VSMCs, increased cAMP/PKA signaling appears to induce expression of MKP-1, resulting in enhanced dephosphorylation and inactivation of MAPK and termination of MAPK signaling.
FIGURE 6.
MKP-1 protein is increased in 3A-KO VSMCs. Confluent VSMCs were incubated in serum-free medium without or with PDGF or insulin (Ins) alone or in combination as described in Figs. 3–5. Homogenate samples (50 μg of proteins) were analyzed by Western blots using anti-MKP-1 antibodies and by densitometric quantification. Top, a representative ECL image is shown. Bottom, ECL images from five separate experiments were scanned, and MKP-1 expression was quantified as arbitrary densitometric units relative to that for β-actin. The densitometric ratio for 3A-WT basal (no additions) was set at 1, and the other ratios were calculated relative to 3A-WT basal. Data are reported as means ± S.E. (n = 5). *, p < 0.05, stimulated 3A-WT versus basal 3A-WT; **, p < 0.05, basal 3A-KO and stimulated 3A-KO versus basal and stimulated 3A-WT.
Modulation of Cell Cycle Regulatory Genes in 3A-KO VSMCs
To explore mechanisms underlying G0/G1 cell cycle arrest and defective mitogenesis in 3A-KO VSMCs, we analyzed expression of cell cycle-regulated genes by using cell cycle-specific oligonucleotide microarrays, and, as seen in Table 1, we identified a number of genes in 3A-KO VSMCs whose expression levels were altered by >2-fold compared with those in 3A-WT VSMCs (after correcting for background signals and normalization with four housekeeping genes). Most notably, there was substantial up-regulation of genes that control G1 → S transition (Rhou), S phase and DNA replication (Rad17), G2 phase and G2/M transition (Ppm1d), M phase (Rad21), cell cycle checkpoint/cell cycle arrest (Brca2, Gadd45a, Tsg101, Macf1, and Ppm1d (WIP1)), and cell cycle regulation (Ccnc, Cdc37, Gadd45a, and Rad9). Expression of some negative regulators of the cell cycle (Cdkn1a (p21cip), Cdkn2d (p19), and Trp53 (p53)) were also altered. On the other hand, expression of Cyclin-D1, SHC1, CDC28 protein kinase 1 (cks1b), Pes1, Gas2, Itgb1, and Rbl2 (retinoblastoma (Rb)) genes was decreased in PDE3A-KO VSMCs (Table 1).
TABLE 1.
Changes in expression of cell cycle-specific genes in 3A-KO VSMCs
RNA (1 μg) isolated from quiescent 3A-WT and 3A-KO VSMCs was used to synthesize biotin-16-UTP-labeled target cRNA probes, which were hybridized to array membranes. Signals were detected, and linear ECL images were analyzed as described under “Experimental Procedures.” 3A-KO genes whose expression was increased or decreased by greater than 2-fold compared with 3A-WT genes are shown. Results are mean ± S.E. values of three separate experiments.
| 3A-KO/3A-WT | |
|---|---|
| Increased expression | |
| Brca2 | 2.9 ± 0.3 |
| Ccnc | 2.8 ± 0.2 |
| Cdc37 | 2.2 ± 0.3 |
| Cdkn2d (p19) | 3.6 ± 0.4 |
| Cdkn1a (p21) | 3.0 ± 0.2 |
| Macf1 | 2.1 ± 0.1 |
| Ppm1d (WIP1) | 2.3 ± 0.4 |
| Rad17 | 2.6 ± 0.2 |
| Rad21 | 2.4 ± 0.1 |
| Rad9 | 2.6 ± 0.4 |
| Rhou | 3.4 ± 0.3 |
| Tsg101 | 2.8 ± 0.3 |
| Gadd45a | 2.4 ± 0.2 |
| Trp53 (p53) | 2.8 ± 0.3 |
| Decreased expression | |
| Shc1 | 0.5 ± 0.1 |
| Ccnd1 (Cyclin-D1) | 0.4 ± 0.1 |
| Cks1 | 0.3 ± 0.2 |
| Pes1 | 0.5 ± 0.1 |
| Itgb1 | 0.5 ± 0.1 |
| Gas2 | 0.6 ± 0.2 |
| Rbl2 (Rb) | 0.5 ± 0.1 |
Analysis of Cell Cycle Regulatory Proteins
G1 to S transition is governed by Cyclin-dependent kinases·Cyclin complexes (25). Both PI 3-kinase and ERK signaling activate Cyclin-D1·Cdk4 by increasing the expression of Cyclin-D1, which then complexes with and activates Cdk4 kinase, which in turn regulates the release of E2F. The Cyclin·Cdk complexes are also regulated by Cdk inhibitor proteins, e.g. the kip/cip family, which includes p27kip and p21cip1. Up-regulation of these proteins could lead to G1 cell cycle arrest (34).
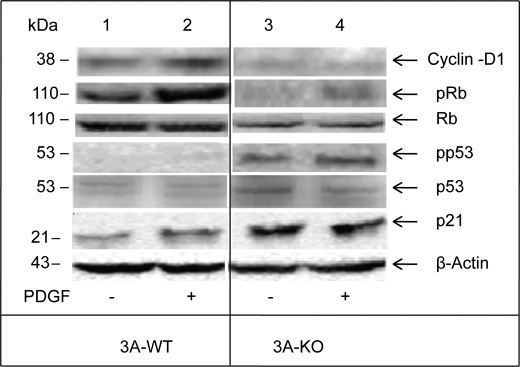
As seen in Fig. 7 and supplemental Fig. 5 and consistent with the results in Table 1, Cyclin-D1 levels were markedly decreased in 3A-KO VSMCs compared with those in 3A-WT VSMCs. Incubation with PDGF for 24 h significantly increased expression of Cyclin-D1 in 3A-WT, but not in 3A-KO, VSMCs. Cyclin-E levels appeared unaltered (data not shown).
FIGURE 7.
Alterations in levels of cell cycle regulatory proteins and their phosphorylation status in 3A-KO VSMCs. 3A-WT and 3A-KO VSMCs were incubated in serum-free medium for 20–24 h without or with PDGF-BB (10 ng/ml). Equal amounts of homogenate samples (50 μg of proteins) were analyzed by Western blots for Cyclin-D1, p21, Rb, phospho-Rb (pRb), p53, phospho-p53 (pp53), and β-actin (loading control) and by densitometric quantification. For quantitation and statistical analysis, see supplemental Fig. 5.
Rb is a downstream substrate for Cyclin-D1·Cdk4 and Cyclin-E·Cdk2. Cyclin-D1·Cdk4-dependent phosphorylation of Rb is necessary for cells to exit G1 and enter S phase (35) because Rb phosphorylation inactivates Rb, which results in the release of E2F and its subsequent nuclear localization and activation, which are required for DNA synthesis. Analysis by Western blotting and densitometric quantitation (Fig. 7 and supplemental Fig. 5) indicated that Rb protein and mitogen-induced Rb phosphorylation levels were reduced in lysates from 3A-KO VSMCs compared with 3A-WT VSMCs. These results were consistent with those in Table 1 that demonstrated a reduction in Rb gene expression in 3A-KO VSMCs. As also seen in Fig. 7 and supplemental Fig. 5, incubation with PDGF for 24 h increased phosphorylation of Rb in 3A-WT, but not 3A-KO, VSMCs.
Because PDE3A deletion inhibits VSMC growth largely by suppression of cell cycle progression at G1/S and G2/M phases, proteins that negatively regulate the cell cycle were also studied. Cell cycle-specific microarray analyses indicated that expression of the tumor suppressor gene p53, Cyclin-dependent kinase inhibitor p21, Gadd45a, and WIP1 was significantly increased in 3A-KO VSMCs (Table 1). Consistent with these results and as seen in Fig. 7 and supplemental Fig. 5, immunoreactive p53 was elevated by ∼3-fold in 3A-KO VSMCs in comparison with 3A-WT VSMCs, which exhibited very low levels of p53. PDGF caused an ∼30% decrease in p53 protein levels in 3A-KO VSMCs. As also seen in Fig. 7 and supplemental Fig. 5, phosphorylation of p53Ser-15 (pp53), which is necessary for its stabilization and activation, was significantly increased in 3A-KO VSMCs compared with that in 3A-WT VSMCs. Incubation of 3A-KO VSMCs with PDGF for 24 h further increased phosphorylation of p53. Phosphorylated p53 induces G1/S arrest via transcriptional induction of p21 (a Cyclin-dependent kinase inhibitor), Gadd45a, and WIP1. Consistent with gene expression results (Table 1) and as seen in Fig. 7 and supplemental Fig. 5, p21 protein was increased ∼2-fold in 3A-KO VSMCs compared with that in 3A-WT. PDGF treatment (24 h) did not alter p21 protein levels in 3A-KO VSMCs but increased p21 in 3A-WT VSMCs.
CREB Phosphorylation Is Increased in 3A-KO VSMCs
CREB, an important nuclear target of cAMP/PKA signaling, is regulated by phosphorylation on Ser-133, which permits binding to the co-activator protein CREB-binding protein and regulation of gene transcription (36). Consistent with increased PKA activity in 3A-KO VSMCs, basal CREB phosphorylation was significantly increased in 3A-KO VSMCs when compared with 3A-WT (2.5 ± 0.4-fold increase; n = 5). Acute treatment with PDGF or insulin did not significantly alter CREB phosphorylation.
Inactive CREB Partially Restores DNA Synthesis in 3A-KO VSMCs
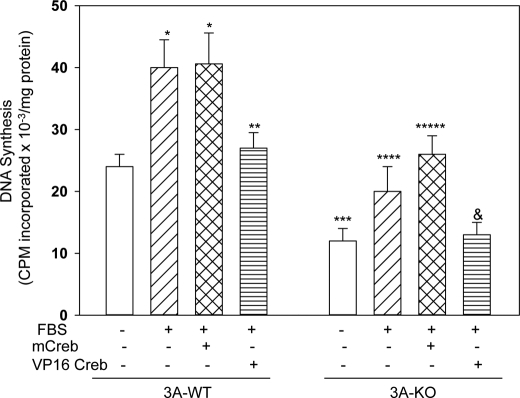
To investigate mechanisms by which CREB signaling might affect DNA synthesis in 3A-KO VSMCs, active (VP16 CREB) and inactive (mCREB) CREB were expressed in 3A-WT and 3A-KO VSMCs. In these experiments (Fig. 8), the mitogenic effect of FBS on DNA synthesis in 3A-WT VSMCs was smaller than that in experiments presented in Fig. 1 (∼2-fold versus 5–6-fold seen in Fig. 1) presumably because confluent, not subconfluent, VSMCs were used for CREB adenoviral infection to minimize cell detachment during infection. Basal DNA synthesis was significantly decreased in 3A-KO VSMCs compared with that in 3A-WT VSMCs. Adenoviral infection of 3A-WT VSMCs with VP16 CREB, but not mCREB, inhibited FBS-induced DNA synthesis in 3A-WT VSMCs (Fig. 8). In contrast, infection of 3A-KO VSMCs with mCREB partially restored FBS-induced DNA synthesis. VP16 CREB completely abolished FBS-induced DNA synthesis in 3A-KO VSMCs (Fig. 8).
FIGURE 8.
Adenoviral infection with inactive CREB partially restores PDGF-induced DNA synthesis in 3A-KO VSMCs. VSMCs were infected for 24 h in growth medium with adenovirus harboring β-galactosidase (50 pfu/cell), mCREB (50 pfu/cell), or VP16 CREB (50 pfu/cell). Infected cells were incubated in serum-free medium (24 h) and then without or with 2% FBS (24 h) before incubation with [3H]thymidine (1 μCi/ml) for 3 h. Quantification of its incorporation into DNA was measured as described under “Experimental Procedures” and in Fig. 1. Results, presented as cpm [3H]thymidine incorporated into DNA × 10−3mg of protein/h, are mean ± S.E. values from four separate experiments performed in triplicate. *, p < 0.05, FBS-stimulated or mCREB followed by FBS-treated 3A-WT versus basal 3A-WT; **, p < 0.05, VP16 CREB followed by FBS-treated 3A-WT versus FBS-stimulated or mCREB followed by FBS-treated 3A-WT; ***, p < 0.05, basal 3A-KO versus basal 3A-WT; ****, p < 0.05, FBS-stimulated 3A-KO versus basal 3A-KO; *****, p < 0.05, mCREB followed by FBS-treated 3A-KO versus FBS-treated 3A-KO; &, p < 0.05, VP16 CREB followed by FBS-treated 3A-KO versus FBS-stimulated or mCREB followed by FBS-treated 3A-KO.
Effects of p53 Antisense RNA on Levels of p21 and MKP-1 Proteins and DNA Synthesis in 3A-KO VSMCs
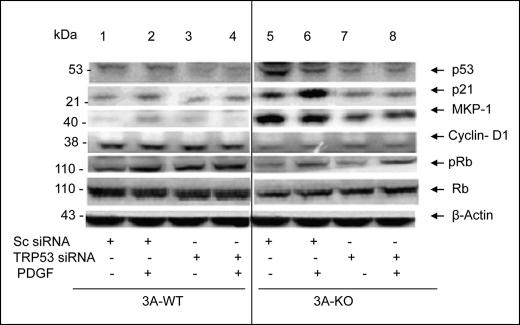
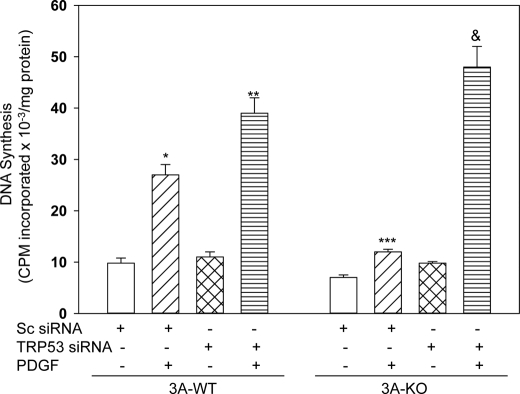
p53, amounts of which are increased in 3A-KO VSMCs compared with those in 3A-WT cells (Table 1 and Fig. 7), suppresses DNA synthesis by increasing levels of cell cycle inhibitory proteins, such as p21, GADD45a, and WIP1, and by promoting apoptosis (37). We investigated whether depletion of p53 levels with antisense siRNA would restore the depressed DNA synthesis seen in 3A-KO VSMCs to the stimulated levels seen in 3A-WT VSMCs. Consistent with gene expression data (Table 1) and Western blots (Fig. 7) and as seen in Fig. 9 and supplemental Fig. 6A, basal p53 levels were higher in 3A-KO VSMCs than in 3A-WT VSMCs after transfection of WT and KO VSMCs with scrambled siRNA. As also seen in Fig. 9 and supplemental Fig. 6A (upper left), although incubation with PDGF decreased p53 protein in 3A-KO VSMCs transfected with scrambled siRNA, p53 content was still significantly greater in 3A-KO VSMCs than in 3A-WT VSMCs. As also seen in Fig. 9 and supplemental Fig. 6 (upper left), transfection with TRP53 siRNA SMARTpool (Dharmacon) decreased p53 levels in 3A-KO VSMCs compared with 3A-KO VSMCs transfected with scrambled siRNA and completely restored responsiveness to the mitogenic effects of PDGF in 3A-KO VSMCs (Fig. 10). As seen in Fig. 10, in WT and KO VSMCs transfected with scrambled siRNA, PDGF-stimulated DNA synthesis was much lower in 3A-KO VSMCs than in 3A-WT VSMCs. In 3A-WT VSMCs transfected with TRP53 siRNA, PDGF-stimulated DNA synthesis was enhanced compared with that in 3A-WT VSMCs transfected with scrambled siRNA. In 3A-KO VSMCs transfected with TRP53 siRNA, PDGF-stimulated DNA synthesis was completely restored and exceeded PDGF-stimulated DNA synthesis in 3A-WT VSMCs transfected with scrambled siRNA or TRP53 siRNA or in 3A-KO VSMCs transfected with scrambled siRNA.
FIGURE 9.
p53 antisense RNA blocks elevations in p21 and MKP-1 without affecting Cyclin-D1 or Rb phosphorylation in 3A-KO VSMCs. Subconfluent VSMCs were transfected with 100 nm TRP53 siRNA SMARTpool or 100 nm scrambled (Sc siRNA) siRNA using Dharmacon transfection medium 1. After 48 h, VSMCs in serum-free medium were incubated without or with PDGF for 24 h. Samples of homogenates (50 μg of proteins) were analyzed by Western blots for cell cycle regulatory proteins and by densitometric quantification. For quantification and statistical analysis, see supplemental Fig. 6, A and B. pRb, phospho-Rb.
FIGURE 10.
p53 antisense RNA restores DNA synthesis in 3A-KO VSMCs. VSMCs at 50% confluence were transfected with 100 nm TRP53 siRNA SMARTpool or 100 nm scrambled (Sc siRNA) siRNA using Dharmacon transfection medium 1. After 48 h, VSMCs in serum-free medium were incubated without or with PDGF (24 h) before incubation with [3H]thymidine (1 μCi/ml) for 3 h. Quantification of its incorporation into DNA was measured as described under “Experimental Procedures” and in Fig. 1. Results, presented as cpm [3H]thymidine incorporated into DNA × 10−3/mg of protein/h, are mean ± S.E. values from five separate experiments performed in triplicate. *, p < 0.05, scrambled siRNA, PDGF-stimulated 3A-WT versus 3A-WT basal (no additions); **, p < 0.05, PDGF-stimulated 3A-WT, TRP53 siRNA versus scrambled siRNA; ***, p < 0.05, scrambled siRNA, PDGF-stimulated 3A-KO versus PDGF-treated 3A-WT; &, p < 0.05, PDGF-stimulated, 3A-KO (TRP53 siRNA) versus 3A-KO (scrambled siRNA), 3A-WT (scrambled siRNA), or 3A-WT (TRP53 siRNA).
As seen in Fig. 9 and supplemental Fig. 6A (lower left), the restoration of DNA synthesis in 3A-KO VSMCs was accompanied by inhibition of p21cip1 protein expression. As also seen in Fig. 9 and supplemental Fig. 6A (lower right), transfection of 3A-KO VSMCs with TRP53 siRNA markedly reduced MKP-1 protein compared with that in 3A-KO VSMCs transfected with scrambled siRNA. Consistent with results presented in Fig. 7 and as seen in Fig. 9 and supplemental Fig. 6, A and B, Cyclin-D1 and Rb proteins and phospho-Rb were lower in 3A-KO VSMCs than in 3A-WT cells after transfection of WT and KO VSMCs with scrambled siRNA. Cyclin-D1 and Rb proteins and phospho-Rb were not significantly altered in 3A-KO VSMCs transfected with TRP53 siRNA.
DISCUSSION
PDEs play critical roles in controlling intracellular pools of cAMP and cGMP. Elevation of cGMP, in part via cGMP-mediated inhibition of PDE3 activity (38, 39), has been reported to synergistically enhance cAMP elevation and vasodilation of arteries (40). Cilostamide (a specific PDE3 inhibitor) has been reported to inhibit VSMC growth and migration (12–15). However, the role of individual PDE3A and PDE3B isoforms in regulation of VSMC growth and contractility is largely unclear primarily due to the lack of isoform-selective PDE3 inhibitors.
In this study, using cultured VSMCs grown from aortas from PDE3A- and PDE3B-deficient mice, we examined the role of PDE3A and PDE3B isoforms in the control of VSMC proliferation. The results demonstrate that PDE3A deficiency differentially inhibits mitogen-induced VSMC proliferation by suppressing G1 → S and G2 → M phases of cell cycle progression. Evidence presented here suggests that the observed inhibition of VSMC growth and cell cycle arrest is due to a combination of abrogation of PDGF-induced MAPK kinase signaling and alterations in key cell cycle regulatory proteins, such as p53, p21, and Rb. In contrast, the PI 3-kinase/Akt arm of PDGF signaling is preserved in 3A-KO VSMCs. In 3A-KO VSMCs, increased cAMP/PKA signaling resulted in increased inhibitory phosphorylation of Raf-1 at Ser-259, which caused inhibition of Raf-1 kinase activity (41) and consequently impaired MAPK phosphorylation/activation. In addition, in 3A-KO VSMCs, MAPK phosphorylation/activation was reduced due to p53-mediated induction of MKP-1, which catalyzes dephosphorylation of MAPK. Notably, the observed impairment in MAPK activation and the resultant suppression of the mitogenic response in 3A-KO VSMCs are specific to PDE3A deficiency as 3B-KO VSMCs exhibited no elevations in PKA activity, were responsive to PDGF with respect to MAPK activation and DNA synthesis, and did not exhibit either increased Raf-1Ser-259 phosphorylation or MKP-1 expression. Cellular depletion of PDE3A in 3B-KO VSMCs by transfection with PDE3A siRNA inhibited PDGF-induced DNA synthesis in 3B-KO VSMCs. A recent study by Hewer et al. (42) indicated that PKA and Epac synergistically mediated cAMP-induced growth arrest in VSMCs via a Rap1-independent mechanism. Further studies are clearly needed to understand the contribution of Epac signaling to growth inhibition of 3A-KO VSMCs.
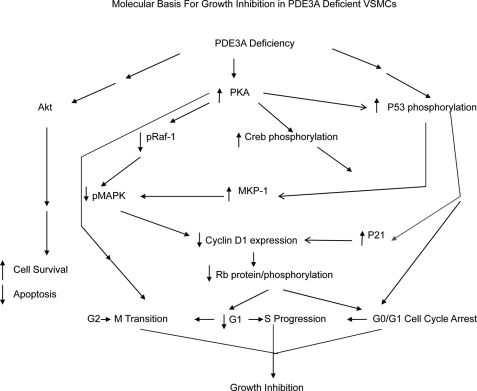
PDE3A deficiency also results in the blockade of multiple proximal and distal steps in cell cycle progression by modulating several key cell cycle regulatory proteins (Fig. 11). First, the impaired MAPK activation is accompanied by decreased expression of Cyclin-D1, which may lead to reductions in Cdk4 activity and thus mediate the decrease in mitogen-induced Rb phosphorylation in 3A-KO VSMCs. As a consequence, Rb remains active and presumably associated with E2F (35), thereby causing suppression of the G1 → S phase of cell cycle progression. Second, PDE3A deficiency, most likely via increased cAMP signaling and PKA-induced phosphorylation/activation of CREB, was associated with increased expression of the Cdk inhibitor protein p21cip, which is known to inactivate both Cdk2 and Cdk4, thereby promoting G0/G1 cell cycle arrest (34). Third, expression of inactive CREB in 3A-KO VSMCs partially restored the stimulatory effect of PDGF on DNA synthesis. Fourth, p53 protein expression and phosphorylation were increased in 3A-KO VSMCs, and depletion of cellular p53 with antisense siRNA decreased p21cip1 and MKP-1 protein expression in 3A-KO VSMCs and completely restored PDGF-induced DNA synthesis. It is worth noting that p53 up-regulation and phosphorylation seen in 3A-KO VSMCs did not promote apoptosis because cell viability, caspase-3 activity, and Akt-mediated pBad phosphorylation were not altered in 3A-KO VSMCs.3
FIGURE 11.
Schematic diagram showing signaling pathways that mediate growth inhibition in 3A-KO VSMCs. In 3A-KO VSMCs, increased PKA signaling and p53 signaling pathways independently and cooperatively inhibit upstream MAPK signaling via Raf-1 inhibitory phosphorylation as well as MAPK dephosphorylation by elevated MPK-1; this results in decreased Cyclin-D1 and Rb protein expression. Elevations in PKA and p53 signaling also lead to induction of p21, MKP-1, and WIP1 expression, leading to cell cycle arrest at G0/G1 and inhibition of G1 → S progression. pRaf-1, phospho-Raf-1; pMAPK, phospho-MAPK.
Thus, the loss of PDE3A causes cell cycle arrest and inhibition of VSMC proliferation primarily by utilizing two complementary mechanisms. First, mitogen-induced MAPK signaling is blunted due to inactivation of the upstream Raf kinase via PKA-mediated inhibitory phosphorylation of Raf-1 and due to increased MKP-1 expression. Second, in PDE3A-KO VSMCs, expression of several cell cycle regulators and their phosphorylation, including p21, p53, and Rb, are altered. PKA-induced phosphorylation/activation of CREB may lead to increased expression of p21cip1, an inhibitor of cell cycle progression. PDE3A deficiency also up-regulates p53 protein and its phosphorylation. It is unclear which kinase(s) phosphorylates and activates p53 in 3A-KO VSMCs. Evidence from the literature suggests that p53 phosphorylation is largely promoted by ATM/ATR via Chk1/2 as well as by DNA-protein kinase, HIPK2, and AMP-activated protein kinase in response to heat shock, UVA radiation, IR, energetic stress, etc., resulting in decreased association with Mdm2, which leads to further p53 stabilization and activation (43, 44). PKA has also been reported to phosphorylate p53 in a conformation-dependent manner (45). In 3A-KO VSMCs, increases in p53 expression and p53Ser-15 phosphorylation enhanced p53 transcriptional activity, resulting in increased MKP-1 (Fig. 8) and p21 (Fig. 9) protein levels and increased gene expression of WIP1, p21, and Cdkn2d (Cdk4 inhibitor) (microarray analyses; Table 1). These three latter genes inhibit cell cycle progression.
Other studies using cAMP agonists and pharmacologic inhibitors of PDE3 and PDE4 isoforms have reported inhibition of VSMC growth (7, 12–15, 42, 46–49). However, the exact role of PDE3A and PDE3B isoforms and PKA was difficult to discern in these studies because of the lack of availability of specific inhibitors of PDE3A and PDE3B isoforms. To our knowledge, our current findings may define, for the first time, a specific role for PDE3A in the control of proximal as well as distal regulatory pathways of VSMC proliferation in response to growth factors and (perhaps) arterial injury. Growth inhibition in 3A-KO VSMCs is in part due to PKA-mediated ERK inactivation and up-regulation of p53 and p21, two major cell cycle inhibitory proteins (41, 46, 47, 49). This definitive role for PDE3A was substantiated by the absence of inhibition of VSMC growth in 3B-KO VSMCs and by inhibition of PDGF-stimulated DNA synthesis in 3B-KO VSMCs depleted of PDE3A by transfection with PDE3A siRNA.
Our results also clearly indicate that, in addition to PKA/CREB, other signals (especially p53) are required for growth inhibition because inactive CREB only partially restored FBS-induced DNA synthesis in 3A-KO VSMCs. Depletion of p53 levels with TRP53 siRNA, however, completely restored the growth-promoting effects of mitogens in PDE3A-KO VSMCs. Downstream targets of p53, i.e. up-regulation of expression of p21 as well as WIP1 and Cdkn2d (microarray analysis; Table 1) might also be critical elements in cell cycle arrest seen in 3A-KO VSMCs. A schematic summary of the results in this study is shown in Fig. 11. Based on the results of apoptosis assays, FACS analyses, and immunodetection of pBad and Bax, it is unlikely that the inhibition of proliferation seen in 3A-KO VSMCs is due to excessive apoptosis. Moreover, cAMP, via CREB, has been proposed to promote cell survival and vascular re-endothelialization by up-regulating hepatocyte growth factor (50), and because CREB is activated in 3A-KO VSMCs, it is plausible that CREB might also limit apoptosis in 3A-KO VSMCs by increasing vascular hepatocyte growth factor, which was reported in earlier studies of human and rodent VSMCs exposed to cilostazol (a PDE3 inhibitor) (50, 51).
How do these results relate to in vivo situations? Recent studies by Sun et al. (52) showed that PDE3A-deficient mice were protected from collagen/epinephrine-induced pulmonary thromboembolism and subsequent death most likely due to elevated intraplatelet cAMP and reduced platelet activation. Moreover, in the PDE3A-deficient mice, heart rate was increased, and arterial blood pressure and left ventricular pressure were reduced presumably due to peripheral vasodilation. Ongoing collaborative studies using WT and 3A-KO mice have further indicated that PDE3A is an important PDE isozyme that regulates basal heart function by regulating cAMP levels in microdomains that contain SERCA2·phospholamban·PDE3A macromolecular complexes.4 Other studies using human myocardial samples have also supported the idea that PDE3A is a component of a SERCA-containing macromolecular complex that may integrate cAMP and SERCA signaling in human heart.5 Recent studies in rats by Zhao et al. (53) indicated that balloon angioplasty increased PDE3/PDE4 proteins and activities with a concomitant decrease in vasodilator-stimulated phosphoprotein phosphorylation, which is an index of PKA activity and vascular smooth muscle relaxation. Treatment with PDE3 inhibitors restored vasodilator-stimulated phosphoprotein phosphorylation.
These observations, together with our data regarding VSMC growth, suggest that PDE3A isoforms may play a major role in cardiovascular function by regulating cardiac contractility and peripheral vasodilation as well as VSMC growth. Given that cilostazol has been reported to inhibit neointimal injury in rats following balloon injury (51), future in vivo studies with balloon injury models will be needed to test the protective effect of PDE3A deletion on vessel wall thickening, smooth muscle cell migration, and neointimal growth.
Supplementary Material
Acknowledgments
We are grateful to Dr. Martha Vaughan for critical reading of the manuscript, Drs. Faiyaz Ahmad and Weixing Shen for kind help and sharing of antibodies, D. Phil McCoy for kind help in FACS analysis, and Drs. Eva Degerman and Tova Rahn Landstrom for sharing initial studies indicating that outgrowth was reduced in aortic explants from PDE3A-deficient mice.
This work was supported, in whole or in part, by the National Institutes of Health through the Intramural Research Program of the NHLBI.

The on-line version of this article (available at http://www.jbc.org) contains supplemental Figs. 1–6.
N. Begum, S. Hockman, and V. C. Manganiello, unpublished data.
W. Shen, S. Beca, F. Ahmad, P. B. Helli, J. Liu, J. Sun, S. Hockman, E. Murphy, V. Manganiello, and P. H. Backx, unpublished data.
F. Ahmad, W. Shen, N. Szabo-Fresnais, J. Krall, E. Degerman, E. Klussmann, M. Movsesian, and V. Manganiello, unpublished data.
- VSMC
- vascular smooth muscle cell
- PDE
- phosphodiesterase
- 3A-KO
- PDE3A-deficient
- 3B-KO
- PDE3B-deficient
- MKP
- mitogen-activated protein kinase phosphatase
- CREB
- cAMP response element-binding protein
- Rb
- retinoblastoma
- mCREB
- inactive CREB
- VP16 CREB
- active CREB
- PKA
- protein kinase A
- (Rp)-8-bromo-cAMPS
- (Rp)-8-bromoadenosine 3′,5′-cyclic monophosphorothioate
- PI
- phosphatidylinositol
- (Sp)-cAMPS
- (Sp)-adenosine 3′,5′-cyclic monophosphorothioate
- pBad
- phosphorylated Bad
- ATM
- ataxia telangiectasia, mutated
- ATR
- ATM- and Rad3-related
- SERCA
- sarco(endo)plasmic reticulum Ca2+-ATPase.
REFERENCES
- 1. Ross R. (1986) N. Engl. J. Med. 314, 488–500 [DOI] [PubMed] [Google Scholar]
- 2. Doran A. C., Meller N., McNamara C. A. (2008) Arterioscler. Thromb. Vasc. Biol. 28, 812–819 [DOI] [PMC free article] [PubMed] [Google Scholar]
- 3. Lafont A., Guzman L. A., Whitlow P. L., Goormastic M., Cornhill J. F., Chisolm G. M. (1995) Circ. Res. 76, 996–1002 [DOI] [PubMed] [Google Scholar]
- 4. Cai X. (2006) Expert Rev. Cardiovasc. Ther. 4, 789–800 [DOI] [PubMed] [Google Scholar]
- 5. Libby P. (2002) Nature 420, 868–874 [DOI] [PubMed] [Google Scholar]
- 6. Hansson G. K. (2001) Arterioscler. Thromb. Vasc. Biol. 21, 1876–1890 [DOI] [PubMed] [Google Scholar]
- 7. Koyama H., Bornfeldt K. E., Fukumoto S., Nishizawa Y. (2001) J. Cell. Physiol. 186, 1–10 [DOI] [PubMed] [Google Scholar]
- 8. Conti M., Beavo J. (2007) Annu. Rev. Biochem. 76, 481–511 [DOI] [PubMed] [Google Scholar]
- 9. Maurice D. H., Palmer D., Tilley D. G., Dunkerley H. A., Netherton S. J., Raymond D. R., Elbatarny H. S., Jimmo S. L. (2003) Mol. Pharmacol. 64, 533–546 [DOI] [PubMed] [Google Scholar]
- 10. Yan C., Miller C. L., Abe J. I. (2007) Circ. Res. 100, 489–501 [DOI] [PMC free article] [PubMed] [Google Scholar]
- 11. Masciarelli S., Horner K., Liu C., Park S. H., Hinckley M., Hockman S., Nedachi T., Jin C., Conti M., Manganiello V. (2004) J. Clin. Investig. 114, 196–205 [DOI] [PMC free article] [PubMed] [Google Scholar]
- 12. Netherton S. J., Maurice D. H. (2005) Mol. Pharmacol. 67, 263–272 [DOI] [PubMed] [Google Scholar]
- 13. Inoue Y., Toga K., Sudo T., Tachibana K., Tochizawa S., Kimura Y., Yoshida Y., Hidaka H. (2000) Br. J. Pharmacol. 130, 231–241 [DOI] [PMC free article] [PubMed] [Google Scholar]
- 14. Chini C. C., Grande J. P., Chini E. N., Dousa T. P. (1997) J. Biol. Chem. 272, 9854–9859 [DOI] [PubMed] [Google Scholar]
- 15. Matousovic K., Grande J. P., Chini C. C., Chini E. N., Dousa T. P. (1995) J. Clin. Investig. 96, 401–410 [DOI] [PMC free article] [PubMed] [Google Scholar]
- 16. Choi Y. H., Park S., Hockman S., Zmuda-Trzebiatowska E., Svennelid F., Haluzik M., Gavrilova O., Ahmad F., Pepin L., Napolitano M., Taira M., Sundler F., Stenson, Holst L., Degerman E., Manganiello V. C. (2006) J. Clin. Investig. 116, 3240–3251 [DOI] [PMC free article] [PubMed] [Google Scholar]
- 17. Begum N., Sandu O. A., Duddy N. (2002) Diabetes 51, 2256–2263 [DOI] [PubMed] [Google Scholar]
- 18. Jacob A., Smolenski A., Lohmann S. M., Begum N. (2004) Am. J. Physiol. Cell Physiol. 287, C1077–C1086 [DOI] [PubMed] [Google Scholar]
- 19. Begum N., Song Y., Rienzie J., Ragolia L. (1998) Am. J. Physiol. Cell Physiol. 275, C42–C49 [DOI] [PubMed] [Google Scholar]
- 20. Smith P. K., Krohn R. I., Hermanson G. T., Mallia A. K., Gartner F. H., Provenzano M. D., Fujimoto E. K., Goeke N. M., Olson B. J., Klenk D. C. (1985) Anal. Biochem. 150, 76–85 [DOI] [PubMed] [Google Scholar]
- 21. Phillips P. G., Long L., Wilkins M. R., Morrell N. W. (2005) Am. J. Physiol. Lung Cell. Mol. Physiol. 288, L103–L115 [DOI] [PubMed] [Google Scholar]
- 22. Nelson P. R., Yamamura S., Mureebe L., Itoh H., Kent K. C. (1998) (1998) J. Vasc. Surg. 27, 117–125 [DOI] [PubMed] [Google Scholar]
- 23. Isenović E. R., Kedees M. H., Tepavcević S., Milosavljević T., Korićanac G., Trpković A., Marche P. (2009) Cardiovasc. Hematol. Disord. Drug Targets 9, 172–180 [DOI] [PubMed] [Google Scholar]
- 24. Pagès G., Lenormand P., L'Allemain G., Chambard J. C., Meloche S., Pouysségur J. (1993) Proc. Natl. Acad. Sci. U.S.A. 90, 8319–8323 [DOI] [PMC free article] [PubMed] [Google Scholar]
- 25. Ducommun B. (1991) Semin. Cell Biol. 2, 233–241 [PubMed] [Google Scholar]
- 26. Cheng J., Thompson M. A., Walker H. J., Gray C. E., Diaz, Encarnacion M. M., Warner G. M., Grande J. P. (2004) Am. J. Physiol. Renal Physiol. 287, F940–F953 [DOI] [PubMed] [Google Scholar]
- 27. Duan C., Bauchat J. R., Hsieh T. (2000) Circ. Res. 86, 15–23 [DOI] [PubMed] [Google Scholar]
- 28. Dhillon A. S., Pollock C., Steen H., Shaw P. E., Mischak H., Kolch W. (2002) Mol. Cell. Biol. 22, 3237–3246 [DOI] [PMC free article] [PubMed] [Google Scholar]
- 29. Hoffmann R., Baillie G. S., MacKenzie S. J., Yarwood S. J., Houslay M. D. (1999) EMBO J. 18, 893–903 [DOI] [PMC free article] [PubMed] [Google Scholar]
- 30. Owens D. M., Keyse S. M. (2007) Oncogene 26, 3203–3213 [DOI] [PubMed] [Google Scholar]
- 31. Sun H., Tonks N. K., Bar-Sagi D. (1994) Science 266, 285–288 [DOI] [PubMed] [Google Scholar]
- 32. Jacob A., Molkentin J. D., Smolenski A., Lohmann S. M., Begum N. (2002) Am. J. Physiol. Cell Physiol. 283, C704–C713 [DOI] [PubMed] [Google Scholar]
- 33. Kusari A. B., Byon J. C., Kusari J. (2000) Mol. Cell. Biochem. 211, 27–37 [DOI] [PubMed] [Google Scholar]
- 34. Coqueret O. (2003) Trends Cell Biol. 13, 65–70 [DOI] [PubMed] [Google Scholar]
- 35. Onishi T., Zhang W., Cao X., Hruska K. (1997) J. Bone Miner. Res. 12, 1596–1605 [DOI] [PubMed] [Google Scholar]
- 36. Brindle P., Nakajima T., Montminy M. (1995) Proc. Natl. Acad. Sci. U.S.A. 92, 10521–10525 [DOI] [PMC free article] [PubMed] [Google Scholar]
- 37. Taylor W. R., Stark G. R. (2001) Oncogene 20, 1803–1815 [DOI] [PubMed] [Google Scholar]
- 38. Kass D. A., Takimoto E., Nagayama T., Champion H. C. (2007) Cardiovasc. Res. 75, 303–314 [DOI] [PubMed] [Google Scholar]
- 39. Aizawa T., Wei H., Miano J. M., Abe J., Berk B. C., Yan C. (2003) Circ. Res. 93, 406–413 [DOI] [PubMed] [Google Scholar]
- 40. Lugnier C., Keravis T., Eckly-Michel A. (1999) J. Physiol. Pharmacol. 50, 639–652 [PubMed] [Google Scholar]
- 41. Wu J., Dent P., Jelinek T., Wolfman A., Weber M. J., Sturgill T. W. (1993) Science 262, 1065–1069 [DOI] [PubMed] [Google Scholar]
- 42. Hewer R. C., Sala-Newby G. B., Wu Y. J., Newby A. C., Bond M. (2011) J. Mol. Cell. Cardiol. 50, 87–98 [DOI] [PMC free article] [PubMed] [Google Scholar]
- 43. Maclaine N. J., Hupp T. R. (2009) Aging 1, 490–502 [DOI] [PMC free article] [PubMed] [Google Scholar]
- 44. Waning D. L., Lehman J. A., Batuello C. N., Mayo L. D. (2010) Pharmaceuticals 3, 1576–1593 [DOI] [PMC free article] [PubMed] [Google Scholar]
- 45. Adler V., Pincus M. R., Minamoto T., Fuchs S. Y., Bluth M. J., Brandt-Rauf P. W., Friedman F. K., Robinson R. C., Chen J. M., Wang X. W., Harris C. C., Ronai Z. (1997) Proc. Natl. Acad. Sci. U.S.A. 94, 1686–1691 [DOI] [PMC free article] [PubMed] [Google Scholar]
- 46. Plevin R., Malarkey K., Aidulis D., McLees A., Gould G. W. (1997) Cell. Signal. 9, 323–328 [DOI] [PubMed] [Google Scholar]
- 47. Fukumoto S., Koyama H., Hosoi M., Yamakawa K., Tanaka S., Morii H., Nishizawa Y. (1999) Circ. Res. 85, 985–991 [DOI] [PubMed] [Google Scholar]
- 48. Osinski M. T., Rauch B. H., Schrör K. (2001) Mol. Pharmacol. 59, 1044–1050 [DOI] [PubMed] [Google Scholar]
- 49. Hayashi S., Morishita R., Matsushita H., Nakagami H., Taniyama Y., Nakamura T., Aoki M., Yamamoto K., Higaki J., Ogihara T. (2000) Hypertension 35, 237–243 [DOI] [PubMed] [Google Scholar]
- 50. Morishita R. (2005) Atheroscler. Suppl. 6, 41–46 [DOI] [PubMed] [Google Scholar]
- 51. Aoki M., Morishita R., Hayashi S., Jo N., Matsumoto K., Nakamura T., Kaneda Y., Ogihara T. (2001) Diabetologia 44, 1034–1042 [DOI] [PubMed] [Google Scholar]
- 52. Sun B., Li H., Shakur Y., Hensley J., Hockman S., Kambayashi J., Manganiello V. C., Liu Y. (2007) Cell. Signal. 19, 1765–1771 [DOI] [PubMed] [Google Scholar]
- 53. Zhao H., Guan Q., Smith C. J., Quilley J. (2008) Eur. J. Pharmacol. 590, 29–35 [DOI] [PubMed] [Google Scholar]
Associated Data
This section collects any data citations, data availability statements, or supplementary materials included in this article.


