Abstract
For tissue engineering and regenerative medicine, cryopreservation, a technique for preserving biomaterials in the frozen state with cryoprotective agents (CPAs), is critically important for preserving engineered tissues (ETs) as well as cells necessary to create ETs. As more diverse ETs are produced using various cell types, CPAs and corresponding freeze/thaw (F/T) protocols need to be developed cell/tissue-type specifically. This is because CPAs and F/T protocols that have been successful for one cell/tissue type have proven to be difficult to adapt to other cell/tissue types. The most critical barrier to address this challenge is the inability to screen and identify CPA or CPA mixtures efficiently. In this paper, we developed an "electro-wetting-on-dielectic" (EWOD) based digital microfluidic platform to characterize and screen CPA mixtures cell-type specifically. The feasibility of the EWOD platform was demonstrated by characterizing and optimizing a mixture of dimethlysulfoxide (DMSO) and PBS for human breast cancer cell line as model CPA mixture and cell line. The developed platform multiplexed droplets of DMSO and PBS to create an array of DMSO-PBS mixtures, and mapped the phase change diagram of the mixture. After loading cell suspensions on the platform, the mixture was further screened on-chip for toxicity and cryoproection. The results were discussed to illustrate the capabilities and limitations of the EWOD platform for cell and tissue-type specific optimization of CPA mixtures and F/T protocols.
Keywords: Electrowetting-on-dielectric, Digital microfluidics, Cryopreservation
INTRODUCTION
Cryopreservation is a method to preserve cells and tissues in the frozen state with cryoprotective agents (CPAs), which are chemical additives to minimize cryoinjury. It is one of the key enabling technologies for cell and tissue engineering since it can provide "off-the-shelf" availability of engineered tissues (ETs) as well as cells necessary to create ETs. Despite of widespread use cryopreservation, successful preservation of engineered tissues and cells are still challenging as more diverse cell and tissue engineering products are created. One of the most significant challenges in cryopreservation is that the preservation outcome is highly cell- and tissue-type dependent. This implies that a successful cryopreservation protocol for any given type of tissue may not be directly applied to other types of tissues. Therefore, cryopreservation protocols need to be developed cell-and tissue-type specifically.
One of the most critical barriers to achieving cell/tissue-specific cryopreservation is the inability to screen and identify more effective and less toxic CPAs efficiently.1 Cell/tissue-specific optimization of CPA mixtures is difficult since multiple aspects of CPAs need to be characterized at various steps of cryopreservation. A typical cryopreservation protocol consists of five steps – 1) loading of CPAs to biomaterials, 2) freezing to a storage temperature at controlled cooling rates, 3) preserving at the storage temperature, 4) thawing to room temperature at controlled warming rates, and 5) unloading of CPAs prior to use. 2–9 During these steps, cells and tissues are damaged by one of the following mechanisms10 – 1) intracellular ice formation, which is spontaneous ice crystallization of intracellular water during rapid freezing11, 12 2) extracellular ice formation and consequent osmotic pressure-driven cellular dehydration during slow freezing13, 14, and 3) toxicity and osmotic shock during CPA loading/unloading.15–17 In addition to CPA loading/unloading, the other steps are also affected by CPAs, since the injury mechanisms are closely associated with the phase change behavior of both extra- and intra-cellular water, which is modulated by CPAs. Thus, identification of new CPAs has profound impact on developing cryopreservation cell/tissue-type specifically.
Although dimethlysulfoxide (DMSO) is the most widely used CPA for routine preservation of cells and simple tissues, it has also been reported that mixtures of CPAs may protect cells and tissues better than pure DMSO.18–24 Recently, trehalose-supplemented CPAs have been used to preserve various cells and tissues, and very promising results were reported.24–26 These studies commonly suggested that the use of trehalose with other conventional CPAs would produce superb preservation outcomes. However, the selection of base CPAs and the amount of trehalose added is still determined from experience or a very sparse number of screening experiments. Systematic screening and characterization to determine the optimum compositions and concentrations are highly desired. However, determining the optimized composition of CPA mixtures is extremely difficult and technically challenging due to the large number of CPA candidates to be screened for their multiple characteristics. These characteristics include the phase change characteristics of extra- and intra-cellular water, the extent of toxicity and cryoprotection. Thus, in order to screen CPA mixtures cell/tissue-type specifically, the capability to determine their composition and concentration considering these multiple characteristics should be developed.
The objective of this study is to develop a microfluidic platform to rapidly and efficiently characterize and screen CPA mixtures for cell/tissue-type specific cryopreservation. In order to screen CPA mixtures for multiple characteristics over a wide range of composition and concentration, the platform should be able to handle small amounts of reagents with great accuracy, have a capability to multiplex various agents and have an open configuration for various assessments. Thus, we propose an "electro-wetting-on-dielectric" (EWOD) digital microfluidic platform to prepare, characterize and screen mixtures of CPAs on-chip. The EWOD refers the phenomenon of surface tension change at the liquid-solid interface by applying an electric potential. When an electric voltage is applied across a liquid droplet on a hydrophobic dielectric layer, electric charge accumulates in the dielectric layer. This charge accumulation changes the wettability of the dielectric surface, and results in the change of contact angle of the liquid droplet. This contact angle change is described by the Lippmann-Young equation as follow:
| (1) |
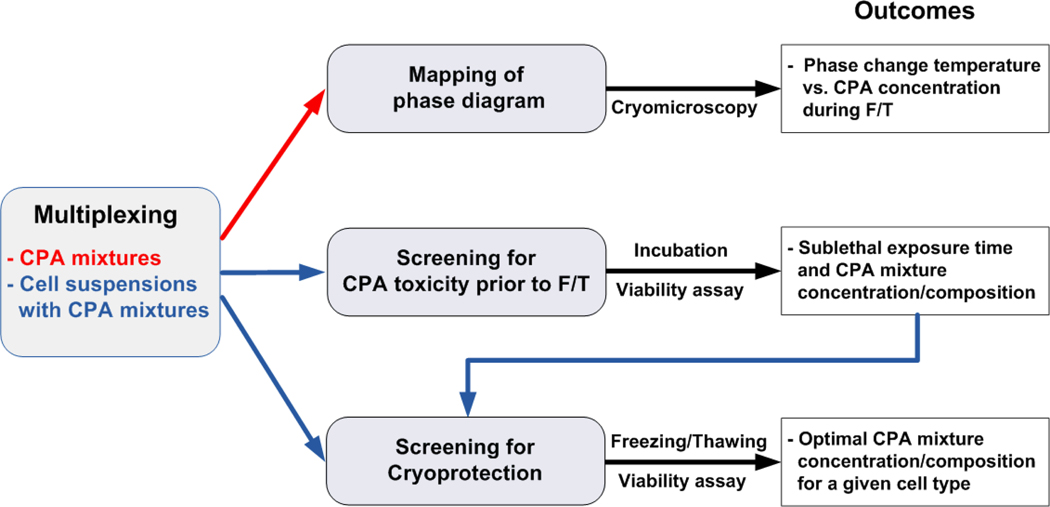
where θv is the contact angle when voltage is applied, θ0 the initial contact angle, γlv is the liquid-vapor surface tension, d is thickness of dielectric, V is the applied voltage, c is the capacitance per unit area of the dielectric layer. It has been reported that EWOD-based microfluidic platforms are capable of handling liquid reagents in discrete droplets on-chip via four basic fluidic operations. These include dispensing droplets from a reservoir, transporting, merging, mixing, and splitting.27–32 In the present study, EWOD chips with 5 × 5 or 6 × 6 electrode array were fabricated, and were used to characterize DMSO-PBS mixtures for human breast cancer cell line (MCF-7) as a model CPA mixture and cell system. The proposed on-chip characterization and optimization procedures are illustrated in Fig. 1. After loading stocks of DMSO and PBS on the chip, an array of DMSO-PBS mixtures were prepared by EWOD operation and the corresponding phase-diagram was mapped. Then, the prepared CPA mixtures were further characterized for cellular-level toxicity and cryoprotection on-chip by assessing the cell viability after the exposure to the mixtures and after an F/T protocol respectively. The results were discussed to assess the capabilities and limitations of the developed EWOD platform for screening and characterization of CPA mixtures cell/tissue-type specifically.
Figure 1.
Flow chart of on-chip screening and characterization of CPA mixtures.
MATERIALS AND METHODS
Design of EWOD-Based CPA Screening Platform
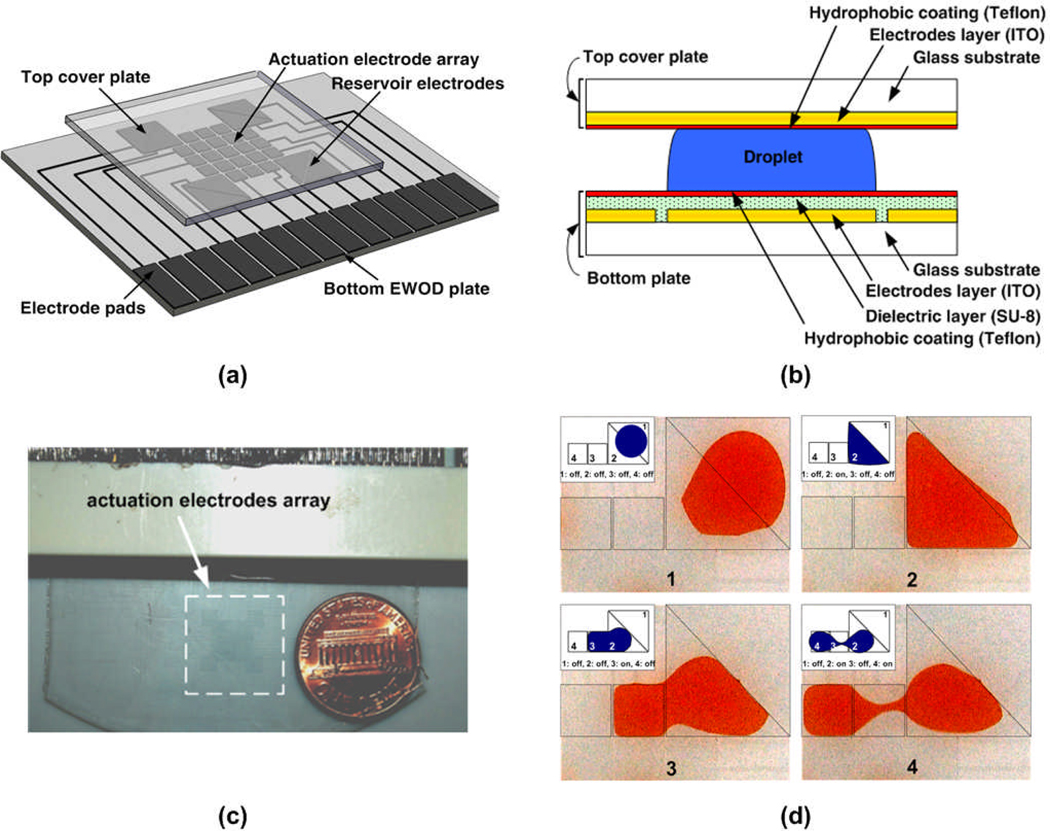
The isometric view of the developed EWOD platform and layered view are shown in Fig. 2a. The platform consisted of a bottom plate, where actuation and reservoir electrodes and their control lines were patterned, and a top cover plate, where a contiguous ground electrode was coated. The dimensions of actuation and reservoir electrodes are 1 mm × 1 mm and 3 mm × 3 mm, respectively. The layered view of the fabricated platform is illustrated in Fig. 2b. To fabricate the bottom electrode layer, Indium Tin Oxide (ITO) coated glass wafers (Delta Technologies, Ltd, Stillwater, MN) were patterned using a standard photolithography technique. As an insulating layer of the bottom plate, 1 µm of SU-8 negative photoresist (SU-8 5, MicroChem, Newton, MA) was spin-coated on the patterned ITO substrate.33 Then, the bottom plate was spin-coated with Teflon-AF in 250 nm thick to make a hydrophobic surface. As for the top cover plate, an ITO coated glass was spin-coated with Teflon-AF as a hydrophobic layer. Then, reagents were loaded at the reservoir electrodes, and the top and bottom plates were assembled using 100 µm thick double-sided tapes as spacers. In order to create uniform sized droplets, the reservoir electrodes were designed with two right triangular-shaped electrodes arranged to form square pattern as shown in Fig. 2d. A typical sequence of droplet generation from the triangle-shaped reservoir electrodes is also shown. While multiple droplets are dispensed from the reservoir, the volume of reagents in the reservoir site is getting smaller and it becomes difficult to bring the small reservoir drop to the desired area. By dividing reservoir electrode in two, a little amount of reservoir droplet still can be actuated and brought to the adjacent actuation electrodes, which can prevent of generating any dead volumes of reagent in the reservoir.
Figure 2.
EWOD-based CPA screening platform. (a) Perspective view of the EWOD platform. Electrodes and their control lines are patterned on the bottom EWOD plate, and a contiguous ground electrode is coated on the top cover plate. (b) Cross-section of the EWOD platform. (c) A photograph of the fabricated EWOD platform. (d) Sequential images of the droplet generation from the triangle-shaped reservoir. The inset on the top left of each image indicates electrodes where electric voltage was applied.
Preparation of On-Chip Microarray of CPA Mixture
A 2 × 2 array of different concentrations of DMSO-PBS mixtures with or without cells was prepared by serial dilution of droplets of stock DMSO (Sigma-Aldrich, St. Louis, MO) with isotonic PBS (Invitrogen, Grand island, NY) through four basic EWOD operations - transporting, merging, mixing and separating of droplets. To perform these droplet-wise operations, the fabricated EWOD chip was connected to a control circuit to apply AC voltage, typically 60–100 VRMS at 1 kHz, to the individual electrodes. In order to visualize the dilution process and quantify the concentration of generated droplets, the stock DMSO on the reservoir electrode was red-dyed. Then, the EWOD operation was imaged using a digital microscope (KH100, Hirox). The captured images were converted to gray scale and further processed using image processing software (ImageJ, NIH). Since the intensity of a droplet is proportional to the concentration of DMSO, the intensity can be correlated to the DMSO concentration as follows:
| (2) |
and
| (3) |
where I* is the normalized intensity; and I, I0%DMSO, and I100%DMSO are the intensities of a given droplet, 0% DMSO solution (i.e., stock PBS), and 100% DMSO solution (i.e., stock DMSO), respectively. In addition, C and C100%DMSO are the concentration of a droplet and 100% DMSO solution, and the concentration of DMSO in stock PBS is assumed zero. The intensity of a given droplet was determined from the intensity values measured from more than 4 randomly selected spots of the droplet. With measured intensities and stock DMSO concentration, the concentrations of mixture droplets were determined. The EWOD operations and subsequent image processing were repeated three times. The estimated concentration of DMSO, CDMSO, was then compared with the target concentration.
On-Chip Mapping of Phase Diagram of CPA Mixture
The EWOD chip, where an array of DMSO-PBS mixtures had been generated, was placed on a temperature-controlled microscope stage (MDBCS 196, Linkam), and the whole EWOD chip was frozen to −80 °C and thawed back to room temperature at 3 °C/min. (Schematics of setup is available in ESI, S1†.) In order to map the phase diagram, the phase change temperature of each droplet was determined during both freezing and thawing. The phase change temperature was estimated as the temperature where the opacity of the mixture droplet changed. In order to verify the results from the EWOD platform, manual characterization was performed separately. Droplets of DMSO-PBS mixture (~ 200 nL) were manually prepared and then frozen and thawed by the same protocol while the droplets were imaged. The captured images were also analyzed to determine the phase change temperatures. In addition to manual experiments, differential scanning calorimetry, (DSC Q200, TA instruments) was also performed. (The details of DSC experiment were described in ESI).
On-Chip Manipulation of Cell Suspension
A human breast cancer cell line (MCF-7) was obtained from American Type Culture Collection (ATCC) and maintained in culture medium (D-MEM/F12, Invitrogen, Carlsbad, CA) supplemented with 5 % fetal bovine serum, 1% penicillin/streptomycin, and 0.01 mg/mL of insulin. The cells were incubated in 75 cm2 T-flasks at 37 °C and 5 % CO2 environment. When cells were 60 ~ 80% confluent, they were collected on a regular basis. After separation, the cells were pelleted by centrifugation and the excess medium was removed. The cell pellet was re-suspended in isotonic phosphate-buffered saline (PBS) with 0.2 % (wt/v) of pluronic F68 (Sigma-Aldrich, St. Louis, MO) at a nominal cell concentration of 2 × 10⁶ cells/mL. Pluronic F68 was used to reduce unspecific absorption of cells onto the EWOD chip.34 To assess the cellular viability on-chip, the dye solution of 40 µM of Hoechst (H-33342, Molecular probes, Eugene, OR) and 30 µM propidium iodide (P-1304, Molecular probes, Eugene, OR) were also prepared. The prepared cell suspensions, dye solution, and stock DMSO were loaded on the EWOD platform. The amount of each loaded droplet was approximately 1 µL.
Screening for CPA Toxicity
Cellular toxicity assay was performed by determining sublethal exposure time for a given CPA mixture concentration/composition. All these procedures were performed on-chip via EWOD operations. The cellular suspension array including four different concentrations of DMSO was generated with same process described in preparation of a microarray of CPA mixture section. When an array of cellular suspensions had been generated, the EWOD chip was placed in incubator for different times (i.e. 5, 15, 30 minutes). The cell viability was assessed by use of membrane integrity assay. After the exposure to the CPA mixtures, cell suspension droplets were mixed with a droplet of the dye solution to make final concentration of Hoechst and propidium iodide to become 10 µM and 7.5 µM, respectively. After the mixing, the EWOD chips were incubated at 37 °C and 5 % CO2 for 15 minutes. After the incubation, the cell suspension droplets were observed under a fluorescence microscope (MVX10, Olympus) to assess the injury. The viability was determined by the percentage of cells with intact membrane with respect to all cells in the droplets.
Screening for Cyroprotection
In order to screen CPA mixtures for cryoprotection, the post-thaw survival of MCF-7 cells were assessed and analyzed with respect to the concentration of DMSO in the mixtures. Similar to the toxicity screening, the cell suspension droplets were mixed with the DMSO-PBS mixtures and allowed 5 minutes prior to F/T procedure. Then, the whole EWOD chip was placed on a temperature controlled microscope stage and frozen to −50 °C at 28 °C/min, held for 5 minutes and thawed to the room temperature at 50 °C/min. This F/T protocol was selected to compare the EWOD results with the post-thaw viability of the same cell line available in the literature.35 After F/T, the post-thaw viability was assessed on-chip as described in the previous section. In addition to the results in the literature, manual experiments were also performed to compare with the cryoprotection screening by the EWOD platform. Droplets of cell suspension in DMSO-PBS mixtures (~ 1 µL) were manually prepared, frozen and thawed by the same protocol. After F/T, cells were manually stained for the viability assay.
Statistical Analysis
Each experimental group was repeated at least three times (n ≥ 3). Results are presented as mean ± standard error of the mean. Statistical analysis was performed using one-way ANOVA. Student t-tests were performed at 95% confidence level. For the viability assays, any differences in cell population per droplet were considered during the t-tests.
RESULTS
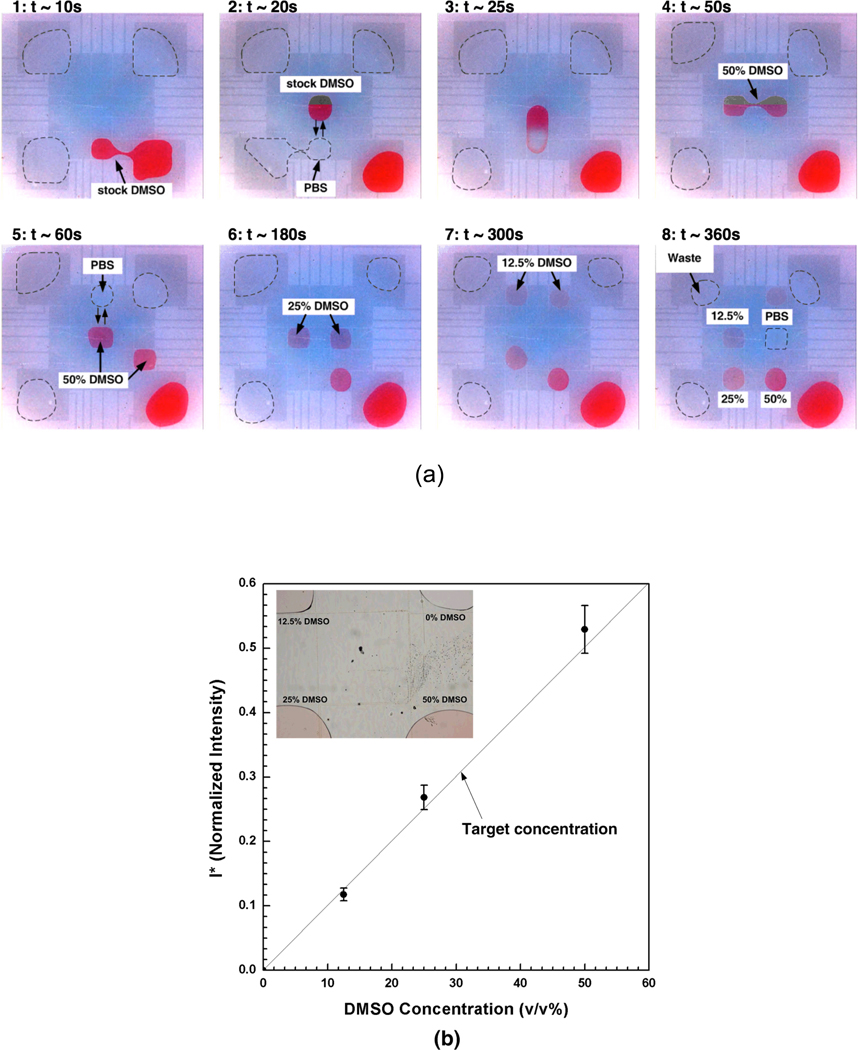
Figure 3 shows a typical sequence of preparing an array of DMSO-PBS mixtures by serial dilutions on the EWOD platform. For visualization, the stock DMSO was dyed in red color and the boundary of PBS droplets were noted with dotted line. Initially, both stock solutions (i.e., PBS and 100% DMSO) were loaded at the reservoirs and a droplet of stock DMSO was generated (Fig. 3a-1). A PBS droplet was generated and merged as shown in Figs. 3a-2 and -3. In order to enhance the mixing, the merged droplets were moved around several times on the EWOD platform. Then, this mixed droplet was then separated into two 50% (v/v) DMSO-PBS droplets (Fig. 3a-4). Then, 50% DMSO droplet was further mixed with PBS droplets to generated 25% and 12.5 % DMSO-PBS droplets (Figs. 3a–5 to 7). As a result of these serial dilutions, an array of four droplets – 0% DMSO (i.e., stock PBS), 12.5% DMSO-PBS, 25% DMSO-PBS and 50% DMSO-PBS – were generated as shown in Fig. 3a–8. During the operation, any unwanted or excess droplets were collected at the waste reservoir. As mentioned, all droplet operations were controlled by a computerized program and only four operations were manually performed to load the stock DMSO and PBS solutions (i.e. injecting system).
Figure 3.
Preparation of an array of DMSO-PBS mixtures on the EWOD chip. (a) Captured sequential images during multiplexing the mixture droplets. For visualization, the stock DMSO was dyed in red color and the boundary of PBS droplets were noted with dotted line. 1: Generation of a stock DMSO droplet, 2: Generation of a PBS droplet, 3: Merging and mixing of DMSO and PBS droplets, 4 : Splitting of 50% DMSO-PBS droplets, 5: Generation of a PBS droplet and merging/mixing with 50% DMSO droplet, 6: Splitting of 25% DMSO-PBS droplets, 7: Splitting of 12.5% DMSO-PBS droplets after generation of a PBS droplet and merging/mixing with 25% DMSO droplet, 8: Formation of a 2×2 array of DMSO-PBS mixtures. (b) Concentration of the mixture droplets generated on the EWOD platform. Generally the concentrations of all droplets (n = 3) agrees well with the target concentrations (solid line). The inset shows a representative image of an array of DMOS-PBS mixtures.
The concentration of the mixture droplets were estimated by eqn. (3), and plotted with target concentration in Fig. 3b. The result shows that the concentration of all mixture droplets agrees well with the target concentration of DMSO. However, the deviation from the target concentrations is noticed as the DMSO concentration increases. The deviation from the expected concentration should result from inaccuracy during droplet generations (i.e., droplets of 100% DMSO were slightly larger than those of PBS), and the effects of different viscosity and surface tension of the reagents.
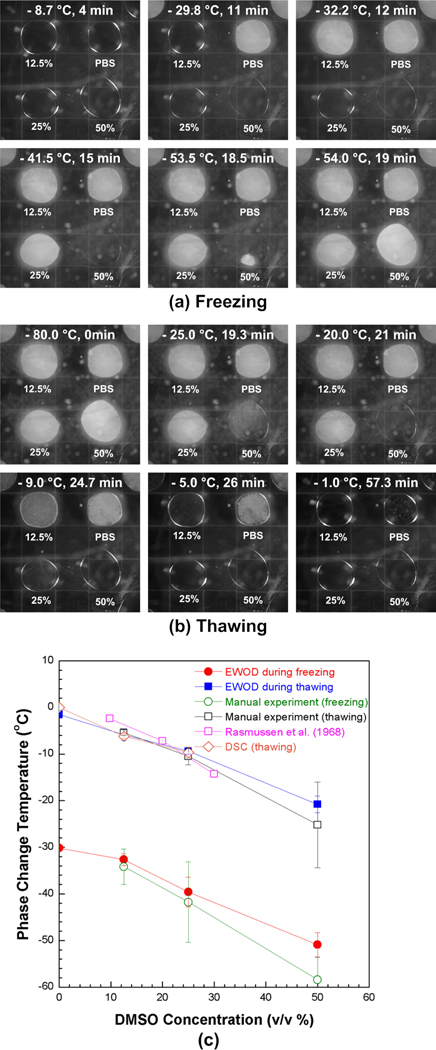
The phase change of the DMSO-PBS mixture array is shown in Fig. 4. During freezing (Fig. 4a), the droplet of stock PBS crystallized first at −30.2 ± 0.5 °C, which was significantly supercooled than the equilibrium temperature. Then, 12.5 % DMSO-PBS mixture crystallized at −32.6 ± 1.3 °C. The decreases in the crystallization temperature should be due to the addition of DMSO.13, 15 This trend continued and 50 % DMSO-PBS mixture crystallized at −50.9 ±2.6 °C. The stock DMSO on the reservoir (i.e., bottom right corner) did not change its phase until −80 °C. Besides the crystallization temperatures, it was also noticed that the speed of the crystallization varied with DMSO concentrations. The speed of crystallization became slower as the DMSO concentration increased. For an example, the PBS droplets crystallized almost instantaneously, but it took approximately 6 seconds for the droplet of 50% DMSO-PBS mixture to crystallize.
Figure 4.
Phase change of DMSO-PBS mixtures on the EWOD platform. (a) Captured sequential images with temperatures during freezing and (b) thawing. The whole EWOD chip was frozen to −80°C and thawed back to room temperature at 3°C/min. The phase change of each droplet can be noted by the opacity change. (c) Phase change temperatures of DMSO-PBS mixtures (n=3 for each point).
During thawing, the droplets were melted in the order of DMSO concentration from the high to low concentration, as shown in Fig. 4b. The melting temperatures of 50 %, 25 %, 12.5 % DMSO-PBS mixture, and stock PBS were −20.8 ± 1.8 °C, −9.4 ± 0.6 °C, −5.9 ± 1.2 °C and −1.6 ± 0.8 °C, respectively. Contrary to the abrupt crystallizations during freezing, the melting of the droplets occurred gradually as noted with gradual change of their opacity. This observation concur with typical phase change behavior with CPAs as reviewed elsewhere.36, 37
In Fig. 4c, the measured phase change temperatures are compared with those obtained by manual experiments, DSC experiments and those from a phase diagram reported elsewhere.38 The phase change temperatures generally decrease with DMSO concentration, and the crystallization temperatures during freezing are significantly lower than the equilibrium phase change temperatures due to supercooling during freezing. Although the crystallization temperatures by the EWOD platform are slightly higher than those by the manual experiments, the differences are not statistically significant (p > 0.06). Similar to the concentration shown in Fig. 3b, the difference increases with the concentration of DMSO. The melting temperatures by the EWOD more closely agree with those by the manual experiments. Although the differences also increase with the concentration of DMSO, these are notably smaller than those of the crystallization temperatures and are not statistically significant (p > 0.42). When compared the DSC measurements, the phase change temperatures of DSC were well-matched with those of EWOD and manual measurements, which phase change temperature of 12.5 % and 25% DMSO concentrations by DSC are −31.6 ±0.5 °C and 36.2 ± 2.4 °C during freezing and −6.2 ±0.2 °C and 9.7 ±1.2 °C during thawing, respectively. Overall, the temperatures measured with the EWOD platform agree well with the manual experiments and DSC experiments. Besides the agreement with the manual measurements, the results by EWOD platform have smaller standard deviations than those of the manual measurements. (i.e., max. ± 8.65 °C at freezing, max. ±9.2 °C at thawing in manual test). This agrees with previous studies reporting that reducing the volume of liquid droplet is a reliable way to measure crystal nucleation kinetics.36, 39
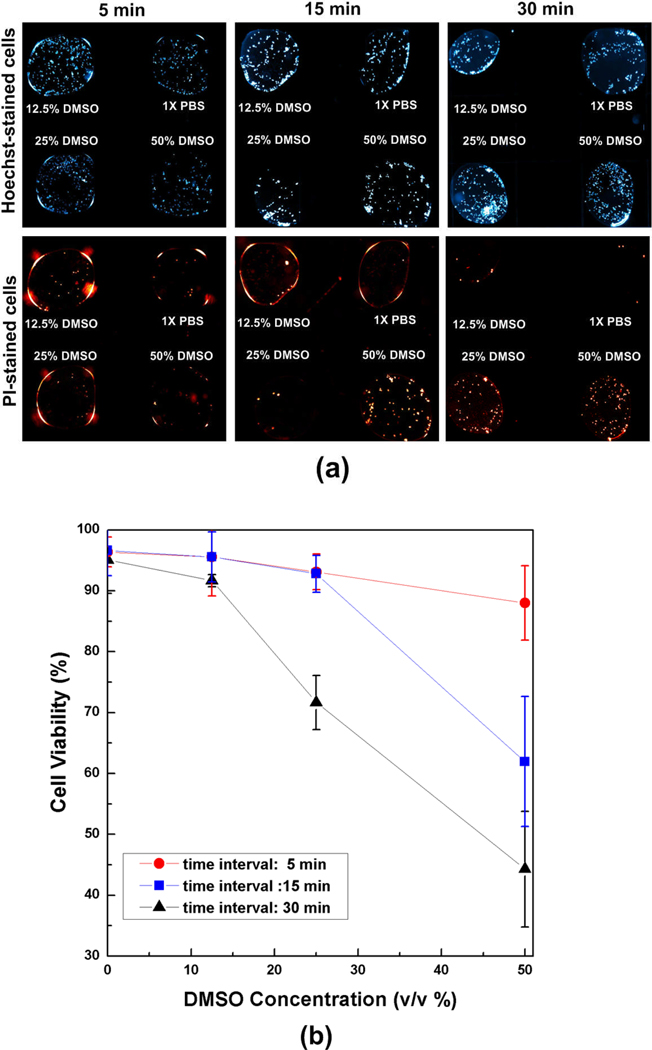
The cellular viability after the exposure to DMSO-PBS mixtures is shown in Fig. 5. For the 5-minute exposure time, most cells were live regardless of DMSO concentrations (i.e., no PI stained cells). However, most cells in 50% DMSO mixtures are injured after 15-minute exposure, and similar injury was observed in the 25 % DMSO mixtures after 30-minute exposure. The viability changes with respect to DMSO concentration and exposure time are plotted in Fig. 5b as a measure of cellular level toxicity of the mixtures. The total cell densities among the droplets had some variations, but the differences are not statistically significant (p > 0.09). For a given exposure time, the viability generally decreases with DMSO concentration. For 5-minute exposure, the cellular viability was higher than 90% for all DMSO concentration studies. However, notable viability decrease was observed at 25% DMSO concentration at 30-minute exposure (viability = 71.6 ± 4.5 %) and at 50% DMSO concentration at 15-minute exposure (viability = 61.9 ± 10.6 %). This result is useful to determine the composition/ concentration of CPA mixtures with acceptable toxicity and to design CPA loading protocols with acceptable toxicity for a given type of cells.
Figure 5.
Toxicity screening of DMSO-PBS mixtures. (a) Fluorescence micrographs of cell suspension droplets exposed to DMSO-PBS mixtures. After the exposure, the droplets were mixed with viability dye droplets to stain all cells with Hoechst and injured cells with PI. (b) Cell viability with respect to DMSO concentrations (v/v %) and exposure time (n ≥ 3 for each point). The viability decreases with the DMSO concentration and the exposure time.
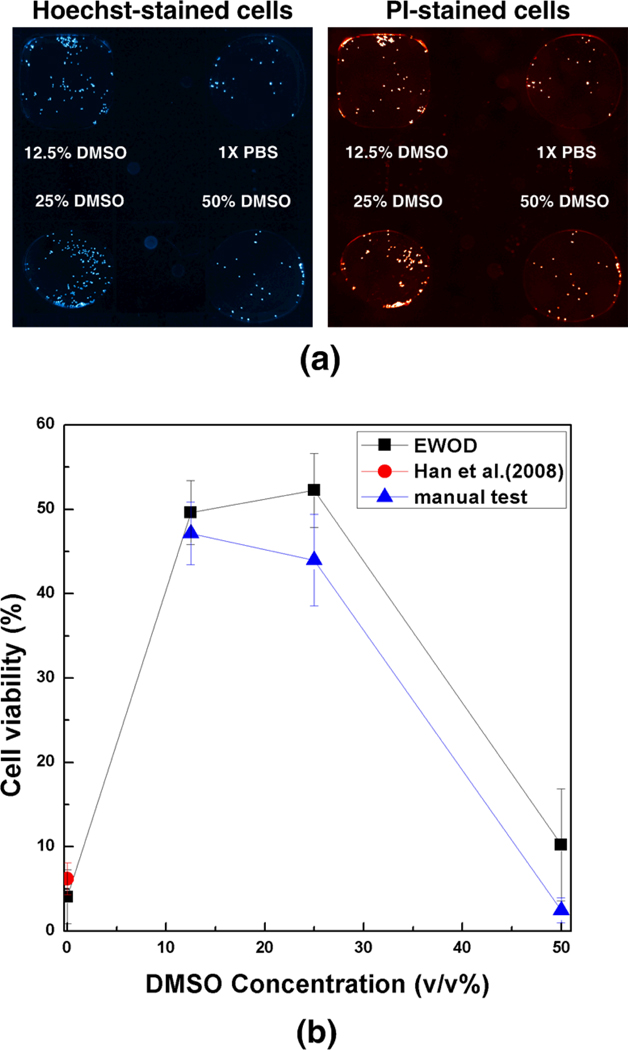
The cryoprotection of DMSO-PBS mixtures are shown in Fig. 6 in terms of post-thaw viability of MCF-7 cells. Fluorescent images of post-thawed cells on the EWOD platform are shown in Fig. 6a. The measured post-thaw cell viability with respect to DMSO concentrations (v/v %) is shown in Figure 6b. At 0% DMSO, almost all cells are dead after F/T due to cryoinjury, and the viability was 4.0 ± 3.2 %. Similarly, cells with 50% DMSO concentration are also significantly injured (10.2 ± 6.3 %), but these injuries are thought to be caused by cryoinjury as well as DMSO toxicity as shown in Fig. 5. However, at the 12.5 % and 25 % DMSO concentrations, the post-thaw survival substantially increased showing the viability of 49.6 ± 3.2 %, and 52.3 ± 3.8 %, respectively. From the result, it could be anticipated that the optimal DMSO-PBS concentrations for the cryopreservation of MCF-7 cell line are in the range of 12.5 % and 25 % DMSO concentrations. The measured post-thaw cell viability was compared with those obtained by manual experiments, and those from previous study reported elsewhere.35 The viability of cell suspension without DMSO by Han et al.35 is 6.2 ± 1.9%, and the viability of the 12.5 %, 25 %, 50 % DMSO-PBS cell suspension at manual test are 47.1 ± 3.7 %, 44.9 ± 5.4 %, and 2.5 ± 1.5 %, respectively. Overall, the viability by the manual test are lower than that by the EWOD platform, but the differences are not statistically significant for all experimental points (p > 0.1).
Figure 6.
Screening for cryoprotection of DMSO-PBS mixtures. The cell suspension droplets were mixed with DMSO-PBS mixtures and then frozen/thawed. After F/T, these droplets were further mixed with the viability dye droplets to assess post-thaw viability. (a) Fluorescence micrographs of cell suspension droplets after F/T. (b) Post-thaw cell viability with respect to DMSO concentrations (v/v %). The EWOD results imply that 12.5% and 25% DMSO mixtures are the optimal conditions for cryoprotection of MCF-7 cells. The differences of EWOD and macro experiments are not statistically significant (p > 0.05) for all experimental points (n ≥ 3 for each point).
DISCUSSION
The present results demonstrate the capabilities of the EWOD platform for screening and characterization of CPA mixtures for cryopreservation. In order to screen CPA mixtures, various parameters should be considered. These parameters include the concentration and composition of CPA mixtures, loading/unloading characteristics of the mixtures, phase change behavior and the subsequent biophysics at the cellular and tissue levels.40 Although Hunt et al.41 proposed a methodological optimization of cryopreservation protocols through the following steps - 1) determine the CPA permeability; 2) calculate safe addition range for a chosen CPA; and 3) perform cooling rate study, so far the development and optimization have mainly been achieved by labor-intensive manual experiments with a limited number of CPAs. Thus, it is very slow and tedious to identify optimized CPA mixtures. Moreover, as various CPA cocktails are developed for improved cryoprotection and reduced toxicity,42–45 their thermal properties should also be characterized. Limited knowledge of thermal and transport properties of the mixtures will degenerate the accuracy of prediction models and/or calculations. The present results suggest that the developed EWOD platform is capable of screening and characterizing a wide variety of CPA mixtures with significantly reduced efforts and improved accuracy. Although only 2 × 2 array of CPA mixtures were characterized in the present study, the benefits of the EWOD platform drastically increase as the number of constituents increases. The present EWOD platform screened and characterized four 16 different concentrations of DMSO-PBS mixtures in three repetitions. However, during the manual experiments, 12 freezing/thawing runs were performed to obtain the same amount of data (= 4 concentrations × 3 repetitions) for mapping phase change behavior and post-thaw cell viability. As the number of mixture constituents and cell types increases, the benefits of the proposed platform become enormous.
There are several additional advantages of the EWOD-based platform for the screening of CPA mixtures. For cryopreservation, several microfluidic devices have been introduced to understand osmotic shock by CPA loading/unloading,46–48 and to study the nucleation kinetics in an array of monodisperse droplets.39, 49 These platforms were channel-based microfluidic platforms, which required additional carrier liquids and external pumps to manipulate CPAs in continuous flow and/or had limited capabilities to manipulate multiple CPAs simultaneously for high throughput operations. Unlike continuous-flow based microfluidic platforms using electroosmosis,50, 51 or pressure-based force,52, 53 the EWOD platform enables to manipulate discrete droplets directly by sequentially applying voltages to actuation electrodes, and does not need complicate microfluidic components such as microvalves, micropumps or channels. In addition, the EWOD platform reduces the usage of reagents screened. During the present experiments, approximately 1 µL of reagents were used to generate an array of CPA droplets without any carrier fluid.
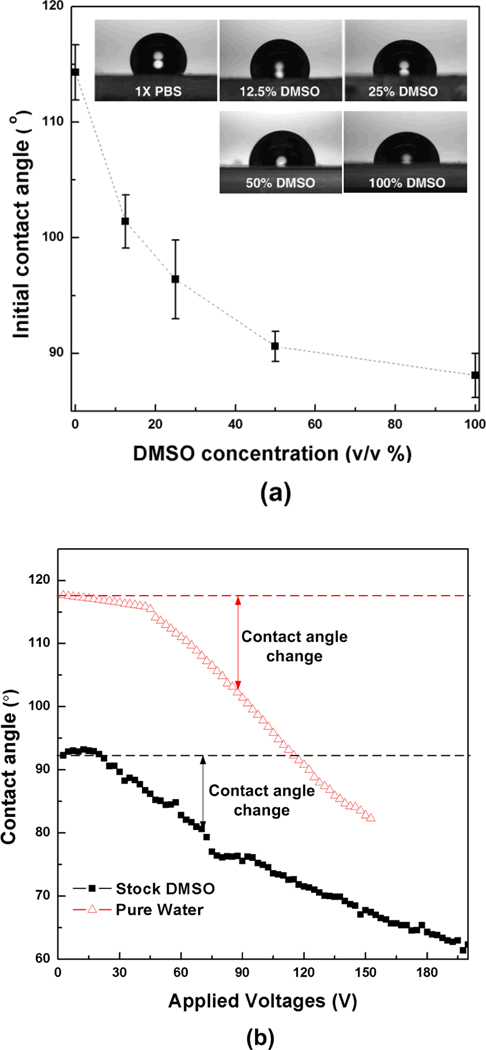
However, the present EWOD-based platform needs to be improved in several features. First, higher accuracy and/or consistency in dispensing droplets from reservoirs of various liquids are desired. Although the developed EWOD platform could generate droplets quite consistently, the difference of the droplet size was noted between stock PBS and DMSO droplets in Fig. 3b. This inconsistent droplet size should be attributed to several parameters including surface tension, contact angle and viscosity of reagents. Although various materials such as pure organic solvents and solutions, ionic liquids, and aqueous surfactants have been manipulated on the EWOD,32, 54–57 more rigorous application of this EWOD platform for screening various candidate CPAs requires better understanding on the effects of these fluidic properties on the EWOD operation. For instance, the effects of DMSO concentration on the contact angle are shown in Fig. 7. The initial contact angle (i.e., contact angle without electric voltage) decreases with the concentration of DMSO from approximately 115° (i.e., pure PBS) to 90° (100% DMSO). Although the change of contact angle with respect to applied voltage (i.e., Fig. 7b) confirms that DMSO mixtures are movable with EWOD operations, this implies that the operating voltage needs to be adjusted to exert the same force to the liquids for more accurate screening and characterization results. The different properties of various reagents or operating parameters (e.g., driving voltage, signal duration, geometry of actuation electrode) may cause unreliable droplet response so that it is difficult to predict or control actuation sequence by programmed automatic operation. This problem becomes more significant when operating cell suspension droplets. Although the use of non-ionic surfactant (pluronic F68) reduces this problem, a droplet of cell suspension at high cell concentration more than 4 × 10⁶ cells/mL is difficult to manipulate or does not move without high voltages (≥150 Vac). Further research is warranted to increase uniformity of cell distribution by EWOD operation. Moreover, how to extent the proposed concept to tissue-level optimization and screening also needs to be addressed.
Figure 7.
Effects of DMSO concentration on the contact angle. (a) Initial contact angles of DMSOPBS mixtures without applied voltages. (b) Contact angle change of pure water and stock DMSO with respect to the applied voltage.
In summary, an EWOD-based microfluidic platform was fabricated to demonstrate the feasibility of screening and characterization of CPA mixtures. An array of DMSO-PBS mixtures with or without cells was prepared at different concentrations by EWOD operations. The phase change behaviors of the prepared mixtures without cells were characterized on the EWOD chip during freezing and thawing. The toxicity assay and post-thaw cell viability assay were performed by on-chip via EWOD operations. The results demonstrate that the EWOD-based platform is capable of screening and characterizing a wide variety of CPA mixtures with high accuracy for cyropreservation. The feasibility of the EWOD platform was demonstrated with chips of 5×5 and 6×6 electrode arrays and the results promise the more efficient high throughput screening and characterization when it becomes a larger arrayed-EWOD chip. This will ultimately help to establish a new and efficient high throughput screening platform and strategies for developing cell/tissue-type specific CPA mixtures and cryopreservation protocols.
Supplementary Material
ACKNOWLEDGMENT
This work is partially supported by National Institutes of Health Grant R01 EB008388 (BH) and Research Enhancement Program of the University of Texas at Arlington (HM). The fabrication was performed at the University of Texas at Arlington Nanofab Facility and at Birck Nanotechnology Center in Purdue University.
REFERENCE
- 1.Pancrazio JJ, Wang F, Kelly CA. Biosensors and Bioelectronics. 2007;22:2803–2811. doi: 10.1016/j.bios.2006.12.023. [DOI] [PubMed] [Google Scholar]
- 2.Acker JP. Adv Biochem Eng Biotechnol. 2007;103:157–187. doi: 10.1007/b137204. [DOI] [PubMed] [Google Scholar]
- 3.Bischof JC. Annual Reviews of Biomedical Engineering. 2000;2:257–288. doi: 10.1146/annurev.bioeng.2.1.257. [DOI] [PubMed] [Google Scholar]
- 4.Coger R, Toner M. Bioengineering Handbook. Boca Raton: CRC Press; 1995. pp. 1567–1577. [Google Scholar]
- 5.Han B, Bischof JC. Cell Preservation Technology. 2004;2:91–112. [Google Scholar]
- 6.Karlsson JOM, Cravalho EG, Toner M. Journal of Applied Physics. 1994;75:4442–4455. [Google Scholar]
- 7.Karlsson JOM, Toner M. Biomaterials. 1996;17:243–256. doi: 10.1016/0142-9612(96)85562-1. [DOI] [PubMed] [Google Scholar]
- 8.Karlsson JOM, Toner M. Principles of Tissue Engineering. San diego: Academic Press; 2000. pp. 293–307. [Google Scholar]
- 9.Pegg DE, Karow AM. New York: Plenum; 1987. pp. 201–236. [Google Scholar]
- 10.Mazur P. American Journal of Physiology. 1984;247:C125–C142. doi: 10.1152/ajpcell.1984.247.3.C125. [DOI] [PubMed] [Google Scholar]
- 11.Karlsson JOM, Cravalho EG, Toner M. Journal of Applied Physics. 1994;75:4442–4455. [Google Scholar]
- 12.Toner M, Cravalho EG, Karel M. Journal of Applied Physics. 1990;67:1582–1593. [Google Scholar]
- 13.Fahy GM. Biophysical Journal. 1980;32:837–850. doi: 10.1016/S0006-3495(80)85019-3. [DOI] [PMC free article] [PubMed] [Google Scholar]
- 14.Pegg DE, Diaper MP. Cryobiology. 1989;26:30–43. doi: 10.1016/0011-2240(89)90031-x. [DOI] [PubMed] [Google Scholar]
- 15.Bhowmick S, Khamis CA, Bischof JC. Annals of New York Academic Science. 1998:147–162. doi: 10.1111/j.1749-6632.1998.tb10149.x. [DOI] [PubMed] [Google Scholar]
- 16.De Freitas RC, Diller KR, Lakey JR, Rajotte RV. Cryobiology. 1997;35:230–239. doi: 10.1006/cryo.1997.2045. [DOI] [PubMed] [Google Scholar]
- 17.McGrath JJ. Heat Transfer in Medicine and Biology. New York: Plenum Press; 1985. [Google Scholar]
- 18.Campbell LH, Brockbank KG. In Vitro Cell Dev. Biol. Anim. 2007;43:269–275. doi: 10.1007/s11626-007-9039-z. [DOI] [PubMed] [Google Scholar]
- 19.Dahl SL, Chen Z, Solan AK, Brockbank KG, Niklasson LE, Song YC. Tissue Eng. 2006;12:291–300. doi: 10.1089/ten.2006.12.291. [DOI] [PubMed] [Google Scholar]
- 20.Elder E, Chen Z, Ensley A, Nerem RM, Brockbank KG, Song YC. Transplant Proc. 2005;37:4625–4629. doi: 10.1016/j.transproceed.2005.10.033. [DOI] [PubMed] [Google Scholar]
- 21.Halberstadt M, Athmann S, Hagenah M. Cryobiology. 2001;43:71–80. doi: 10.1006/cryo.2001.2342. [DOI] [PubMed] [Google Scholar]
- 22.Kardak A, Leibo SP, Devireddy RV. Journal of Biomechanical Engineering. 2007;129:688–694. doi: 10.1115/1.2768107. [DOI] [PubMed] [Google Scholar]
- 23.Song YC, Chen Z, Mukherjee N, Lightfoot F, Taylor MJ, Brockbank KG, Sambanis A. Transplant Proc. 2005;37:253–255. doi: 10.1016/j.transproceed.2004.11.027. [DOI] [PubMed] [Google Scholar]
- 24.Wusteman MC, Simmonds J, Vaughan D, Pegg DE. Cryobiology. 2008;56:62–71. doi: 10.1016/j.cryobiol.2007.10.177. [DOI] [PubMed] [Google Scholar]
- 25.Eroglu A, Bailey SE, Toner M, Toth TL. Biology of Reproduction. 2009;80:70–78. doi: 10.1095/biolreprod.108.070383. [DOI] [PMC free article] [PubMed] [Google Scholar]
- 26.Sasnoor LM, Kale VP, Limaye LS. J Hematother Stem Cell Res. 2003;12:553–564. doi: 10.1089/152581603322448268. [DOI] [PubMed] [Google Scholar]
- 27.Fan S-K, Huang P-W, Wang T-T, Peng Y-H. Lab Chip. 2008;8:1325–1331. doi: 10.1039/b803204a. [DOI] [PubMed] [Google Scholar]
- 28.Malic L, Brassard D, Veres T, Tabrizian M. Lab Chip. 2010;10:418–431. doi: 10.1039/b917668c. [DOI] [PubMed] [Google Scholar]
- 29.Miller EM, Wheeler AR. Anal. Chem. 2008;80:1614–1619. doi: 10.1021/ac702269d. [DOI] [PubMed] [Google Scholar]
- 30.Moon H, Wheeler AR, Garrell RL, Loo JA, Kim C-J. Lab Chip. 2006;6:1213–1219. doi: 10.1039/b601954d. [DOI] [PubMed] [Google Scholar]
- 31.Srinivasan V, Pamula VK, Fair RB. Lab Chip. 2004;4:310–315. doi: 10.1039/b403341h. [DOI] [PubMed] [Google Scholar]
- 32.Wheeler AR, Moon H, Bird CA, Loo RRO, Kim CJ, Loo JA, Garrell RL. Anal. Chem. 2005;77:534–540. doi: 10.1021/ac048754+. [DOI] [PubMed] [Google Scholar]
- 33.Chang YJ, Mohseni K, Bright VM. Sensors and Actuators A. 2007;136:546–553. [Google Scholar]
- 34.Barbulovic-Nad I, Yang H, Park PS, Wheeler AR. Lab Chip. 2008;8:519–526. doi: 10.1039/b717759c. [DOI] [PubMed] [Google Scholar]
- 35.Han B, Swanlund DJ, Bischof JC. Technol. Cancer Res. Treat. 2008;6:625–634. doi: 10.1177/153303460700600606. [DOI] [PubMed] [Google Scholar]
- 36.Choi J, Bischof JC. Cryobiology. 2010;60:52–70. doi: 10.1016/j.cryobiol.2009.11.004. [DOI] [PMC free article] [PubMed] [Google Scholar]
- 37.Han B, Bischof JC. Journal of Biomechanical Engineering. 2004;126:196–203. doi: 10.1115/1.1688778. [DOI] [PubMed] [Google Scholar]
- 38.Rasmussen DH, MarKenzie AP. Nature. 1968;220:1315–1316. doi: 10.1038/2201315a0. [DOI] [PubMed] [Google Scholar]
- 39.Edd JF, Humphry KJ, Irimia D, Weitz DA, Toner M. Lab Chip. 2009;9:1859–1865. doi: 10.1039/b821785h. [DOI] [PMC free article] [PubMed] [Google Scholar]
- 40.Wusteman MC, Pegg DE, Robinson MP, Wang L. Cryobiology. 2002;44:24–37. doi: 10.1016/S0011-2240(02)00002-0. [DOI] [PubMed] [Google Scholar]
- 41.Hunt CJ, Pegg DE, Armitage SE. Cryo Letters. 2006;27:73–86. [PubMed] [Google Scholar]
- 42.Cleland D, Krader P, McCree C, Tang J, Emerson D. Journal of Microbiological Methods. 2004;58:31–38. doi: 10.1016/j.mimet.2004.02.015. [DOI] [PubMed] [Google Scholar]
- 43.Djerassi I, Roy A, Kim J, Cavins J. Transfusion. 2009;11:72–76. doi: 10.1111/j.1537-2995.1971.tb04379.x. [DOI] [PubMed] [Google Scholar]
- 44.Li Y, Lu RH, Luo GF, Pang WJ, Yang GS. Cryobiology. 2006;53:240–247. doi: 10.1016/j.cryobiol.2006.06.007. [DOI] [PubMed] [Google Scholar]
- 45.Rahman SM, Majhi SK, Suzuki T, Matsukawa S, Strüssmann CA, Takai R. Cryobiology. 2008;57:170–174. doi: 10.1016/j.cryobiol.2008.08.002. [DOI] [PubMed] [Google Scholar]
- 46.Chen H-h, Shen H, Heimfeld S, Tran KK, Reems J, Folch A, Gao D. International Journal of Heat and Mass Transfer. 2008;51:5687–6594. [Google Scholar]
- 47.Fleming KK, Longmire EK, Hubel A. Journal of Biomechanical Engineering. 2007;129:703–711. doi: 10.1115/1.2768373. [DOI] [PubMed] [Google Scholar]
- 48.Song YS, Moon S, Hulli L, Hasan SK, Kayaalp E, Demirci U. Lab Chip. 2009;9:1874–1881. doi: 10.1039/b823062e. [DOI] [PMC free article] [PubMed] [Google Scholar]
- 49.Laval P, Salmon J-B, Joanicot M. Journal of Crystal Growth. 2007;303:622–628. [Google Scholar]
- 50.Chou H-P, Spence C, Scherer A, Quake SR. Proc. Natl. Acad. Sci. 1999;96:11–13. doi: 10.1073/pnas.96.1.11. [DOI] [PMC free article] [PubMed] [Google Scholar]
- 51.Sundberg SA, Chow A, Nikiforov T, Wada HG. Drug Discovery Today. 2001;5:92–103. doi: 10.1016/s1359-6446(00)00065-9. [DOI] [PubMed] [Google Scholar]
- 52.Moraes C, Chen J-H, Sun Y, Simmons CA. Lab Chip. 2009;10:227–234. doi: 10.1039/b914460a. [DOI] [PubMed] [Google Scholar]
- 53.Thorsen TA. BioTechniques. 2004;36:197–199. doi: 10.2144/04362TE01. [DOI] [PubMed] [Google Scholar]
- 54.Chatterjee D, Hetayothin B, Wheeler AR, King DJ, Garrell RL. Lab Chip. 2006;6:199–206. doi: 10.1039/b515566e. [DOI] [PubMed] [Google Scholar]
- 55.Chatterjee D, Shepherd H, Garrell RL. Lab Chip. 2009;9:1219–1229. doi: 10.1039/b901375j. [DOI] [PubMed] [Google Scholar]
- 56.Dubois P, Marchand G, Fouillet Y, Berthier J, Douki T, Hassine F, Gmouh S, Vaultier M. Anal. Chem. 2006;78:4909–4917. doi: 10.1021/ac060481q. [DOI] [PubMed] [Google Scholar]
- 57.Wheeler AR, Moon H, Kim C-J, Loo JA, Garrell RL. Anal. Chem. 2004;76:4833–4838. doi: 10.1021/ac0498112. [DOI] [PubMed] [Google Scholar]
Associated Data
This section collects any data citations, data availability statements, or supplementary materials included in this article.


