

Abstract
Multiscale modeling provides a powerful and quantitative platform for investigating the complexity inherent in intracellular signaling pathways and rationalizing the effects of molecular perturbations on downstream signaling events and ultimately, on the cell phenotype. Here we describe the application of a multiscale modeling scheme to the HER3/ErbB3 receptor tyrosine kinase (RTK) signaling network, which regulates critical cellular processes including proliferation, migration and differentiation. The HER3 kinase is a topic of current interest and investigation, as it has been implicated in mechanisms of resistance to tyrosine kinase inhibition (TKI) of EGFR and HER2 in the treatment of many human malignancies. Moreover, the commonly regarded status of HER3 as a catalytically inactive ‘pseudokinase’ has recently been challenged by our previous study, which demonstrated robust residual kinase activity for HER3. Through our multiscale model, we investigate the most significant molecular interactions that contribute to potential mechanisms of HER3 activity and the physiological relevance of this activity to mechanisms of drug resistance in an ErbB-driven tumor cell in silico. The results of our molecular-scale simulations support the characterization of HER3 as a weakly active kinase that, in contrast to its fully-active ErbB family members, depends upon a unique hydrophobic interface to coordinate the alignment of specific catalytic residues required for its activity. Translating our molecular simulation results of the uniquely active behavior of the HER3 kinase into a physiologically relevant environment, our HER3 signaling model demonstrates that even a weak level of HER3 activity may be sufficient to induce AKT signaling and TKI resistance in the context of an ErbB signaling-dependent tumor cell, and therefore therapeutic targeting of HER3 may represent a superior treatment strategy for specific ErbB-driven cancers.
1. Introduction
Approximately 10%, or 48 of the 518 protein kinases encoded by the human genome, lack at least one of three catalytic amino acid motifs in the kinase domain, including the Val-Ala-Ile-Lys (VAIK) motif in subdomain II, in which the lysine residue facilitates the positioning of the ATP molecule, the His-Arg-Asp (HRD) motif in subdomain VIb, which contains the catalytic aspartic acid residue responsible for deprotonating the substrate hydroxyl group, and the Asp-Phe-Gly (DFG) motif in the A-loop, which contains the Mg2+-coordinating aspartic acid residue that orients the β and γ phosphates of ATP.1, 2 These kinases, termed ‘pseudokinases’, are therefore commonly regarded as catalytically inactive. However, not all kinase domains that lack one or more of the conserved catalytic motifs are inactive. The kinase WNK1 is catalytically active despite lacking the crucial lysine in its VAIK motif, as a lysine residue in subdomain I performs the function of the missing amino acid.3 In a recent structural and biochemical study, Mukherjee et al.4 resolved the crystal structure of the pseudokinase domain of Ca2+/calmodulin-activated serine threonine kinase (CASK), which lacks both of the canonical Mg2+-coordinating residues, and determined that CASK employs an unusual phosphorylation mechanism in which the kinase preferentially binds unchelated nucleotides, and is hence capable of catalyzing phosphotransfer despite lacking the conserved DFG motif. It is therefore plausible that other pseudokinases are not truly inactive, but may employ alternative modes of ATP binding and phosphoryl transfer.
In the ErbB family of receptor tyrosine kinases (RTKs), which includes epidermal growth factor receptor (EGFR/ErbB1), ErbB2 (HER2), ErbB3 (HER3) and ErbB4 (HER4), ligand binding followed by receptor homo- or heterodimerization performs a crucial role in regulating critical cellular processes including migration, differentiation, and proliferation.5–9 EGFR, HER2, and HER4 all observe the canonical mechanism of phosphate transfer. HER3, however, is the only member of the ErbB family that has long been regarded as an inactive pseudokinase due to amino acid substitutions in the conserved kinase domain. Until recently, HER3 activity has been largely undermined, as it contains an asparagine residue (N815) in place of the catalytic aspartic acid residue that is responsible for deprotonating the substrate hydroxyl group.10 In addition, a crucial glutamate residue in the αC helix, which indirectly participates in ATP-binding, is replaced by a histidine (H740) in HER3. Hence it has been widely believed that HER3 is dependent on interactions with the other active ErbB receptors for its biological activity.
However, it was recently demonstrated that HER3 does, in fact, exhibit robust residual kinase activity that may be crucial for ErbB signaling. Two recent studies by Jura et al.11 and Shi et al.12 resolved the crystal structure of the HER3 kinase domain, revealing an inactive-like conformation. In addition, Shi et al.12 demonstrated that, when clustered at a membrane surface, the purified HER3 intracellular domain is capable of robust auto-phosphorylation, albeit at a level 1000-fold weaker than the active EGFR kinase, and that the kinase domain binds ATP with an affinity similar to that of other active kinases. In the same study,12 our quantum mechanics molecular mechanics (QM/MM) simulations suggested that HER3 may catalyze phosphoryl transfer from its inactive-like kinase conformation via an alternative pathway, which explains the 1000-fold slower rate of phosphoryl transfer in HER3 compared to EGFR: the alternative pathway involves the migration of the substrate tyrosyl −OH proton directly to the Olγ oxygen of ATP, hence obviating the requirement for the catalytic aspartate residue. Our study suggests the intriguing possibility that therapeutic targeting of the robust activity of HER3, rather than the routinely-targeted EGFR and HER2 kinases, may provide a more effective treatment strategy for specific ErbB-driven cancers. However, a major question arising from our work is: what is the physiological relevance, if any, of weak HER3 activity to ErbB signaling in the cell?
This question is clinically pertinent as over-expression and activating mutations of the ErbB kinases are implicated in cellular transformation and clinical malignancies including lung and breast cancers. 13–19 Recent studies have demonstrated that mechanisms of resistance to tyrosine kinase inhibition (TKI) of EGFR and HER2 in the treatment of certain human malignancies are mediated by HER3.20–23 In this scenario, it is hypothesized that incomplete inhibition of HER2 catalytic activity restores phosphorylation of HER3 in the context of HER2/3 heterodimers. As HER3 contains six PI3K-binding sites in its C-tail, leaky HER3 phosphorylation induces proliferative signaling through the PI3K–AKT pathway.20 However, the detailed molecular mechanism of this process remains an open question. Indeed, it is possible that HER3 catalytic activity is involved in the TKI resistance mechanism.
To explore the implications of HER3 activity for ErbB signaling and TKI resistance, a multiscale modeling approach is advantageous. Multiscale computational modeling has been applied to a variety of biological systems24–28 to help quantify the complexity inherent in intracellular signaling networks. As the biochemical processes within a cell occur on multiple spatial and temporal scales, a multiscale modeling approach is necessary to represent a hierarchy of interactions ranging from the molecular (nm, ns) to cellular signaling (μm, ms) length and time scales. Multiscale modeling provides a powerful and quantitative methodology for studying the effects of molecular perturbations, in our case, HER3 catalytic activity, on downstream signaling events, i.e., the ErbB signaling network and development of TKI resistance.
In light of the implication of HER3 in TKI resistance mechanisms, the recent interest in catalytic mechanisms of pseudokinases and particularly in the potential for HER3 activity demonstrated by Shi et al.,12 we pursue a multiscale modeling study of the HER3 kinase system at the molecular and cellular levels (Fig. 1). A variety of modeling techniques, ranging from atomic-level molecular dynamics (MD) simulations to systems-level modeling, are applied to investigate the non-canonical catalytic mechanism employed by the HER3 kinase and the physiological relevance of this activity to mechanisms of drug resistance in an ErbB-driven tumor cell in silico. Specifically, we construct and assess several homology models of the HER3 kinase to provide a framework for comparing the ErbB kinase active sites and identifying the molecular features that distinguish HER3 from the other nodes (EGFR and HER2) in our multiscale model of HER3 activity. The results of our molecular-scale simulations support the characterization of HER3 as a weakly active kinase that, in contrast to its fully-active ErbB family members, depends upon a unique hydrophobic interface to coordinate the alignment of specific catalytic residues required for its activity. Translating our molecular simulation results of the uniquely active behavior of the HER3 kinase into a physiologically relevant environment (Fig. 1), our HER3 signaling model demonstrates that even a weak level of HER3 activity may be sufficient to induce AKT signaling and TKI resistance in the context of an ErbB signaling-dependent tumor cell, and therefore therapeutic targeting of HER3 may represent a superior treatment strategy for specific ErbB-driven cancers.
Fig. 1.

Representation of the multiscale model of HER3 activity. (A) Schematic of the HER3 network model topology, in which ligand stimulation of EGFR:HER3, HER2:HER3, and HER3:HER3 dimers induces the AKT cascade. (B) The HER3 node in (A) is examined at molecular resolution. The molecular model comprises two parts: homology modeling to refine the HER3 kinase crystal structure, and molecular dynamics simulations of the refined HER3 structure to identify the molecular features which distinguish HER3's unique mechanism of activity from that of the EGFR and HER2 nodes in the HER3 network model. (C) Process diagram of the HER3 network model in SBGN notation (see Methods). The aim of the HER3 network model is to investigate the implications of HER3 activity for ErbB signaling dynamics and mechanisms of HER3-mediated drug resistance in an ErbB-driven tumor cell in silico. Note that, for clarity, only HER3 dimers are illustrated in (C), although EGFR:HER3 and HER2:HER3 dimers are also present in the network model.
2. Results and discussion
2.1 Topology of the multiscale model of HER3 activity
Our previous experimental and computational study,12 which elucidated the robust activity of the HER3 kinase, raised the possibility that HER3 may play an active role in ErbB signaling dynamics. To investigate the relevance of our results to ErbB activity in a cellular context, we propose a pathway model of the HER3 signaling network (Fig. 1A), in which ligand stimulation of the HER3, EGFR, and HER2 RTKs results in induction of the PI3K–AKT cascade. The ligand-induced coupling of the EGFR, HER2, and HER3 nodes to the PI3K–AKT pathway has been extensively validated computationally and experimentally,8,29–34 although thus far HER3 has been postulated to play a passive role in the ErbB–AKT signaling network, in that its phosphorylation (and hence, recruitment of PI3K/AKT) depends upon the catalytic activities of the EGFR and HER2 RTKs. Here we propose that HER3 can activate independently of its ErbB family members, a hypothesis which is reflected in the topology of our HER3 signaling pathway (Fig. 1A), and is based on a combination of recent in silico, in vitro, and in vivo evidence of HER3 activity. Namely, the in vitro kinase assays performed by Shi et al.12 demonstrated that, in the absence of its ErbB family members, the purified HER3 kinase is capable of robust autophosphorylation, a result that was further supported by our electronic-level simulations of an alternative catalytic pathway in HER3. Additional in vitro evidence of HER3 activity derives from observations of tyrosine phosphorylation of ligand-induced HER2 and HER3 RTKs in cells that express only these two ErbB receptors.32 Given current models of ErbB receptor activation, in which one kinase domain in an ErbB dimer allosterically activates its neighbor and itself becomes trans-phosphorylated,35,36 it is not clear how HER2 could be trans-phosphorylated in HER2–HER3 heterodimers through this mechanism unless HER3 has kinase activity of its own. Furthermore, previous experimental studies have demonstrated that HER3 is a key mediator of resistance to various tyrosine kinase inhibitors (TKIs) currently in use,20,21,37–39 although the resistance mechanism remains an open question. In particular, Sergina et al.20 reported observations of HER3-mediated resistance and pAKT signaling in various TKI-treated tumor cell lines as well as in vivo.
In the current study, we aim to further substantiate the inclusion of HER3 as a uniquely and independently-active node in our ErbB pathway model (Fig. 1A), in order to quantitatively evaluate the implications of HER3 activity for ErbB signaling dynamics and mechanisms of HER3-mediated drug resistance in an ErbB-driven tumor cell in silico (Fig. 1C). Our multiscale model of HER3 activity begins with atomic-level simulations of the HER3 kinase crystal structure (Fig. 1B), in order to identify the molecular features which distinguish HER3 from the other nodes (EGFR, HER2) in our proposed ErbB signaling network. Moreover, our molecular simulations address clinically-relevant questions regarding the mechanism and specific types of interactions that enable HER3 to maintain its robust activity.
2.2 Homology modeling of the HER3 kinase domain
As the recently-resolved HER3 crystal structure11,12 is missing several amino acid residues in catalytically important sub-domains, we applied a homology modeling algorithm to build in these residues and construct a complete HER3 kinase structure for our molecular simulations. An additional advantage of our homology modeling analysis is that it provides a means of deriving insights into a structural comparison of the ErbB kinase active sites and the molecular features which distinguish HER3 from the other nodes (EGFR and HER2) in our HER3 pathway model (Fig. 1A). As the HER3 kinase domain shares a relatively high level of sequence identity with its ErbB family members (54% and 63% identity with EGFR and HER4, respectively) (Fig. 2), and the crystal structures of these kinases have been determined,36,40,41 we selected EGFR (PDB code 2GS7)36 and HER4 (PDB code 3BBT)41 as templates for homology modeling of the HER3 kinase in the inactive-like conformation. In addition, we applied the multiple templates (MT) algorithm in MODELLER42 to generate a HER3 kinase model based on a combination of the EGFR and HER4 crystal structures. To verify that EGFR and HER4 were the most suitable templates available for modeling HER3, a search was performed in MODELLER's internal database for other proteins that might have high sequence identity with HER3. The ErbB receptor kinases were confirmed to be the most homologous structures for modeling of the HER3 kinase domain.
Fig. 2.

Multiple sequence alignment of the kinase domains of the ErbB RTK family members. Residues highlighted in gray are conserved among all four ErbB kinases, whereas residues highlighted in yellow are unique to HER3. The HER3 kinase shares a relatively high level of sequence identity with its family members (54%, 55% and 63% identity with EGFR, HER2, and HER4, respectively). The key catalytic sub-domains (A-loop, C-loop, N-loop, αC-helix, and β3-αC loop) are labeled.
The protein sequence selected for alignment of the kinase domains included residues 678–957 (EGFR) and 683–962 (HER4); we opted to exclude the flexible C-tail from the alignment, as its sequence is highly variable among the ErbB kinases. A total of 50 models were generated from each of the templates (EGFR, HER4, and multiple templates) by satisfying a set of static and dynamic spatial restraints in MODELLER. In addition, we applied the loop-modeling algorithm in MODELLER43 (see ESI† text) to remodel the flexible A-loop (residues 833–855 in HER3), as the HER3 crystal structure is lacking these amino acids. The top models (shown in Fig. 3) were selected based on stereochemical quality and the Discrete Optimized Protein Energy (DOPE) method,44 which is an atomic distance-dependent statistical potential optimized for model assessment in MODELLER (see ESI† text and Fig. S1–S3).
Fig. 3.

The top 10 HER3 homology models for the structures based on (A) the EGFR template, (B) the HER4 template, (C) Multiple templates and (D) the loop-modeled HER3 crystal structure are superimposed in each panel. The structures are color-coded according to their root mean square deviation (RMSD), where red regions indicate large RMSD values and blue regions represent small RMSD values (closely aligned structures). The original unrefined model for each HER3 structure is shown in yellow. The top structures form a dominant cluster of conformations in each HER3 model, indicating a pronounced energy minimum and a higher level of accuracy in the best structural prediction.
A comparison of the most energetically favorable models derived from each template revealed several similarities in structure and in DOPE energies: overall, the C-lobes of the kinase models are similar, as are the DOPE profiles, although the DOPE scores in the A-loop region are lowest for the HER4- and MT-based models (Fig. 4B). However, in comparing the top homology-modeled structures to the HER3 crystal structure, we observed several conformational differences, which can be better understood by first describing the major structural features that distinguish the HER3 crystal structure from the EGFR and HER4 structures. A unique feature of the catalytic site in the HER3 crystal structure is the truncated N-terminus of the αC helix (Fig. 4A); in the EGFR and HER4 kinase crystal structures, the helix is fully formed. The molten terminus of the HER3 αC helix forms a loop, referred to as the β3-αC loop, which interacts with specific sub-regions of the catalytic site, including the short 310 helix in the A-loop, to form a hydrophobic interface that maintains the weakly-active conformation of HER3 and is not observed in EGFR or HER4.45 F734, which is located in the P3-αC loop and corresponds to an Asn in EGFR and HER4, appears to nucleate the hydrophobic interface (Fig. 4A),45 and V836, L839 and L840, which are located in the 310 helix, form hydrophobic contacts with the truncated αC helix. The extensive set of residues stabilizing the hydrophobic interface and the 310 helix are unique to HER3 and function to maintain the distinctive catalytic site conformation resolved in the HER3 crystal structure.
Fig. 4.
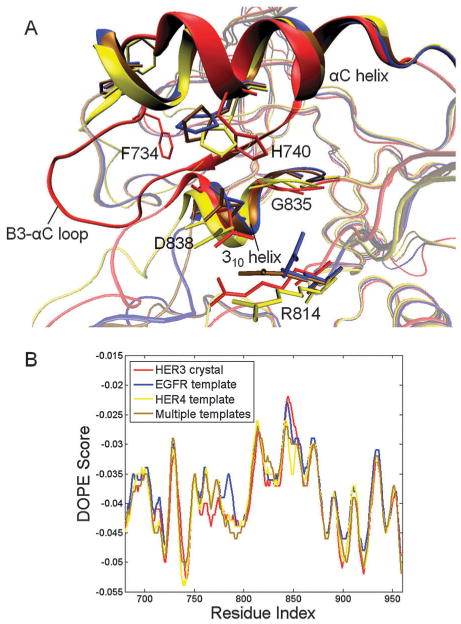
(A) Superposition of the top HER3 models constructed from the ErbB templates: EGFR (blue), HER4 (yellow) and multiple templates (brown) as well as the HER3 crystal structure (red) (PDB code 3LMG). Key residues contributing to the hydrophobic interface in HER3 are highlighted. (B) DOPE energy plots for the top HER3 models based on each ErbB template after A-loop refinement. The HER4- and MT-based models exhibit lower DOPE energies in certain regions, including the sequence spanning residues 775-800. The DOPE energy plot for the HER3 crystal structure (PDB code 3LMG) is illustrated for reference.
In comparing our top homology-modeled structures to the HER3 crystal structure, we focused on the unique set of interactions in the β3-αC loop, αC helix and 310 helix (Fig. 4A). The side-chain conformations of the aliphatic residues in the 310 helix, including V836, L839, and L840, were correctly predicted in the models derived from EGFR, HER4, and MT. This result is not entirely surprising, as the inactive EGFR and HER4 templates also contain the 310 helix in the A-loop. However, F734, which serves to nucleate the hydrophobic interface in the HER3 crystal structure, points away from the hydrophobic pocket in the homology models. The reason for the altered F734 conformation is depicted in Fig. 4A, which illustrates that the homology models contain a fully formed αC helix in place of the truncated helix and extended β3-αC loop (which contains F734) in the HER3 crystal structure. In addition, the H740 ring in the αC helix, which stabilizes the 310 helix in the HER3 crystal structure via contacts with G835 in the DFG motif, is flipped away from G835 in the homology models. The D838-R814 bond, which bridges the 310 helix and the C-loop in the HER3 crystal structure, is conserved in the HER4- and MT-based models, whereas the residues are unbonded in the EGFR-based model. The HER4-based model more closely mimics the extended β3-αC loop in the HER3 crystal structure, as the apex of the loop projects away from the catalytic site.
Although none of the homology models correctly predict the molten αC helix, several features of the HER4- and MT-based models, including the D838–R814 bond, approximate the HER3 crystal structure more closely than does the model derived from the EGFR template. Additionally, the DOPE plots for the top structures (Fig. 4B) reveal smaller (more favorable) DOPE energies for the HER4- and MT-based models, especially for residues 775–800, which exhibit an energy peak in the EGFR-based model, and residues 840–860 in the A-loop. These results may be attributed to the closer evolutionary ties between HER3 and HER4, as HER3 and HER4 are thought to have emerged from a gene duplication event separate from the one that led to EGFR and HER2.46 Indeed, Jura et al.11 postulate that the N-lobe dimer observed in their resolved HER3 and HER4 crystal structures but not in their EGFR structure may be a consequence of the evolutionary homology between HER3 and HER4. In addition to providing a complete HER3 kinase structure for our molecular simulations, our homology modeling analysis presents a framework for identifying the molecular features that contribute to HER3's unique catalytic conformation, which further validates the treatment of HER3 as a distinctive node in our proposed ErbB pathway model (Fig. 1A).
2.3 Molecular dynamics simulations of the HER3 kinase
While our homology modeling analysis of the HER3 crystal structure provides insights into specific amino acid motifs and conformational features that distinguish HER3 from its fully-active ErbB family members, in order to identify the most significant molecular interactions that contribute to potential mechanisms of HER3 activity, it is necessary to provide a dynamic picture of the HER3 kinase. To address the dynamic behavior of the HER3 kinase, we performed 10 ns molecular dynamics (MD) simulations of the complete HER3 crystal structure (PDB code 3LMG)12 in an explicitly solvated state (see Methods). The HER3 structure was stable for the duration of the simulation, as indicated by the time-course plots of the root mean square deviation (RMSD) of the backbone atoms (Fig. S4, ESI†). We then performed a series of analyses of the MD trajectory to answer the following questions: does HER3 behave similarly to an active kinase (i.e., fully-active EGFR, HER2 and HER4) at the atomic level? Furthermore, what types of molecular interactions enable HER3 to maintain its weak yet robust activity? These questions are important for justifying, at molecular resolution, the representation of HER3 as a uniquely active node in our ErbB pathway model (Fig. 1A).
PCA reveals that the dynamic behavior of HER3 at the molecular level diverges from that of an inactive ErbB kinase
Principal component analysis (PCA) was applied to the 10 ns MD trajectory of the HER3 crystal structure to characterize the most significant global motions of the HER3 kinase. The PCA calculation is based on the diagonalization of the variance-covariance matrix of the atomic fluctuations along the MD trajectory to yield the set of eigenvectors (PCs) and associated eigenvalues. The eigenvectors represent the independent modes of atomic motion, and the eigenvalues reflect the contribution of the corresponding eigenvectors to the global fluctuation of the protein.
Motion along the first eigenmode for the complete HER3 kinase was compared to PCA trajectories for the inactive and active conformations of EGFR, HER2 and HER4 that had been previously simulated by us;25, 47–50 overall the global motions of the kinases were conserved across the ErbB family members (Fig. S5, ESI†). To determine whether the PCA pattern was also conserved in HER3's unique catalytic site, we applied PCA to an active site region which included the A-, C-, and N-loops and the αC helix. Fig. 5 illustrates that motion along the first eigenmode in the inactive EGFR, HER2 and HER4 systems is dominated by A-loop movement, with smaller fluctuations in the other catalytic sub-domains, whereas the active ErbB systems exhibit a uniform level of motion across the sub-domains, with lower-amplitude fluctuations. Despite the crystallization of the HER3 kinase in an inactive-like conformation, the PCA pattern in HER3 appears to diverge from that of the other inactive ErbB kinases and instead resembles that of the active ErbB kinases, in terms of its concerted and low-amplitude sub-domain fluctuations. The normalized PCA variance-covariance matrices for vector displacements of atoms (Fig. S6, ES†) further emphasize and quantify the coupling among the catalytic sub-domains in the HER3 system, for example, between the C-loop (residues 814–820 in HER3) and A-loop/310 helix (residues 828–840). We reason that the interactions among the A-, C-, and N-loops and the αC helix in the active ErbB systems (i.e., active EGFR, HER2 and HER4, and weakly-active HER3) are crucial for alignment of the key sub-domains for catalysis. Consistent with this view, our PCA demonstrates that at the atomic level, the sub-domain motions of the HER3 system deviate from those of an inactive ErbB kinase.
Fig. 5.

Motion along the first principal component of the MD trajectory is illustrated for HER3 and compared to the active and inactive conformations of EGFR, HER2 and HER4. The structures are color-coded according to the RMSD, where red regions indicate large-amplitude fluctuations and blue regions indicate small-amplitude fluctuations. Despite the crystallization of the HER3 kinase in an inactive-like conformation, the HER3 PCA pattern resembles that of the fully-active ErbB kinases (EGFR, HER2, HER4), in terms of the concerted and low-amplitude fluctuations of its catalytic sub-domains (A-loop, N-loop, C-loop, αC helix).
Hydrogen bonding analysis indicates that the molecular mechanism of catalysis in HER3 is distinct from that operating in its fully-active ErbB family members
To identify specific interactions that could be contributing to the distinct pattern of global motion in the HER3 kinase in the inactive-like conformation, individual salt bridges and hydrogen bonds were tabulated for the HER3 system through a hydrogen-bonding analysis of the 10 ns MD trajectory (Table 1) and compared to the bonds present in the other ErbB systems.25, 47 The major difference that we observed between the inactive and active ErbB systems is a significantly greater number of bonds that couple the catalytic sub-domains of the kinases in the active systems compared to the inactive systems. Table 1 highlights several of these bonds (EGFR numbering will be used here): E734–K851 is a key salt bridge which couples the A-loop and αC helix and is conserved across the active conformations of EGFR, HER2 and HER4, and the L834–R812 and K836–V810 bonds bridge the A-loop and C-loop to maintain the A-loop in its extended, active conformation. We hypothesize that the tight coupling of the sub-domains in the active ErbB systems may help to correctly position the catalytic residues during assembly of the active site for phosphoryl transfer.47
Table 1.
Hydrogen bonding analysis of the HER3 MD trajectory and comparison to the MD trajectories for the active and inactive conformations of EGFR, HER2 and HER4. The bonds are organized by sub-domain, and bonds that are conserved in EGFR, HER2, and HER4 but not in HER3 are highlighted in bold. HER3 lacks many of the conserved bonds present in the active EGFR, HER2 and HER4 systems
| EGFR active | HER2 active | HER4 active | EGFR inactive | HER2 inactive | HER4 inactive | HER3 inactive |
|---|---|---|---|---|---|---|
| αC-helix A-loop bonds | ||||||
| — | — | — | — | — | E739,R841 | — |
| E734,K851 | E766,K883 | E739,K856 | — | — | — | — |
| D737,K836 | D769,R868 | — | — | — | D742,R841 | — |
| E738,F832 | — | E743,F837 | — | — | – – | — |
| — | — | — | E738,K836 | — | E743,R841 | — |
| αC-helix C-loop bonds | ||||||
| — | — | — | — | — | E743,R817 | — |
| αC-helix bonds | ||||||
| — | A763,S760 | — | — | — | — | — |
| — | E766,R756 | — | — | — | — | — |
| E738,K721 | E770,K753 | E743,K726 | — | — | — | — |
| — | — | — | M742,L753 | M774,L785 | M747,L758 | — |
| A743,L679 | — | A748,Q684 | — | — | — | — |
| — | — | — | — | — | A748,R757 | — |
| C-loop C-loop bonds | ||||||
| — | H843,D845 | — | — | — | — | H813,N815 |
| — | — | — | R812,D813 | R844,D845 | — | — |
| D813,R817 | D845,R849 | D818,R822 | — | — | — | — |
| D813,N818 | — | — | — | — | — | N815,N820 |
| A815,N818 | A847,N850 | A820,N823 | A815,N818 | A847,N850 | — | A817,N820 |
| — | A848,V851 | — | — | — | — | — |
| A-loop C-loop bonds | ||||||
| — | — | — | — | G865,V842 | — | — |
| — | — | — | — | — | G838,R817 | — |
| L834,R812 | L866,R844 | L839,R817 | — | — | — | — |
| — | — | — | L834,D813 | — | — | — |
| K836,V810 | R868,V842 | R841,V815 | — | — | — | — |
| — | — | — | — | — | — | D838,R814 |
| E848,R812 | — | — | — | — | — | — |
| — | — | — | K851,R812 | — | — | — |
| A-loop bonds | ||||||
| — | — | D836,K726 | — | D863,K753 | D836,K726 | D833,K723 |
| — | — | D836,T835 | — | — | — | — |
| L838,R808 | L870,R840 | L843,R813 | — | — | — | — |
| — | D871,R840 | — | — | — | — | — |
| A840,G672 | — | — | — | — | — | — |
| — | — | — | — | D873,R897 | — | — |
| — | — | — | — | — | — | D844,K853 |
| — | — | K848,T873 | — | — | — | — |
| K843,D932 | — | K848,D937 | — | — | — | — |
| — | E876,R898 | — | — | — | — | — |
| — | — | E849,K871 | — | — | — | — |
| Y845,Y867 | — | Y850,F872 | — | — | — | — |
| — | — | — | H846,R865 | — | — | — |
| — | D880,R897 | D853,R870 | E848,R865 | D880,R897 | D853,R870 | — |
By contrast, the bonding pattern in HER3 is distinct from the active and inactive states of its ErbB family members in its scarcity of hydrogen bonds (Table 1). HER3 lacks many of the bonds present in the other ErbB kinases due to substitutions in its amino acid sequence: E738 (EGFR numbering), which coordinates the α and β phosphates of ATP by forming a salt bridge with K721 in the αC helix, is mutated to a His in HER3. In addition, E734, which couples the A-loop and αC helix by bonding to K851, is an Ala in HER3. The few bonds that are present in HER3 help to maintain its distinctive active site: the D838–R814 bond, which bridges the 310 helix and the C-loop in HER3, does not appear in the other ErbB kinases. HER3's unique hydrogen bonding network (or lack there of) suggests that the molecular mechanism of catalysis in HER3 is distinct from that operating in its fully-active ErbB family members (EGFR, HER2, HER4).
Hydrophobic analysis of the ErbB kinases reveals that HER3 critically depends upon a coordinated set of hydrophobic interactions for its weak yet robust activity
In the active conformation, EGFR, HER2 and HER4 rely on an extensive network of hydrophilic interactions to maintain their active sites in a catalytically competent state, whereas the inactive conformations exhibit characteristic hydrophobic interactions, a feature that helps to differentiate the inactive and active states. In ErbB-mediated signaling, the introduction of the ErbB dimer interface alters the hydrophobicity of the region and, in conjunction with allosteric effects, perturbs the conformational sampling space of the protein to induce a shift toward the active conformation.36,41,48
To quantify these hydrophobic interactions, we computed the solvent accessible surface area (SASA) and water density fluctuations (see Methods) for the HER3 MD trajectory and compared the results to the EGFR, HER2 and HER4 trajectories previously simulated by us.48–50 In particular, we focused on several highly conserved hydrophobic regions which are considered to be important for defining the catalytic state of the ErbB kinases:51,52 the catalytic spine (C-spine), regulatory spine (R-spine), hydrophobic core, and β3-αC loop. Fig. 6 displays the correlation between the mean SASA and the normalized water density fluctuations for each hydrophobic region in the inactive and active conformations of each ErbB kinase. The SASA analysis is a reliable measure of hydrophobicity for smooth hydrophobic interfaces but does not always correlate perfectly with free energies of solvation of hydrophobic groups near irregular hydrophobic surfaces, which are often found in proteins. The normalized water density fluctuation calculation (see Methods), which quantifies the hydrophobicity of heterogeneous surfaces, provides an alternative to the SASA analysis and proposes that increased normalized water density fluctuations signify a more hydrophobic region, where a normalized value of 1 indicates a neutral surface.53,54 Thus the correlation between the SASA and water density fluctuations produces additional insights into region hydrophobicity that are not revealed by either analysis independently. Specifically, we have designated four ‘quadrants’ in each correlation subplot (Fig. 6): quadrant II represents a hydrophilically favorable region, quadrant IV defines a hydrophobically favorable region, and quadrant I, which is characterized by high SASA (more hydrophilic) and large water density fluctuations, represents a fragile or perturbation-sensitive region. The quadrants facilitate the identification of key patterns that may emerge from a comparison of the hydrophobic interactions in the ErbB systems.
Fig. 6.

Correlation between the solvent accessible surface area (SASA) and water density fluctuations in the key hydrophobic regions of the ErbB kinases: (A) hydrophobic core, (B) β3-αC loop, (C) C-spine and (D) R-spine. Dark and light markers represent the active and inactive ErbB systems, respectively. The ErbB kinase systems are represented as follows: EGFR (square), HER2 (circle), HER3 (diamond), and HER4 (triangle). Quadrant I represents a perturbation-sensitive region, quadrant II defines a hydrophilically favorable region, and quadrant IV represents a hydrophobically favorable region.
The HER2 system, in general, lies within the hydrophobically favorable region (quadrant IV), which may be rationalized in terms of HER2's unique ability to bind the molecular chaperone Hsp90 through a hydrophobic interface, a point that is elaborated in our previous studies.47,48 In the hydrophobic core, which includes segments of the αC helix and the A-loop and helps to maintain the ErbB kinases in the inactive conformation,51,52 HER3 demonstrates characteristic hydrophobic interactions that are similar to the inactive EGFR and HER4 systems. Fig. 6A illustrates that HER3, as well as the inactive EGFR and HER4 systems, lies within the ‘perturbation-sensitive’ quadrant, indicating that the hydrophobic core is a potential fragile point of the protein, in which single point mutants would be expected to disrupt the local interactions. Indeed, it has been reported that mutations in the hydrophobic core of EGFR and HER4 result in activation of the kinase, due to destabilization of the inactive state.36,41,55 By contrast, an analogous mutation in HER3 abolishes ATP-binding and phosphorylation activity,12 indicating that hydrophobic interactions in the core promote HER3 activity, rather than maintaining an autoinhibited state as they do in EGFR and HER4. Furthermore, the β3-αC loop, which is uniquely extended in HER3 (see Section 2.2) and lies proximal to the hydrophobic core, represents a perturbation-sensitive node in HER3 (Fig. 6B). Thus mutations in this region would also be expected to inactivate the HER3 kinase. Our results support the conclusion that HER3 critically depends upon a coordinated set of hydrophobic interactions for its weak yet robust activity from the inactive-like conformation, whereas EGFR and HER4 employ similar interactions to maintain their autoinhibited status from the inactive-like conformation. We propose that these hydrophobic contacts, including the interactions in the β3-αC loop, account for the tightly coordinated sub-domain motions observed in our PCA analysis of the HER3 system, in contrast to the hydrogen bond-mediated mechanism underlying the coordinated sub-domain motion in the active ErbB systems.
The hydrophobicity of the C-spine and R-spine, whose function is to coordinate the motions of the N- and C-lobes of the EGFR and HER4 kinases in the active conformation,51,52 was also quantified (Fig. 6C and D). In the C-spine and R-spine hydrophobicity plots, the inactive and active conformations of EGFR and HER4 are clearly delineated with respect to the SASA, with the active systems exhibiting a preferential hydrophobic stabilization (low SASA). The SASA of the HER3 C-spine falls within range of the inactive EGFR and HER4 systems, reflecting that, despite its weak activity, there is no corresponding ‘fully-active’ state for HER3 as for the other ErbB kinases. This inability to ‘fully’ activate can be attributed to the lack of the crucial hydrogen bonding network identified earlier, which is required to stabilize the active-like kinase conformation. The SASA of the HER3 R-spine deviates from the values for the inactive EGFR and HER4 systems, and instead demonstrates low SASA (high hydrophobicity). This result can be rationalized by the increased hydrophobicity of the R-spine, which includes segments of the truncated αC helix in HER3, hence positioning the HER3 system in the hydrophobically-favorable quadrant of the R-spine hydrophobicity plot (Fig. 6D).
The results of our molecular-scale simulations support the characterization of HER3 as a weakly active kinase that, in contrast to its fully-active ErbB family members, depends upon a unique hydrophobic interface to coordinate the alignment of specific catalytic residues required for its activity. Thus the MD simulations substantiate, at a molecular level of resolution, the inclusion of the weakly-active HER3 node in our ErbB pathway model (Fig. 1A). Moreover, our results highlight the most significant molecular interactions that contribute to potential mechanisms of HER3 activity, which will be clinically relevant in terms of informing the design of small-molecule inhibitors targeted to the HER3 kinase. Now that we have provided support for the topology of our ErbB pathway model (Fig. 1A), it is necessary to quantitatively evaluate the model by incorporating appropriate kinetic parameters (Fig. 1C). This is an important step in our multiscale modeling scheme, as the ErbB signaling model represents the translation of our observations of the robust activity of the HER3 kinase into a physiologically relevant context, with the aim of rationalizing the clinical implications of HER3 catalytic activity for elucidating mechanisms of drug resistance in ErbB-driven tumor cells.
2.4 Systems model of ErbB signaling defines a mechanism for HER3-mediated TKI resistance
To investigate the implications of HER3 activation for ErbB signaling dynamics in a cellular context, we constructed a systems-level model (Fig. 1C) derived from that of Schoeberl et al.,56 and informed our model with the HER3 phosphorylation rate constants calculated from the experiments reported by Shi et al.12 (see Table S1 for a list of model parameters and ESI† for the SBML version of the model). EGFR, HER2 and HER3 species were included in the model (HER4 was omitted as in the model by Schoeberl et al., to reflect its undetectable levels in most cancer cell lines) and allowed to form EGFR–HER3, HER2–HER3, and HER3–HER3 dimers upon binding to the ligand NRG-1β (as NRG-1β is a HER3-specific ligand, it is not able to induce EGFR or HER2 homodimers).32 To represent HER3 catalytic activity, we implemented HER3 homodimerization and trans-autophosphorylation in our model, resulting in induction of PI3K–AKT signaling (Fig. 1C). Based on the previous experimental results indicating a 1000-fold weaker phosphoryl transfer mechanism operating in HER3,12 we assumed that the rate of HER3 phosphorylation is 1000-fold slower than that of EGFR. The addition of the HER3 homodimer species does not significantly alter the signaling dynamics of the model; levels of phosphorylated HER3 (pHER3), pHER2 and pAKT peak within minutes of NRG-1β stimulation (Fig. S7, ESI†), whereas pEGFR exhibits a weak signal due to poor induction of EGFR dimers by NRG-1β. Thus the phosphorylated HER2/3 hetero-dimer remains a predominant species in the model, although levels of pHER3 are slightly higher due to activation and trans-autophosphorylation of HER3 homodimers.
To identify the key proteins that direct signaling in our model of the ErbB network, which includes HER3 catalytic activity, parameter sensitivity analysis was performed with respect to pAKT. Fig. 7A displays the normalized sensitivity of pAKT to various species in the model: it is clear that HER3 and NRG-1β represent the most sensitive species in the signaling network, followed by HER2 concentration. EGFR is not a strong determinant of the extent of AKT phosphorylation, as expected from the weak ability of NRG-1β to elicit EGFR dimers. EGFR displayed a negative sensitivity because an increase in EGFR–HER3 dimerization results in fewer HER2–HER3 dimers, which produce the most pAKT. PTEN (the PIP3 phosphatase) and the ErbB phosphatase (labeled as PTP in Fig. 1C) also exhibited a negative sensitivity in the analysis, as these phosphatases negatively regulate the signaling network through dephosphorylation of key molecular species.
Fig. 7.

Parameter sensitivity analysis of the HER3 signaling model. The normalized, time-integrated sensitivity of pAKT to key molecular species was computed in response to NRG-1β = 25 nM by making a 0.1% change in each species concentration for (A) the model representing weak HER3 activity, and (B) the model representing weak HER3 activity in the presence of the EGFR/HER2 inhibitor lapatinib. Sensitivity to certain species, including HER3, HER2 and the ErbB phosphatase, changed upon addition of lapatinib.
As previous experimental studies have demonstrated that HER3 is a key mediator of resistance to various tyrosine kinase inhibitors (TKIs) currently in use,20,21,37–39 we next tested whether weak HER3 catalytic activity could explain potential resistance mechanisms. Previously postulated mechanisms include leaky HER2-catalyzed phosphorylation of HER3 (i.e., incomplete inhibition of HER2 catalytic activity by the TKI),20,38,57 which remains a plausible hypothesis. However, these models of resistance do not consider the potential for HER3 catalytic activity, due to HER3's formerly assumed inactive pseudokinase status. Thus we incorporated the TKI lapatinib, which inhibits EGFR and HER2 catalytic activity, into our model of HER3 signaling using rate constants obtained from Schoeberl and colleagues,56 and simulated the effects of the TKI on pAKT induction upon NRG-1β stimulation. Fig. S8 (ESI†), which displays normalized levels of pEGFR, pHER2 and pHER3 for increasing concentrations of lapatinib, illustrates that phosphorylated EGFR and HER2 are effectively inhibited at sufficiently high TKI concentrations, as expected. The pHER3 and pAKT signals are slightly more persistent; at the maximum simulated lapatinib concentration (2 μM) and 25 nM NRG-1β, pHER3 and pAKT levels persist at 3–4% of their respective no-inhibitor control levels (Fig. S8C-D, ESI†). Although Fig. S8 (ESI†) demonstrates that the implementation of HER3 catalytic activity allows HER3 to escape TKI inhibition and sustain a weak level of AKT signaling, this weak activity is not expected to be phenotypically observable. Indeed, we computed the IC50 for lapatinib/pHER3 to be 94 nM (for 25 nM NRG-1β), which agrees with published in vitro and simulated values ranging from 100–152 nM.56
Fig. 7B compares the results of pAKT sensitivity analysis of the lapatinib-treated model to those of the inhibitor-free model in Fig. 7A. It is apparent that sensitivity to HER3 and NRG-1β increases, whereas sensitivity to EGFR and HER2 decreases, as lapatinib sequesters EGFR and HER2 molecules. The negative normalized sensitivity to the ErbB phosphatase also increases (Fig. 7B), as the pool of ErbB dimers has diminished due to sequestration of EGFR and HER2 by lapatinib. Thus a single alteration to the signaling model (in this case, addition of lapatinib) significantly redefines the most perturbation-sensitive nodes in the network.
Although the pAKT signal induced by HER3 phosphorylation in our in silico lapatinib-treated cell is relatively weak, in an actual physiological context, a tumor cell may employ several resistance mechanisms at once.20,38,58,59 Indeed, previous experimental studies have demonstrated that leaky HER2 phosphorylation of HER3 in TKI-bound HER2/3 heterodimers is amplified by additional resistance mechanisms, such as inhibition of cellular phosphatases by TKI-mediated production of reactive oxygen species (ROS), and increased expression of HER3 at the plasma membrane.20,22,60 To test whether weak HER3 activity during lapatinib treatment could be augmented by other processes, we simulated the lapatinib-treated model for decreased initial concentrations of the ErbB phosphatase, which represents a sensitive node in our pAKT sensitivity analysis (Fig. 7B). The pAKT signal was recorded in response to 2 μM lapatinib, as this concentration lies within the range of TKI concentrations shown to induce drug resistance in various tumor cell lines.20,38,58 At the lowest concentration of phosphatase tested (1% of its nominal value represents a limiting phosphatase concentration with respect to HER3), even low levels of pAKT induced by HER3 signaling were amplified for varying concentrations of NRG-1β (Fig. 8A). As an alternative resistance mechanism, we simulated the lapatinib-treated model for augmented levels of plasma membrane-bound HER3, which represents another highly sensitive node in our sensitivity analysis of the lapatinib-treated model (Fig. 7B). It has been demonstrated that in certain cases of TKI resistance, the tumor cell responds to the reduction in pAKT levels by upregulating vesicular transport of HER3 from the cytoplasm to the plasma membrane.20,60 Fig. 8B illustrates that for a 2-fold increase in surface HER3 levels, the pAKT signal is amplified for varying concentrations of NRG-1β, in similarity to our results for decreased phosphatase concentration. The extent of amplification is not as pronounced for 5 nM NRG-1β as for 25–100 nM NRG-1β, as the Kd for HER3/NRG binding is 10 nM.
Fig. 8.

Levels of pAKT expressed following a 30 minute pre-incubation with 2 μM lapatinib and 10 min stimulation with increasing concentrations of NRG-1β for (A) decreased expression of the ErbB phosphatase (1% of nominal value), (B) increased expression (2-fold) of HER3 at the cell surface, and (C) combination of decreased ErbB phosphatase and increased surface HER3. The control represents the pAKT signal in the presence of inhibitor only (no amplification mechanism). pAKT is normalized to the signal produced in the absence of inhibitor.
Fig. 8C displays the results of decreased phosphatase levels combined with increased HER3 concentration, a phenomenon that, in effect, shifts the HER3 phosphorylation/dephosphoryl-ation equilibrium and has been observed in various tumor cell lines.20 For 25 nM NRG-1β, the pAKT signal is restored to nearly 60% of its no-inhibitor control level, and pAKT levels are nearly 100% regained for 100 nM NRG-1β, effectively recreating drug resistance in silico. Our data parallel the experimental studies performed by Sergina and colleagues,20 which describe HER3-mediated resistance and pAKT signaling in various TKI-treated tumor cell lines as well as in vivo. Thus our model demonstrates that even a weak level of HER3 signaling may be physiologically relevant in the context of an ErbB-driven tumor cell, and illustrates several routes through which HER3 signaling may be compounded by other previously postulated resistance mechanisms to generate TKI resistance.
Based on our model results, we propose two potential therapeutic strategies for overcoming TKI resistance in certain tumor cell lines: (a) treatment with an anti-HER3 monoclonal antibody (mAb) to prevent HER3 dimerization, or (b) treatment with a TKI specific for HER3 in addition to dampening the amplifying mechanisms using inhibitors of vesicular trafficking (for blocking upregulation of surface HER3) or antioxidants (for inhibition of TKI-produced ROS), which have been shown to overcome TKI resistance in vitro.20 Our data suggest that application of a TKI targeting HER3 would be ineffective as a standalone strategy and would require supplementation with an additional therapy, as even a weak level of HER3 activity resulting from incomplete TKI inhibition is sufficient to induce drug resistance.
3. Conclusions
In this work we applied a multiscale modeling approach to investigate the non-canonical catalytic mechanism employed by the ErbB kinase HER3, a RTK formerly categorized as an inactive pseudokinase, and the physiological relevance of this activity to mechanisms of drug resistance in an ErbB-driven tumor cell in silico. The results of our molecular-scale simulations support the characterization of HER3 as a weakly active kinase that, in contrast to its fully-active ErbB family members, depends upon a unique hydrophobic interface to coordinate the alignment of specific catalytic residues required for its activity. Translating our molecular simulation results of the uniquely active behavior of the HER3 kinase into a physiologically relevant environment, our HER3 signaling model demonstrated that even a weak level of HER3 activity may be sufficient to induce AKT signaling and TKI resistance in the context of an ErbB signaling-dependent tumor cell, and therefore therapeutic targeting of HER3 may represent a superior treatment strategy for specific ErbB-driven cancers.
Our homology modeling analysis of the HER3 kinase, using the EGFR and HER4 structures as templates, provided a framework for highlighting the key structural differences between the catalytic site of HER3 and the other ErbB kinases, and for identifying the molecular features that distinguish HER3 from the other nodes (EGFR and HER2) in our multiscale model of HER3 activity. The homology modeling results reflected close evolutionary ties between HER3 and HER4, suggesting that despite employing different catalytic mechanisms, these two kinases may share other molecular regulatory mechanisms, such as autoinhibition through N-lobe dimer formation.11 We also determined that the application of multiple templates in the initial sequence alignment improved the stereochemical quality of our HER3 homology model. This methodological result is relevant as our homology modeling platform may be extended to other pseudokinases that have not yet been crystallized. Indeed, several putative pseudokinases share structural features with HER3, among them JAK2, TYK2, guanylate cyclase D (CYGF) and protein serine kinase H (PSKH2), all of which lack the catalytic aspartate in the HRD motif.2 Application of our modeling and analysis procedure to these other kinases will facilitate identification of residues that may compensate for the lack of key catalytic motifs in the pseudokinase domains and provide insight into how unusual modes of phosphoryl transfer may have evolved in eukaryotic pseudokinases.
At the atomic level, our molecular dynamics simulations and PCA analysis of the HER3 kinase crystal structure revealed that the HER3 system exhibits tightly coordinated fluctuations of its catalytic sub-domains, which may facilitate the alignment of key catalytic residues involved in phosphoryl transfer. Despite sharing a pattern of concerted sub-domain motion with its fully-active ErbB family members, the HER3 system appeared to achieve this state through a unique mechanism, namely, a tightly coordinated set of hydrophobic contacts. By contrast, an extensive network of hydrophilic interactions is employed by EGFR, HER2 and HER4. The hydrogen bonding analysis and hydrophobicity calculations demonstrated that the conserved hydrophilic contacts present in the active sites of EGFR, HER2 and HER4 are replaced in HER3 by a unique hydrophobic interface formed by the extended β3-αC loop, the molten αC helix and the 310 helix in the A-loop.45 Thus our atomic-level simulations suggest that the ErbB kinases may have evolved two different modes of achieving the shared goal of prearranging the catalytic machinery for phosphoryl transfer. Moreover, the MD results highlight the most significant molecular interactions that contribute to potential mechanisms of HER3 activity, which will be clinically relevant in terms of informing the design of small-molecule inhibitors targeted to the HER3 kinase.
Employing a systems model, we extended our results to the cellular level to rationalize the clinical implications of HER3 catalytic activity for elucidating mechanisms of resistance to TKIs in ErbB-driven tumor cells. To this end we implemented weak HER3 catalytic activity in a signaling model of the ErbB kinase network and tested the effects of the TKI lapatinib on phosphorylation of AKT in our in silico system. The simulation results revealed that, through dimerization and trans-autophosphorylation, HER3 is able to escape TKI inhibition and sustain a weak level of AKT signaling, which may be amplified by additional resistance mechanisms, as we illustrated for decreased expression of the ErbB phosphatase and increased expression of HER3 at the plasma membrane, to recreate drug resistance in silico. Our results parallel the experimental studies performed by Sergina et al.,20 which demonstrate HER3-mediated resistance and pAKT signaling in various TKI-treated tumor cell lines as well as in vivo. Furthermore, our model is sufficiently versatile to rationalize additional experimental results obtained by Sergina and colleagues: in their study it was observed that siRNA-induced knockdown of HER2 abrogates drug resistance, which suggests that HER2 is critically involved in the resistance mechanism, for example, by providing an activation stimulus for HER3 in the context of a HER2/3 dimer. Our model could be altered to reflect this result by implementing HER3 phosphorylation in the context of a HER2/3 heterodimer, rather than a HER3 homodimer. In fact, HER3 catalytic activity may be explicitly represented by several different model topologies, but the implication for the cell phenotype is the same: namely, that a weak level of HER3 activity may induce drug resistance through amplification by additional resistance mechanisms, and therefore HER3, rather than the routinely-targeted EGFR and HER2 kinases, may represent a more viable candidate for inhibition in the context of an ErbB signaling-dependent tumor.
Indeed, TKI therapy will remain limited in its efficacy until drugs that target the HER3 kinase become routinely available. Recently, Schoeberl and colleagues evaluated the in vitro and in vivo efficacy of a novel therapeutic anti-HER3 antibody, MM-121, and reported that MM-121 reduced ligand-dependent phosphorylation of HER3 and abrogated resistance to the TKI gefitinib by preventing reactivation of HER3.61 Although HER3 activity is weak compared with that of other RTKs, HER3 may remain catalytically active in situations where the activities of its ErbB family members have been attenuated by kinase inhibitors, such as lapatinib or gefitinib, which do not target HER3. Since the catalytic site of HER3 differs structurally from the other ErbB kinases, it may be possible to design TK inhibitors that demonstrate improved selectivity for HER3 as the target kinase. A clinically valuable feature of our multiscale modeling approach is that the flow of information between models occurs in a bidirectional manner, so that it is possible to apply the results of our ErbB signaling model, which indicate that targeting of HER3 may be a superior therapeutic strategy for certain ErbB-driven cancers, to the design of molecular inhibitors of HER3 activity at the atomic scale. In this way, our atomic and subatomic simulations of HER3 activity inform our systems model, and the systems model, in turn, informs the atomic/subatomic-level simulations (i.e., design of molecular inhibitors or mAbs against HER3). Thus multiscale modeling provides a powerful and quantitative platform for investigating the complexity inherent in intracellular signaling pathways and rationalizing the effects of molecular perturbations on downstream signaling events and ultimately, on the cell phenotype.
4. Methods
4.1 Homology modeling of the HER3 kinase domain
Several crystal structures of the ErbB kinases in the inactive conformation were selected as templates for modeling of the HER3 kinase domain. The templates included the crystal structures of EGFR (PDB code 2GS7),36 HER4 (PDB code 3BBT),41 as well as a combination of the EGFR and HER4 structures. The coordinates of the inactive conformations of the kinases were downloaded from the Protein Data Bank and a sequence alignment between HER3 and each template was performed in MODELLER.42,43 Missing residues were built using the loop modeling algorithm in MODELLER and the structures were further refined by performing additional energy minimization steps. The hydrogen atoms were added by employing the hbuild routine in CHARMM27.62 The final models for the inactive HER3 kinase domain were assessed for stereochemical quality using PROCHECK.63 The program VMD was used to display and animate all structural models.64
4.2 Molecular dynamics (MD) simulations
The HER3 kinase crystal structure (PDB code 3LMG) solved by Shi et al.12 was prepared for molecular dynamics simulation according to the procedure outlined in our previous studies.25,47 Briefly, the structure was explicitly solvated using the TIP3P model for water65 and with the buffering distance set to 15 Å. Sodium (Na+) and chloride (Cl−) ions were added to achieve net electroneutrality of the system and an ionic strength of 75 mM. The ions were positioned at points of electrostatic extrema using a Debye–Huckel potential calculated within the program Solvate 1.0.66 All simulations were performed with NAMD67 using CHARMM27 force-field parameters. To prepare the system for MD simulation, the solvated structure was energy-minimized using a conjugate gradient algorithm to remove unfavorable contacts. The system was then heated to 300 K using the temperature reassignment method in NAMD. Constant pressure and temperature (NPT) simulations were performed at 300 K and 1 atm to equilibrate the volume of the solvation box. Temperature and pressure were maintained using a Langevin piston coupling algorithm.68 Following the NPT simulations, constant volume and temperature (NVT) simulations were performed in NAMD. Finally, a 10 ns production run was completed using the same parameters as in the NVT simulations.
4.3 Hydrogen bonding analysis
CHARMM was used to analyze the hydrogen bonds present in the 10 ns trajectory for each system according to the procedure outlined in our previous studies.25,47 Hydrogen bonds were defined by a bond length cutoff of 3.4 Å and an angle cutoff of 150°. Bonds that fulfilled these criteria and were present in at least 60% of the trajectory were tabulated in CHARMM. Salt bridges were defined as hydrogen bonds occurring between an acidic and a basic residue and satisfying a bond length cutoff of 1.6 Å. All hydrogen bonds and salt bridges were also visualized in VMD64 for the duration of the 10 ns simulation.
4.4 Principal component analysis
A principal component analysis (PCA) was applied to the 10 ns trajectory to identify the main eigenvectors (3N directions) along which the majority of the complex motion is defined. The calculation is based on the diagonalization of the variance-covariance matrix of the atomic fluctuations along each MD trajectory to yield the set of eigenvectors (PCs) and associated eigenvalues. The eigenvectors represent the independent modes of atomic motion, and the eigenvalues reflect the contribution of the corresponding eigenvectors to the global fluctuation of the protein. PCA computes the covariance matrix as:
where (i,j = 1,…,3N), and N is the total number of atoms with positions given by Cartesian coordinates x. The resulting matrix is diagonalized to compute the 3N independent (uncorrelated) eigenvectors, {ξi}, and the eigenvalues, {λi}, sorted in descending order. The angle brackets denote the time average over the entire trajectory. PCA was performed on the entire protein backbone (i.e. all Cα atoms), and also an active site region that comprises all catalytic sub-domains, including the A-, C-, and N-loops and the αC helix. The program CARMA69 was used to project the atomic fluctuations along the MD trajectory.
4.5 Solvent accessible surface area (SASA) and water density fluctuation analysis
SASA values were calculated in VMD64 using the measure SASA module with a probe radius 1.4 Å larger than the van der Waals radius. The SASA was calculated for each step in the trajectory, from which the mean and standard deviation were computed. As an alternative measure of hydrophobicity in heterogeneous environments, following the procedure established in ref. 53 and 54, normalized water density fluctuations were computed by recording the ratio of , where volN, σN and 〈N〉 are the control volume of interest, standard deviation and mean associated with the number of water molecules within 5 Å of a specified hydrophobic sub-region in the HER3 kinase. Although results are presented for a cutoff of 5 Å, other cutoffs ranging from 3–15 Å were investigated and similar trends in were recorded.
4.6 Systems model of ErbB signaling
The computational systems model was derived from that of Schoeberl et al.56 Mass-action reactions describing ligand-induced ErbB receptor homo- and heterodimerization, receptor internalization and degradation, constitutive dimerization, and activation of the PI3K–AKT signaling pathway were included. The HER3-specific ligand neuregulin-1β (NRG-1β) was assumed to induce EGFR–HER3, HER2–HER3 and HER3–HER3 dimers. To represent HER3 catalytic activity, we implemented HER3 homodimerization and trans-autophosphorylation, resulting in induction of PI3K–AKT signaling. HER3-mediated kinase phosphorylation was assumed to be 1000-fold slower than that of EGFR, based on previous experiments and QM/MM simulations.12 The ErbB kinase inhibitor lapatinib was implemented in the model according to Schoeberl et al.;56 lapatinib was assumed to inhibit activation but not dimerization or ligand binding of the EGFR and HER2 kinases. All simulations were performed in MATLAB 7.10 (MathWorks, Natick, MA) and sensitivity analysis was conducted using SBToolbox 2.170 and SBML-SAT.71 Normalized, time-integrated sensitivities of each nonzero species with respect to pAKT were calculated by varying each species and simulating the perturbed model response. The sensitivity analysis was performed according to the procedure implemented in SBML-SAT.71 Briefly, the normalized sensitivity, Sij, was computed as:
where Oi is the time-integrated response of the ith model output (such as pAKT level) and pj is the jth parameter (rate constant or initial condition). The SBML version of the model is available in the ESI†, and we have also submitted it to the BioModels Database.72,73 The signaling process diagram (Fig. 1C) was constructed using the Systems Biology Graphical Notation (SBGN).74
Supplementary Material
Acknowledgments
We thank Mark A. Lemmon and Fumin Shi for providing the HER3 crystal structure and for many insightful discussions. We acknowledge financial support from NSF grants CBET-0853389 and CBET-0853539. Computational resources were provided in part by the National Partnership for Advanced Computational Infrastructure (NPACI) under the allocation grant MRAC MCB060006. S.E.T. was supported by the National Institutes of Health under Ruth L. Kirschstein National Research Service Award 2T32HL007954 from the NIH-NHLBI, a National Science Foundation Graduate Research Fellowship, and a Graduate Assistantship in Areas of National Need (GAANN) from the Department of Education.
Footnotes
Electronic supplementary information (ESI) available. See DOI: 10.1039/c0mb00345j
References
- 1.Manning G, Whyte DB, Martinez R, Hunter T, Sudarsanam S. The protein kinase complement of the human genome. Science. 2002;298:1912–1934. doi: 10.1126/science.1075762. [DOI] [PubMed] [Google Scholar]
- 2.Boudeau J, Miranda-Saavedra D, Barton GJ, Alessi DR. Emerging roles of pseudokinases. Trends Cell Biol. 2006;16:443–452. doi: 10.1016/j.tcb.2006.07.003. [DOI] [PubMed] [Google Scholar]
- 3.Min X, Lee BH, Cobb MH, Goldsmith EJ. Crystal structure of the kinase domain of WNK1, a kinase that causes a hereditary form of hypertension. Structure (London) 2004;12:1303–1311. doi: 10.1016/j.str.2004.04.014. [DOI] [PubMed] [Google Scholar]
- 4.Mukherjee K, Sharma M, Urlaub H, Bourenkov GP, Jahn R, Sudhof TC, Wahl MC. CASK Functions as a Mg2 +-independent neurexin kinase. Cell (Cambridge, Mass) 2008;133:328–339. doi: 10.1016/j.cell.2008.02.036. [DOI] [PMC free article] [PubMed] [Google Scholar]
- 5.Yarden Y, Sliwkowski MX. Untangling the ErbB signalling network. Nat Rev Mol Cell Biol. 2001;2:127–137. doi: 10.1038/35052073. [DOI] [PubMed] [Google Scholar]
- 6.Citri A, Yarden Y. EGF-ERBB signalling: towards the systems level. Nat Rev Mol Cell Biol. 2006;7:505–516. doi: 10.1038/nrm1962. [DOI] [PubMed] [Google Scholar]
- 7.Linggi B, Carpenter G. ErbB receptors: new insights on mechanisms and biology. Trends Cell Biol. 2006;16:649–656. doi: 10.1016/j.tcb.2006.10.008. [DOI] [PubMed] [Google Scholar]
- 8.Birtwistle MR, Hatakeyama M, Yumoto N, Ogunnaike BA, Hoek JB, Kholodenko BN. Ligand-dependent responses of the ErbB signaling network: experimental and modeling analyses. Mol Syst Biol. 2007;3:144. doi: 10.1038/msb4100188. [DOI] [PMC free article] [PubMed] [Google Scholar]
- 9.Joslin EJ, Opresko LK, Wells A, Wiley HS, Lauffenburger DA. EGF-receptor-mediated mammary epithelial cell migration is driven by sustained ERK signaling from autocrine stimulation. J Cell Sci. 2007;120:3688–3699. doi: 10.1242/jcs.010488. [DOI] [PubMed] [Google Scholar]
- 10.Plowman GD, Whitney GS, Neubauer MG, Green JM, McDonald VL, Todaro GJ, Shoyab M. Molecular cloning and expression of an additional epidermal growth factor receptor-related gene. Proc Natl Acad Sci U S A. 1990;87:4905–4909. doi: 10.1073/pnas.87.13.4905. [DOI] [PMC free article] [PubMed] [Google Scholar]
- 11.Jura N, Shan Y, Cao X, Shaw DE, Kuriyan J. Structural analysis of the catalytically inactive kinase domain of the human EGF receptor 3. Proc Natl Acad Sci U S A. 2009;106:21608–21613. doi: 10.1073/pnas.0912101106. [DOI] [PMC free article] [PubMed] [Google Scholar]
- 12.Shi F, Telesco SE, Liu Y, Radhakrishnan R, Lemmon MA. ErbB3/HER3 intracellular domain is competent to bind ATP and catalyze autophosphorylation. Proc Natl Acad Sci U S A. 2010;107:7692–7697. doi: 10.1073/pnas.1002753107. [DOI] [PMC free article] [PubMed] [Google Scholar]
- 13.Choi SH, Mendrola JM, Lemmon MA. EGF-independent activation of cell-surface EGF receptors harboring mutations found in gefitinib-sensitive lung cancer. Oncogene. 2007;26:1567–1576. doi: 10.1038/sj.onc.1209957. [DOI] [PubMed] [Google Scholar]
- 14.Ji H, Li D, Chen L, Shimamura T, Kobayashi S, McNamara K, Mahmood U, Mitchell A, Sun Y, Al-Hashem R, Chirieac LR, Padera R, Bronson RT, Kim W, Janne PA, Shapiro GI, Tenen D, Johnson BE, Weissleder R, Sharpless NE, Wong KK. The impact of human EGFR kinase domain mutations on lung tumorigenesis and in vivo sensitivity to EGFR-targeted therapies. Cancer Cell. 2006;9:485–495. doi: 10.1016/j.ccr.2006.04.022. [DOI] [PubMed] [Google Scholar]
- 15.Lee JW, Soung YH, Kim SY, Nam SW, Park WS, Wang YP, Jo KH, Moon SW, Song SY, Lee JY, Yoo NJ, Lee SH. ERBB2 kinase domain mutation in the lung squamous cell carcinoma. Cancer Lett (Shannon, Irel) 2006;237:89–94. doi: 10.1016/j.canlet.2005.05.026. [DOI] [PubMed] [Google Scholar]
- 16.Minami Y, Shimamura T, Shah K, LaFramboise T, Glatt KA, Liniker E, Borgman CL, Haringsma HJ, Feng W, Weir BA, Lowell AM, Lee JC, Wolf J, Shapiro GI, Wong KK, Meyerson M, Thomas RK. The major lung cancer-derived mutants of ERBB2 are oncogenic and are associated with sensitivity to the irreversible EGFR/ERBB2 inhibitor HKI-272. Oncogene. 2007;26:5023–5027. doi: 10.1038/sj.onc.1210292. [DOI] [PubMed] [Google Scholar]
- 17.Shigematsu H, Takahashi T, Nomura M, Majmudar K, Suzuki M, Lee H, Wistuba II, Fong KM, Toyooka S, Shimizu N, Fujisawa T, Minna JD, Gazdar AF. Somatic mutations of the HER2 kinase domain in lung adenocarcinomas. Cancer Res. 2005;65:1642–1646. doi: 10.1158/0008-5472.CAN-04-4235. [DOI] [PubMed] [Google Scholar]
- 18.Willmore-Payne C, Holden JA, Layfield LJ. Detection of EGFR- and HER2-activating mutations in squamous cell carcinoma involving the head and neck. Mod Pathol. 2006;19:634–640. doi: 10.1038/modpathol.3800552. [DOI] [PubMed] [Google Scholar]
- 19.Nagashima T, Ushikoshi-Nakayama R, Suenaga A, Ide K, Yumoto N, Naruo Y, Takahashi K, Saeki Y, Taiji M, Tanaka H, Tsai SF, Hatakeyama M. Mutation of epidermal growth factor receptor is associated with MIG6 expression. FEBS J. 2009;276:5239–5251. doi: 10.1111/j.1742-4658.2009.07220.x. [DOI] [PubMed] [Google Scholar]
- 20.Sergina NV, Rausch M, Wang D, Blair J, Hann B, Shokat KM, Moasser MM. Escape from HER-family tyrosine kinase inhibitor therapy by the kinase-inactive HER3. Nature. 2007;445:437–441. doi: 10.1038/nature05474. [DOI] [PMC free article] [PubMed] [Google Scholar]
- 21.Engelman JA, Zejnullahu K, Mitsudomi T, Song Y, Hyland C, Park JO, Lindeman N, Gale CM, Zhao X, Christensen J, Kosaka T, Holmes AJ, Rogers AM, Cappuzzo F, Mok T, Lee C, Johnson BE, Cantley LC, Janne PA. MET amplification leads to gefitinib resistance in lung cancer by activating ERBB3 signaling. Science. 2007;316:1039–1043. doi: 10.1126/science.1141478. [DOI] [PubMed] [Google Scholar]
- 22.Hamburger AW. The role of ErbB3 and its binding partners in breast cancer progression and resistance to hormone and tyrosine kinase directed therapies. Mammary Gland Biol Neoplasia. 2008;13:225–233. doi: 10.1007/s10911-008-9077-5. [DOI] [PMC free article] [PubMed] [Google Scholar]
- 23.Liu B, Ordonez-Ercan D, Fan Z, Edgerton SM, Yang X, Thor AD. Downregulation of erbB3 abrogates erbB2-mediated tamoxifen resistance in breast cancer cells. Int J Cancer. 2007;120:1874–1882. doi: 10.1002/ijc.22423. [DOI] [PubMed] [Google Scholar]
- 24.Liu Y, Purvis J, Shih A, Weinstein J, Agrawal N, Radhakrishnan R. A multiscale computational approach to dissect early events in the Erb family receptor mediated activation, differential signaling, and relevance to oncogenic transformations. Ann Biomed Eng. 2007;35:1012–1025. doi: 10.1007/s10439-006-9251-0. [DOI] [PMC free article] [PubMed] [Google Scholar]
- 25.Shih AJ, Purvis J, Radhakrishnan R. Molecular systems biology of ErbB1 signaling: bridging the gap through multiscale modeling and high-performance computing. Mol, BioSyst. 2008;4:1151–1159. doi: 10.1039/b803806f. [DOI] [PMC free article] [PubMed] [Google Scholar]
- 26.Rausenberger J, Hussong A, Kircher S, Kirchenbauer D, Timmer J, Nagy F, Schafer E, Fleck C. An integrative model for phytochrome B mediated photomorphogenesis: from protein dynamics to physiology. PLoS One. 2010;5:e10721. doi: 10.1371/journal.pone.0010721. [DOI] [PMC free article] [PubMed] [Google Scholar]
- 27.Fedosov DA, Caswell B, Karniadakis GE. A multiscale red blood cell model with accurate mechanics, rheology, and dynamics. Biophys J. 2010;98:2215–2225. doi: 10.1016/j.bpj.2010.02.002. [DOI] [PMC free article] [PubMed] [Google Scholar]
- 28.Vasalou C, Henson MA. A multiscale model to investigate circadian rhythmicity of pacemaker neurons in the suprachiasmatic nucleus. PLoS Comput Biol. 2010;6:e1000706. doi: 10.1371/journal.pcbi.1000706. [DOI] [PMC free article] [PubMed] [Google Scholar]
- 29.Carraway KL, 3rd, Soltoff SP, Diamonti AJ, Cantley LC. Heregulin stimulates mitogenesis and phosphatidylinositol 3-kinase in mouse fibroblasts transfected with erbB2/neu and erbB3. J Biol Chem. 1995;270:7111–7116. doi: 10.1074/jbc.270.13.7111. [DOI] [PubMed] [Google Scholar]
- 30.Carraway KL, 3rd, Sliwkowski MX, Akita R, Platko JV, Guy PM, Nuijens A, Diamonti AJ, Vandlen RL, Cantley LC, Cerione RA. The erbB3 gene product is a receptor for heregulin. J Biol Chem. 1994;269:14303–14306. [PubMed] [Google Scholar]
- 31.Sweeney C, Fambrough D, Huard C, Diamonti AJ, Lander ES, Cantley LC, Carraway KL., 3rd Growth factor-specific signaling pathway stimulation and gene expression mediated by ErbB receptors. J Biol Chem. 2001;276:22685–22698. doi: 10.1074/jbc.M100602200. [DOI] [PubMed] [Google Scholar]
- 32.Riese DJ, 2nd, van Raaij TM, Plowman GD, Andrews GC, Stern DF. The cellular response to neuregulins is governed by complex interactions of the erbB receptor family. Mol Cell Biol. 1995;15:5770–5776. doi: 10.1128/mcb.15.10.5770. [DOI] [PMC free article] [PubMed] [Google Scholar]
- 33.Stern DF. ERBB3/HER3 and ERBB2/HER2 duet in mammary development and breast cancer. J Mammary Gland Biol Neoplasia. 2008;13:215–223. doi: 10.1007/s10911-008-9083-7. [DOI] [PMC free article] [PubMed] [Google Scholar]
- 34.Chen WW, Schoeberl B, Jasper PJ, Niepel M, Nielsen UB, Lauffenburger DA, Sorger PK. Input-output behavior of ErbB signaling pathways as revealed by a mass action model trained against dynamic data. Mol Syst Biol. 2009;5:239. doi: 10.1038/msb.2008.74. [DOI] [PMC free article] [PubMed] [Google Scholar]
- 35.Jura N, Endres NF, Engel K, Deindl S, Das R, Lamers MH, Wemmer DE, Zhang X, Kuriyan J. Mechanism for activation of the EGF receptor catalytic domain by the juxtamembrane segment. Cell (Cambridge, Mass) 2009;137:1293–1307. doi: 10.1016/j.cell.2009.04.025. [DOI] [PMC free article] [PubMed] [Google Scholar]
- 36.Zhang X, Gureasko J, Shen K, Cole PA, Kuriyan J. An allosteric mechanism for activation of the kinase domain of epidermal growth factor receptor. Cell (Cambridge, Mass) 2006;125:1137–1149. doi: 10.1016/j.cell.2006.05.013. [DOI] [PubMed] [Google Scholar]
- 37.Baselga J, Swain SM. Novel anticancer targets: revisiting ERBB2 and discovering ERBB3. Nat Rev Cancer. 2009;9:463–475. doi: 10.1038/nrc2656. [DOI] [PubMed] [Google Scholar]
- 38.Hutcheson IR, Knowlden JM, Hiscox SE, Barrow D, Gee JM, Robertson JF, Ellis IO, Nicholson RI. Heregulin beta 1 drives gefitinib-resistant growth and invasion in tamoxifen-resistant MCF-7 breast cancer cells. Breast Cancer Res. 2007;9:R50. doi: 10.1186/bcr1754. [DOI] [PMC free article] [PubMed] [Google Scholar]
- 39.Menendez JA, Lupu R. Transphosphorylation of kinase-dead HER3 and breast cancer progression: a new stand-point or an old concept revisited? Breast Cancer Res. 2007;9:111. doi: 10.1186/bcr1773. [DOI] [PMC free article] [PubMed] [Google Scholar]
- 40.Stamos J, Sliwkowski MX, Eigenbrot C. Structure of the epidermal growth factor receptor kinase domain alone and in complex with a 4-anilinoquinazoline inhibitor. J Biol Chem. 2002;277:46265–46272. doi: 10.1074/jbc.M207135200. [DOI] [PubMed] [Google Scholar]
- 41.Qiu C, Tarrant MK, Choi SH, Sathyamurthy A, Bose R, Banjade S, Pal A, Bornmann WG, Lemmon MA, Cole PA, Leahy DJ. Mechanism of activation and inhibition of the HER4/ErbB4 kinase. Structure (London) 2008;16:460–467. doi: 10.1016/j.str.2007.12.016. [DOI] [PMC free article] [PubMed] [Google Scholar]
- 42.Sali A, Blundell TL. Comparative protein modelling by satisfaction of spatial restraints. J Mol Biol. 1993;234:779–815. doi: 10.1006/jmbi.1993.1626. [DOI] [PubMed] [Google Scholar]
- 43.Fiser A, Do RK, Sali A. Modeling of loops in protein structures. Protein Sci. 2000;9:1753–1773. doi: 10.1110/ps.9.9.1753. [DOI] [PMC free article] [PubMed] [Google Scholar]
- 44.Shen MY, Sali A. Statistical potential for assessment and prediction of protein structures. Protein Sci. 2006;15:2507–2524. doi: 10.1110/ps.062416606. [DOI] [PMC free article] [PubMed] [Google Scholar]
- 45.Taylor SS, Kornev AP. Yet another “active” pseudokinase Erb3. Proc Natl Acad Sci U S A. 2010;107:8047–8048. doi: 10.1073/pnas.1003436107. [DOI] [PMC free article] [PubMed] [Google Scholar]
- 46.Stein RA, Staros JV. Insights into the evolution of the ErbB receptor family and their ligands from sequence analysis. BMC Evol Biol. 2006;6:79. doi: 10.1186/1471-2148-6-79. [DOI] [PMC free article] [PubMed] [Google Scholar]
- 47.Telesco SE, Radhakrishnan R. Atomistic insights into regulatory mechanisms of the HER2 tyrosine kinase domain: a molecular dynamics study. Biophys J. 2009;96:2321–2334. doi: 10.1016/j.bpj.2008.12.3912. [DOI] [PMC free article] [PubMed] [Google Scholar]
- 48.Shih AJ, Telesco SE, Choi SH, Lemmon MA, Radhakrishnan R. Molecular dynamics analysis of conserved hydrophobic and hydrophilic bond interaction networks in ErbB family kinases. Biochem J. 2011;436:241–251. doi: 10.1042/BJ20101791. [DOI] [PMC free article] [PubMed] [Google Scholar]
- 49.Shih AJ, Telesco SE, Radhakrishnan R. Analysis of somatic mutations in cancer: molecular mechanisms of activation in the ErbB family of receptor tyrosine kinases. Cancers. 2011;3:1195–1231. doi: 10.3390/cancers3011195. [DOI] [PMC free article] [PubMed] [Google Scholar]
- 50.Telesco SE, Shih AJ, Liu Y, Radhakrishnan R. Molecular Simulation of Structure, Dynamics, and Function in the HER2 Receptor Tyrosine Kinase and Relevance to Cancer Mutations. Cancer Res J. 2011;4:1–35. [PMC free article] [PubMed] [Google Scholar]
- 51.Kornev AP, Haste NM, Taylor SS, Eyck LF. Surface comparison of active and inactive protein kinases identifies a conserved activation mechanism. Proc Natl Acad Sci U S A. 2006;103:17783–17788. doi: 10.1073/pnas.0607656103. [DOI] [PMC free article] [PubMed] [Google Scholar]
- 52.Kornev AP, Taylor SS, Ten Eyck LF. A helix scaffold for the assembly of active protein kinases. Proc Natl Acad Sci U S A. 2008;105:14377–14382. doi: 10.1073/pnas.0807988105. [DOI] [PMC free article] [PubMed] [Google Scholar]
- 53.Acharya H, Vembanur S, Jamadagni SN, Garde S. Mapping hydrophobicity at the nanoscale: applications to hetero-geneous surfaces and proteins. Faraday Discuss. 2010;146:353–365. doi: 10.1039/b927019a. discussion 367–393, 395–401. [DOI] [PubMed] [Google Scholar]
- 54.Godawat R, Jamadagni SN, Garde S. Characterizing hydrophobicity of interfaces by using cavity formation, solute binding, and water correlations. Proc Natl Acad Sci U S A. 2009;106:15119–15124. doi: 10.1073/pnas.0902778106. [DOI] [PMC free article] [PubMed] [Google Scholar]
- 55.Sharma SV, Bell DW, Settleman J, Haber DA. Epidermal growth factor receptor mutations in lung cancer. Nat Rev Cancer. 2007;7:169–181. doi: 10.1038/nrc2088. [DOI] [PubMed] [Google Scholar]
- 56.Schoeberl B, Pace EA, Fitzgerald JB, Harms BD, Xu L, Nie L, Linggi B, Kalra A, Paragas V, Bukhalid R, Grantcharova V, Kohli N, West KA, Leszczyniecka M, Feldhaus MJ, Kudla AJ, Nielsen UB. Therapeutically targeting ErbB3: a key node in ligand-induced activation of the ErbB receptor-PI3K axis. Sci Signaling. 2009;2:ra31. doi: 10.1126/scisignal.2000352. [DOI] [PubMed] [Google Scholar]
- 57.Hsieh AC, Moasser MM. Targeting HER proteins in cancer therapy and the role of the non-target HER3. Br J Cancer. 2007;97:453–457. doi: 10.1038/sj.bjc.6603910. [DOI] [PMC free article] [PubMed] [Google Scholar]
- 58.Ferrer-Soler L, Vazquez-Martin A, Brunet J, Menendez JA, De Llorens R, Colomer R. An update of the mechanisms of resistance to EGFR-tyrosine kinase inhibitors in breast cancer: Gefitinib (Iressa)-induced changes in the expression and nucleocytoplasmic trafficking of HER-ligands (Review) Int J Mol Med. 2007;20:3–10. [PubMed] [Google Scholar]
- 59.Motoyama AB, Hynes NE, Lane HA. The efficacy of ErbB receptor-targeted anticancer therapeutics is influenced by the availability of epidermal growth factor-related peptides. Cancer Res. 2002;62:3151–3158. [PubMed] [Google Scholar]
- 60.Offterdinger M, Schofer C, Weipoltshammer K, Grunt TW. c-erbB-3: a nuclear protein in mammary epithelial cells. J Cell Biol. 2002;157:929–939. doi: 10.1083/jcb.200109033. [DOI] [PMC free article] [PubMed] [Google Scholar]
- 61.Schoeberl B, Faber AC, Li D, Liang MC, Crosby K, Onsum M, Burenkova O, Pace E, Walton Z, Nie L, Fulgham A, Song Y, Nielsen UB, Engelman JA, Wong KK. An ErbB3 antibody, MM-121, is active in cancers with ligand-dependent activation. Cancer Res. 2010;70:2485–2494. doi: 10.1158/0008-5472.CAN-09-3145. [DOI] [PMC free article] [PubMed] [Google Scholar]
- 62.MacKerell AD, Jr, Bashford D, Bellott M, Dunbrack RL, Evanseck JD, Field MJ, Fischer S, Gao J, Guo H, Ha S, Joseph-McCarthy D, Kuchnir L, Kuczera K, Lau FTK, Mattos C, Michnick S, Ngo T, Nguyen DT, Prodhom B, Reiher WE, III, Roux B, Schlenkrich M, Smith JC, Stote R, Straub J, Watanabe M, Wiorkiewicz-Kuczera J, Yin D, Karplus M. All-atom empirical potential for molecular modeling and dynamics studies of proteins. J Phys Chem B. 1998;102:3586–3616. doi: 10.1021/jp973084f. [DOI] [PubMed] [Google Scholar]
- 63.Laskowski RA, MacArthur MW, Moss DS, Thornton JM. PROCHECK: a program to check the stereochemical quality of protein structures. J Appl Crystallogr. 1993;26:283–291. [Google Scholar]
- 64.Humphrey W, Dalke A, Schulten K. VMD: visual molecular dynamics. J Mol Graphics. 1996;14:33–38. 27–38. doi: 10.1016/0263-7855(96)00018-5. [DOI] [PubMed] [Google Scholar]
- 65.Jorgensen WL, Chandrasekar J, Madura J, Impey R, Klein M. Comparison of simple potential functions for simulating liquid water. J Chem Phys. 1983;79:926–935. [Google Scholar]
- 66.Grubmuller H, Heymann B, Tavan P. Ligand binding: molecular mechanics calculation of the streptavidin-biotin rupture force. Science. 1996;271:997–999. doi: 10.1126/science.271.5251.997. [DOI] [PubMed] [Google Scholar]
- 67.Phillips JC, Braun R, Wang W, Gumbart J, Tajkhorshid E, Villa E, Chipot C, Skeel RD, Kale L, Schulten K. Scalable molecular dynamics with NAMD. J Comput Chem. 2005;26:1781–1802. doi: 10.1002/jcc.20289. [DOI] [PMC free article] [PubMed] [Google Scholar]
- 68.Feller SE, Zhang Y, Pastor RW, Brooks BR. Constant pressure molecular dynamics simulation: the Langevin piston method. J Chem Phys. 1995;103:4613–4621. [Google Scholar]
- 69.Glykos NM. Software news and updates. Carma: a molecular dynamics analysis program. J Comput Chem. 2006;27:1765–1768. doi: 10.1002/jcc.20482. [DOI] [PubMed] [Google Scholar]
- 70.Schmidt H. SBaddon: high performance simulation for the Systems Biology Toolbox for MATLAB. Bioinformatics. 2007;23:646–647. doi: 10.1093/bioinformatics/btl668. [DOI] [PubMed] [Google Scholar]
- 71.Zi Z, Zheng Y, Rundell AE, Klipp E. SBML-SAT: a systems biology markup language (SBML) based sensitivity analysis tool. BMC Bioinf. 2008;9:342. doi: 10.1186/1471-2105-9-342. [DOI] [PMC free article] [PubMed] [Google Scholar]
- 72.Le Novere N, Bornstein B, Broicher A, Courtot M, Donizelli M, Dharuri H, Li L, Sauro H, Schilstra M, Shapiro B, Snoep JL, Hucka M. BioModels Database: a free, centralized database of curated, published, quantitative kinetic models of biochemical and cellular systems. Nucleic Acids Res. 2006;34:D689–D691. doi: 10.1093/nar/gkj092. [DOI] [PMC free article] [PubMed] [Google Scholar]
- 73.Li C, Donizelli M, Rodriguez N, Dharuri H, Endler L, Chelliah V, Li L, He E, Henry A, Stefan MI, Snoep JL, Hucka M, Le Novere N, Laibe C. BioModels Database: an enhanced, curated and annotated resource for published quantitative kinetic models. BMC Syst Biol. 2010;4:92. doi: 10.1186/1752-0509-4-92. [DOI] [PMC free article] [PubMed] [Google Scholar]
- 74.Le Novere N, Hucka M, Mi H, Moodie S, Schreiber F, Sorokin A, Demir E, Wegner K, Aladjem MI, Wimalaratne SM, Bergman FT, Gauges R, Ghazal P, Kawaji H, Li L, Matsuoka Y, Villeger A, Boyd SE, Calzone L, Courtot M, Dogrusoz U, Freeman TC, Funahashi A, Ghosh S, Jouraku A, Kim S, Kolpakov F, Luna A, Sahle S, Schmidt E, Watterson S, Wu G, Goryanin I, Kell DB, Sander C, Sauro H, Snoep JL, Kohn K, Kitano H. The Systems Biology Graphical Notation. Nat Biotechnol. 2009;27:735–741. doi: 10.1038/nbt.1558. [DOI] [PubMed] [Google Scholar]
Associated Data
This section collects any data citations, data availability statements, or supplementary materials included in this article.