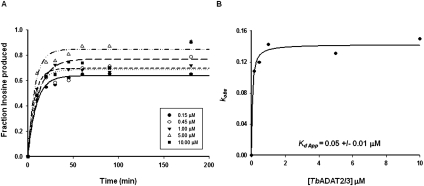
FIGURE 3.
Kinetic determination of the dissociation constant for TbADAT2/3. (A) Single-turnover assays were performed as described in Materials and Methods. For each protein concentration (ranging from 0.15 μM to 10 μM), the fraction of inosine produced was plotted against time and fit to the single exponential equation f = a(1 − e−kt). kobs values were calculated for each curve representing protein concentration. (B) kobs values were plotted against TbADAT2/3 concentration and fit to a single ligand-binding curve; the apparent dissociation constant (Kd app) was calculated by nonlinear regression using SigmaPlot software.

