

Abstract
Phylogenetic community ecology seeks to explain the processes involved in the formation of species assemblages by analysing their phylogenetic structure, and to date has focused primarily on local-scale communities. Macroecology, on the other hand, is concerned with the structure of assemblages at large geographical scales, but has remained largely non-phylogenetic. Analysing the phylogenetic structure of large-scale assemblages provides a link between these two research programmes. In this paper, I ask whether we should expect large-scale assemblages to show significant phylogenetic structure, by outlining some of the ecological and macroevolutionary processes that may play a role in assemblage formation. As a case study, I then explore the phylogenetic structure of carnivore assemblages within the terrestrial ecoregions of Africa. Many assemblages at these scales are indeed phylogenetically non-random (either clustered or overdispersed). One interpretation of the observed patterns of phylogenetic structure is that many clades underwent rapid biome-filling radiations, followed by diversification slowdown and competitive sorting as niche space became saturated.
Keywords: assembly rules, diversification, extinction, macroevolution, null models, speciation
1. Introduction
Since a pioneering paper was published by Webb et al. [1] a decade ago, analysis of the phylogenetic structure of species assemblages has grown rapidly into the prosperous research programme of phylogenetic community ecology [2–5]. Phylogenetic community ecology does not pose novel problems or raise new issues; it simply uses new kinds of data and new analytical tools to ask the same fundamental question that community ecologists have been struggling with for decades. This question is: if the set of species found in a particular place at a particular time is a limited subset of the species found within the broader region, are the processes that determine this subset predictable and deterministic, or neutral and stochastic? Attempts to answer this question have focused largely on tests of whether assemblages show significant structure: that is, whether assemblages consist of species that are non-random subsets of the regional pool of species, with respect to taxonomic composition or ecological attributes [6]. If assemblages are non-random, then the nature of the non-randomness may provide clues to the ecological and evolutionary processes underlying assemblage formation.
The idea that these processes might be revealed in the patterns of phylogenetic relatedness among species grew out of two suppositions. One was that species with similar ways of obtaining resources from the environment may compete, leading to exclusion of the weaker competitor [7]. The other supposition was that closely related species, having been derived from a recent common ancestor, are often ecologically similar, so may compete more strongly than more distant relatives [8]. If the principle of competitive exclusion operates in multispecies assemblages, we might expect to see fewer closely related species coexisting in a particular area than we would in the absence of interspecific competition. Early efforts to test this hypothesis systematically were based on analysing the ratio of species numbers to genus numbers (S/G ratios) within assemblages. The expectation was that in a competition-structured assemblage, S/G ratios should be lower than would be the case if the assemblage was simply a random subset of species drawn from the regional species pool (Jaccard 1922, cited in [9]). The early emphasis was on competition as a structuring process, although the role of habitat filtering in elevating the coexistence of close relatives has also been recognized [10].
With the rapid increase in availability of phylogenies in the 1990s and 2000s, these kinds of tests were extended to exploit the rich source of information represented by phylogenies. A phylogeny provides a more precise estimate of the degree of relatedness of two species than a taxonomic classification, lending more power (at least in principle) to tests based on relatedness. Analysing the phylogenetic structure of an assemblage and comparing it to null expectations is thus a natural extension of the analysis of S/G ratios. One early analysis of phylogenetic assemblage structure was presented by Haydon et al. [11], who simulated the radiation of a clade on an island archipelago. They measured phylogenetic structure of the simulated assemblages using the ratio of the mean branch length separating pairs of co-occurring species to the mean branch length separating all pairs of species, across the archipelago. A few years later, Webb [1] presented two similar metrics (net relatedness index (NRI) and nearest taxa index (NTI)) to measure phylogenetic structure of rainforest tree assemblages. Modified forms of these two metrics have been widely used since, and this paper, together with a follow-up review [5], was largely responsible for kickstarting the current wave of interest in phylogenetic community structure.
To date, most analyses of phylogenetic structure (with a few exceptions: [12,13]) have focused on ‘local-scale’ communities: that is, species found within areas considered to be within the dispersal capabilities of all individuals, for example, 0.16 ha rainforest plots [1] or 5 × 10 m fynbos plots [14]. The emphasis on local scales is probably because interspecific competition remains a process of particular interest for community ecologists, and it is within small areas that the influence of competition is expected to be most evident. What about assemblages of species delimited within large geographical regions? So far, the principal role of large-scale assemblages in phylogenetic community ecology has been to provide the regional source pools from which local-scale null models are constructed. Little attention has been directed in describing and understanding the phylogenetic structure of the regional pools themselves. On the other hand, the macroecology research programme is aimed explicitly at understanding the structure of regional and continental assemblages. However, the emphasis in macroecology has been to analyse structure in terms of species-level traits, such as body size, population density and geographical range size, rather than phylogenetic relatedness [15,16]. Hence, analyses of the phylogenetic structure of large-scale assemblages helps to form a link between the two ecological research programmes of phylogenetic community ecology and macroecology.
In local-scale assemblages, phylogenetic structure has been interpreted primarily as the result of ecological sorting processes: as well as competition, the mechanism most commonly invoked is habitat filtering, where close relatives are brought together by shared habitat preferences [1]. At larger scales, it becomes necessary to consider macroevolutionary as well as ecological processes as determinants of the structure of assemblages [13,15]. But do ecological sorting processes like competitive exclusion or habitat filtering still play a role at large scales? Or are these kinds of processes rendered unimportant by habitat heterogeneity and opportunities for species to segregate spatially within large geographical regions? The answer has implications for understanding not only the formation of regional assemblages and geographical patterns of biodiversity, but also for the formation of local communities. For example, a competition-structured regional species pool could reduce the power of null models to detect the signature of competition at local scales [17].
In this paper, I examine the phylogenetic structure of mammal assemblages at scales larger than the local community. I begin by outlining some of the processes that may drive the formation of assemblages at these larger scales, and ask whether we should expect to see phylogenetic non-randomness in assemblage structure at these scales. Using African carnivores (order Carnivora) as a case study, I then explore patterns in the phylogenetic structure of assemblages within ecoregions, contiguous areas of structurally and ecologically similar habitat that range in size from 49 km2 to over 4.6 million km2. I ask whether ecoregion carnivore assemblages, in general, tend to show non-random phylogenetic structure, whether the choice of source pool makes a substantial difference to the detection of significant structure, and whether phylogenetic structure varies with ecoregion area. Answers to these questions may offer clues to the processes underlying assemblage formation at large geographical scales.
2. Mechanisms producing non-random assemblages at large geographical scales
When testing hypotheses about the processes structuring assemblages at local scales, the usual first step is to test if the assemblage actually shows significant structure, by comparing it to a set of null assemblages generated by randomly drawing species from a defined regional species pool, or shuffling species among sites within the regional pool [6]. The second step is to ask whether any structure (i.e. non-randomness with respect to a given measure of assemblage composition) is consistent with the predictions of the hypothesized process of assemblage formation. For large-scale assemblages, such as the set of species found within an ecoregion, a reserve or a geopolitical boundary, the same procedure can be applied. In these cases, we should ask whether the assemblage is a non-random subset of the species found (for example) in the broader biome, ecoclimatic region or continent. Below, I outline some of the mechanisms that could produce phylogenetic non-randomness of mammal assemblages at large geographical scales. Phylogenetic non-randomness may arise because the phylogeny itself carries the signal of historical events (macroevolutionary processes of speciation and extinction), or because phylogenetic relatedness is a proxy for ecological similarity (ecological sorting processes of habitat filtering and interspecific competition).
(a). Trait- or environment-linked speciation and extinction
Diversification rates in mammals appear to be geographically heterogeneous [18], either because rates are linked to biological properties of particular clades, which inhabit different regions, or because rates are linked to features of the environment. If rates of speciation or extinction are associated with heritable biological traits such as life-history speed or population density [19,20], a phylogeny may become increasingly imbalanced over time, with species increasingly concentrated within a few large clades. Depending on the extent to which rapidly diversifying clades occupy restricted geographical regions, the result will be geographical as well as phylogenetic heterogeneity in speciation or extinction rates. Hence, regions with clades that are speciating rapidly or going extinct slowly will contain a high proportion of closely related species, and assemblages in these regions should be phylogenetically clustered compared with the broader biome or continental source pool. Alternatively, speciation and extinction rates may be associated with environmental features such as topographic diversity or available energy, without necessarily being biased towards certain clades [21,22]. Again, elevated speciation rates or reduced extinction rates in these kinds of environments should produce phylogenetically clustered assemblages, compared with the source pool.
(b). Density-dependent speciation and extinction
Although some models of cladogenesis assume unlimited accumulation of species, it is also possible that diversification rates within clades are density-dependent, such that speciation rates slow or extinction rates rise as an equilibrium or saturation level of species richness is approached [23–28]. The likely effects of saturation on patterns of phylogenetic assemblage structure are difficult to predict, but high extinction rates could result in longer apparent branches, on average [29], which may lead to increased phylogenetic dispersion. Within a given region, if large clades are more likely to have become saturated than smaller clades [25], density-dependent diversification could serve to limit the degree to which the regional assemblage is phylogenetically clustered within the broader species pool. More precise predictions about the possible influence of density-dependent diversification on phylogenetic assemblage structure could be obtained from simulations.
(c). Habitat filtering and geographical range limits
Any assemblage can only consist of species whose environmental tolerance limits allow them to maintain a population in the relevant site or region. Hence, if adaptations to particular environmental conditions are shared by closely related species, an assemblage may become phylogenetically clustered compared with the broader region, a process referred to as habitat filtering [1,5]. At the level of local-scale communities, habitat filtering relates to the movement of individuals within a landscape: an animal may only establish a breeding territory in a particular location if conditions are suitable. At large geographical scales, habitat filtering can be thought of in terms of the differential expansion of species' geographical ranges and the abiotic determinants of range limits. However, although environmental conditions determine which species cannot be present in a particular region, they do not necessarily predict which species will be found there. So, the degree to which habitat filtering can account for phylogenetic structure of assemblages at large scales will depend largely on (i) the discrepancy between species' fundamental and realized niches (as expressed in the geographical range), and (ii) the strength of phylogenetic signal in species' realized niches.
In mammals, the discrepancy between fundamental and realized niches can be considerable. Shifts in species' geographical ranges following deglaciation of northern latitudes in the Late Pleistocene and through the Holocene appear to have been mostly idiosyncratic, with members of the same Pleistocene assemblage responding in different ways to climate and habitat shifts [30,31]. This suggests that there is not always a tight association between species assemblages and particular environments, at least in regions that have experienced major and rapid climate shifts. It is possible that in more climatically stable regions at lower latitudes, there is less of a disjunction between fundamental and realized niches, and a stronger association between assemblages and environments. If this is the case, the influence of habitat filtering on the phylogenetic structure of large-scale assemblages may be stronger in the tropics compared with high latitudes.
However, there is also reason to believe that phylogenetic signal in the realized niche of mammal species is low, even in climatically stable regions. On the one hand, geographical ranges may be limited by hard boundaries such as a large river or an abrupt change in habitat type, and the ability of species to breach these kinds of boundaries will be determined at least partly by traits shared among closely related species. However, more subtle environmental gradients can also limit the expansion of a species' range. Indeed, a dispersal barrier may be defined as a selective gradient where a species' available genetic variation is insufficient to allow populations at the range margin to adapt to changing conditions across the gradient [32]. Furthermore, the capacity for peripheral populations to adapt and spread may be limited by gene flow from denser populations at the core of the species' range, where selective pressures may be different [32]. To the extent that available genetic variation and strength of gene flow within species' ranges do not show strong phylogenetic signal, there is an idiosyncratic, non-phylogenetic component to species' capacity for range expansion. This may limit the degree to which the match of species' distributions to habitats is predictable from phylogeny, thus limiting influence of habitat filtering on phylogenetic structure of large-scale assemblages.
(d). Interspecific competition
Competition has long been a major focus of interest for researchers studying the structure and composition of local-scale assemblages. If interspecific competition is mediated by phylogenetically conserved traits, a competition-structured assemblage is expected to be phylogenetically overdispersed, because competitive exclusion should be more likely among closely related species [1,5]. In mammals, interspecific competition has been shown to reduce population densities, or cause local extinction, of weaker competitors within local sites (e.g. [33–35]). It is therefore reasonable to expect that local-scale mammal assemblages are sometimes structured by competition. But does any influence of competition at the level of local populations scale up to an effect on the structure of large-scale assemblages [34,36]?
Theory predicts that even in the absence of significant abiotic barriers to dispersal, interspecific competition can produce stable geographical range limits that are narrower than would be the case without competition [32,37]. This is supported by numerous examples in mammals. For example, whereas the northern limits of the distribution of arctic foxes (Alopex lagopus) are determined by abiotic factors, the southern limits appear to be determined by competition for food and den sites with red foxes (Vulpes vulpes), which are ecologically similar but larger [38]. In North America, abundances of coyotes (Canis latrans) are lower, and mortality rates higher, in areas with high wolf (Canis lupus) densities [39]. Coyotes have expanded their distribution throughout much of the United States following recent extirpation of wolves, suggesting that their distributions were previously limited by competition with wolves [39].
Rapid and recent range shifts precipitated by invasive species present particularly clear evidence of range boundaries being limited by competition. In Britain, grey squirrels (Sciurus carolinensis) were introduced from North America in the late nineteenth century, and have since spread through most of England. Simultaneously, the range of the closely related native red squirrels (Sciurus vulgaris) has contracted in a pattern complementary to the expansion of the grey squirrels. The two species have similar food requirements, and similar patterns of space use and daily activity, but in broadleaf woodlands grey squirrels appear to have a competitive advantage, as they are able to digest acorns more efficiently and interfere in seed-hoarding by red squirrels [33,40]. It therefore seems very likely that competition has been a major factor in the replacement of red by grey squirrels across Britain [33].
Some macroecological patterns in mammals have been interpreted as the outcome of competition on geographical scales [34], and large-scale, assemblage-level analyses suggest that mammal geographical distributions may be limited by interspecific competition. Letcher et al. [41] showed that closely related mammal species of similar body size have less geographical overlap than expected under a null model. A similar finding was made for granivorous rodents by Bowers & Brown [42]. More recently, Davies et al. [43] found that a large part of the variation in range overlap among carnivore sister species was explained by divergence in carnassial tooth length, a key ecological trait in carnivores. This suggests that competition has either driven the evolutionary divergence of carnassial length between sympatric species, or has led to the exclusion of weaker competitors from their potential distributions.
3. Large-scale assemblage structure of african carnivores
The aim of the analyses presented here was to explore the structure of large-scale assemblages for a single taxonomic guild of mammals. I confined the analysis to African carnivores to avoid the extra complexity likely to be introduced by inter-ordinal or cross-continental comparisons. Carnivores were chosen because their geographical distributions are perhaps better-known than other mammal orders, and their phylogeny is one of the best-resolved, with 79 per cent of nodes resolved [44]. The basic question was whether assemblages tend to show significant phylogenetic structure consistent with any of the processes outlined above. I begin by analysing phylogenetic structure of carnivore assemblages within ecoregions (see below), using two metrics that capture different aspects of the average relatedness among species. I then test the influence of the choice of source pool, biome type and geographical area on the structure of assemblages.
(a). Methods
I used terrestrial ecoregions as the geographical unit for defining carnivore assemblages in Africa, excluding Madagascar. Ecoregions are a way of defining distinct biotas occurring within relatively large, contiguous areas of similar habitat and climate [45]. Ecoregions are grouped into biomes, ecoclimatically similar regions that are not necessarily contiguous. I excluded from the analyses ecoregions found in the mangrove and inland water biomes, and in two biomes (temperate conifer forest and tropical and subtropical dry broadleaf forests) in which there was only one ecoregion (which would mean the assemblage and source pool are the same, see below). I identified the set of carnivore species found within each of the remaining 102 ecoregions using geographical range maps from the Global Mammal Assessment [46].
To calculate phylogenetic structure of ecoregion assemblages, I used two metrics, NRI and NTI [5]. NRI measures the standardized effect size of the mean phylogenetic branch length separating each pair of species in the assemblage. NTI is similar but measures only branch lengths separating each species from its nearest relative. NRI is thus a measure of the degree of phylogenetic clustering (species more closely related than expected) or overdispersion (species less closely related than expected) throughout the phylogeny, while NTI reflects clustering or overdispersion at the tips of the phylogeny. Branch lengths were from the mammal supertree of Bininda-Emonds et al. [44]. NRI and NTI were implemented using the functions ‘ses.mpd’ and ‘ses.mntd’, respectively, in the R library Picante [47].
Null models for assemblage structure of each ecoregion were constructed using two levels of source pool: biomes and the entire African continent. As implemented in Picante, NRI and NTI were calculated using distributions of 1000 random values of mean phylogenetic distances between species, obtained by shuffling species among ecoregions. For biome-level source pools, species were shuffled among ecoregions within the same biome. For continental source pools, species were shuffled among ecoregions across the whole of Africa, excluding the ecoregions omitted from the analysis (as described above). Two-tailed p-values were obtained by comparing the observed mean pairwise distances (for NRI) and mean nearest neighbour distances (for NTI) with those from the distributions of random matrices. Assemblages with p < 0.025 were considered significantly clustered, and assemblages with p > 0.975 were considered significantly overdispersed. The raw data matrices and derived data values are provided in the electronic supplementary material.
(b). Phylogenetic structure: comparison of biomes and source pools
Of the 102 terrestrial ecoregions included in the analysis, a large proportion show significant phylogenetic non-randomness in their carnivore assemblages, but the frequency and kind of non-randomness varies depending on the metric and the source pool used to construct null models (figure 1). When biome source pools are used (figure 1a), the majority of ecoregion assemblages have phylogenetic structure consistent with the null model. However, phylogenetic overdispersion is more prevalent than clustering, particularly for NTI, for which 21 ecoregions (20.8%) are significantly overdispersed and three are clustered. When continental source pools are used (figure 1b), this pattern is reversed: for NRI and NTI, 68 and 26 ecoregions, respectively (67% and 25.4%), are significantly clustered, and none are overdispersed.
Figure 1.
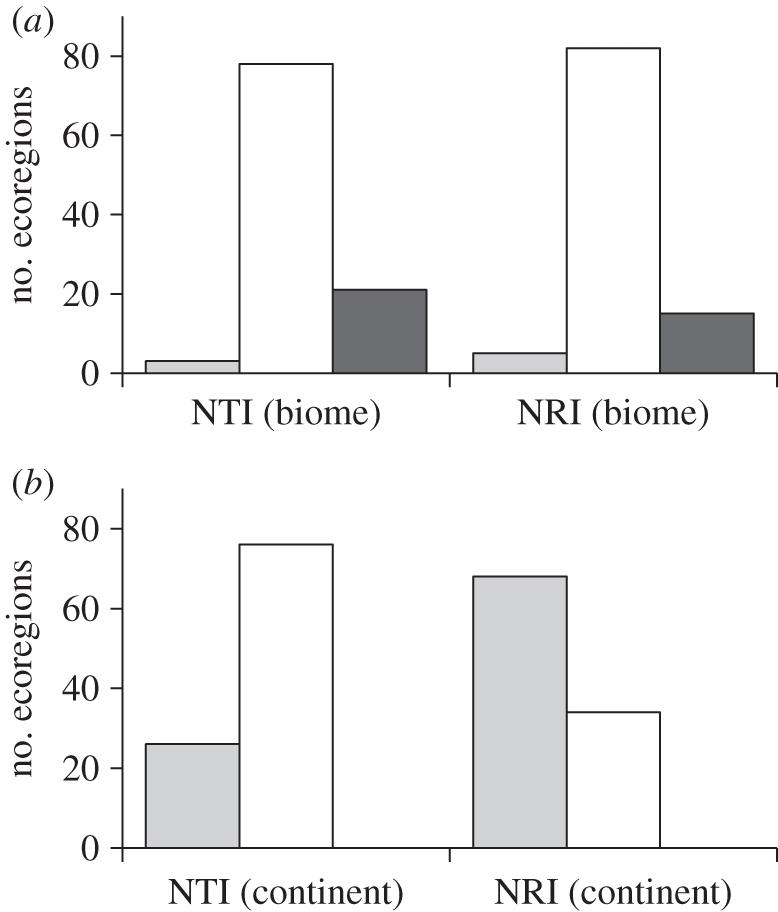
Numbers of African ecoregions showing significant phylogenetic structure in carnivore assemblages, using two metrics, NRI and NTI. (a) Null models constructed from biome source pools, (b) null models constructed from continental source pools. Light grey bars, clustered; unfilled bars, random; dark grey bars, overdispersed.
Can we infer anything about the processes of ecoregion assemblage formation from these general patterns in the frequency of phylogenetic clustering and overdispersion? Tentatively, I believe we can. If each clade originates in a particular area, then diversifies and spreads geographically, then each clade may (i) expand to occupy the contiguous area of suitable habitat represented by an ecoregion; (ii) expand beyond ecoregion boundaries to occupy the area of suitable habitat represented by the biome; or (iii) keep expanding beyond biome boundaries and throughout the continent, by radiating into a diverse range of habitat types. A clade's geographical expansion may proceed by (iv) gradual diffusion from its centre of origin, so that area occupied by the clade is proportional to its age, or (v) rapid radiation into the available area of suitable habitat, before niches become filled and diversification slows.
The patterns of phylogenetic clustering and overdispersion in African carnivores appear to be consistent with scenarios (ii) and (v) above: that is, a pattern of biome-filling radiations followed by niche saturation and competitive sorting. That these were biome-filling rather than ecoregion-filling radiations is supported by the contrasting patterns obtained under biome-level and continental-level source pools. Under scenarios (i) or (iv) above, we would expect to see many ecoregion assemblages being phylogenetically clustered within biomes, but this is not the case (figure 1a). On the other hand, a large proportion of ecoregions are clustered within the continental fauna (figure 1b), which suggests that scenario (iii) is uncommon.
Differences in patterns of clustering and overdispersion at shallow (NTI) and deeper (NRI) levels in the phylogeny could indicate support for scenario (v) above. The higher frequency of clustered assemblages for NRI compared with NTI, under a continental source pool (figure 1b), suggests that if there were biome-filling radiations, many of them were ancient, with rates of diversification slowing in more recent times, as expected under density-dependent models of clade growth. This slowdown may have been driven by the saturation and increasingly fine subdivision of niche space within ecoregions, and a subsequent increase in interspecific competition. With biome source pools (figure 1a), competitive sorting among recent lineages may be reflected in the greater frequency of overdispersion closer to the tips of the phylogeny (NTI compared with NRI), where we expect competition to be most common.
Comparisons of patterns between different biomes (figure 2) may also be revealing. In the species-rich tropical biomes (tropical and subtropical moist broadleaf forests, and tropical and subtropical grasslands, savannahs and shrublands), as well as in the montane grasslands and shrublands biome, the contrast between NRI clustering within the continental source pool (figure 2c) and NTI overdispersion within biome source pools (figure 2b) is particularly strong. If a process of ancient biome-filling radiations followed by more recent competitive sorting is a reasonable explanation for this contrast, as suggested above, then this process seems to have occurred primarily in the tropics. In the remaining, higher latitude, biomes (deserts and xeric shrublands, flooded grasslands and savannahs, and Mediterranean forests, woodlands and scrub), the contrasts between NRI and NTI, and between biome and continental source pools, are less sharp.
Figure 2.

Box and whisker plots showing the distributions of p-values (on the x-axis) for phylogenetic structure metrics ((a,c) NRI and (b,d) NTI) among ecoregions. Null models are constructed from (a,b) biome and (c,d) continental source pools. p-values at the left extreme of the distributions (p < 0.025) indicate phylogenetic clustering; p-values at the right extreme of the distributions (p > 0.975) indicate phylogenetic overdispersion. Ecoregions are grouped into biomes, as follows: TSMBF, tropical and subtropical moist broadleaf forests; TSGSS, tropical and subtropical grasslands, savannahs and shrublands; MGS, montane grasslands and shrublands; MFWS, Mediterranean forests, woodlands and scrub; FGS, flooded grasslands and savannahs; DXS, deserts and xeric shrublands. Width of the boxes is proportional to the number of ecoregions in each biome.
(c). Phylogenetic structure: association with ecoregion area
There are several reasons to predict that phylogenetic assemblage structure might vary with the size of ecoregions. Speciation rates are expected to increase with the size of regions, because the probability of in situ speciation rises sharply in regions above a threshold area [48–50]. At the same time, extinction rates should decrease, because larger regions can accommodate larger populations, and are less vulnerable to environmental disturbances [51]. For both of these reasons, we might expect larger ecoregions to show more evidence of phylogenetic clustering than smaller ones. This association should be evident using null models constructed from both biome and continental source pools, if clades diversify and expand by gradual diffusion from a centre of origin (scenario (iv) above). On the other hand, if clades rapidly expand into the available area of suitable habitat (scenario (v) above), the association between large ecoregions and phylogenetic clustering will be less clear, or even non-existent. The patterns for African carnivores offer no strong evidence that larger ecoregions are more clustered (figure 3). For NRI, there is indeed a weak negative association with ecoregion area when continental source pools are used (r2 = 0.03, p = 0.06), but when biome source pools are used the association is weakly positive (r2 = 0.06, p = 0.01). There are no significant associations between ecoregion area and NTI. The lack of any strong tendency for large ecoregions to show phylogenetic clustering is consistent with the scenario of radiating clades spreading out rapidly to fill each biome, rather than diffusing gradually from centres of origin.
Figure 3.

Associations between ecoregion area and phylogenetic structure ((a,c) NRI and (b,d) NTI) of ecoregion carnivore assemblages, using null models constructed from (a,b) biome and (c,d) continental source pools. Open circles represent ecoregions in which assemblage structure is consistent with the null model; triangles represent ecoregions in which assemblages are significantly overdispersed (positive NRI or NTI value) or significantly clustered (negative NRI or NTI value).
Another possible consequence of clades expanding rapidly, and saturating available niche space, is that smaller ecoregions may be more likely to show the signature of competition-structuring (phylogenetic overdispersion), since there may be fewer opportunities for similar species to avoid competition by spatial or habitat segregation, compared with large ecoregions. Again, this predicted pattern is not evident in the African carnivores, with overdispersion occurring in ecoregions of many sizes, including some of the largest (figure 3). Perhaps this should not be surprising if, as outlined earlier, competitive replacement can occur across areas larger than any African ecoregion.
4. Conclusions
The analyses presented here are not intended to be an in-depth investigation of the structure and the formation of carnivore assemblages in African ecoregions. Rather, they are a preliminary, broad overview of the patterns of phylogenetic structure at large geographical scales. The results show that many large-scale assemblages of African carnivores are phylogenetically non-random, and may provide some insight into the processes by which the assemblages were formed. Although the interpretation of the results is speculative, the patterns of clustering and overdispersion at different levels in the phylogeny appear to suggest a model of clade growth characterized by early biome-filling radiations followed by competitive sorting within ecoregions. This scenario fits with what seems be a growing recognition that models of density-dependent, ecologically limited clade growth are a better explanation for many patterns of diversity than models in which species richness increases with clade age or diversification rate [24–28,52].
Phylogenetic community ecology has hitherto focused primarily on local-scale assemblages and ecological processes, and how they are reflected in the assemblage phylogeny. Macroecology, on the other hand, has focused on large-scale assemblages and macroevolutionary processes, but has been largely non-phylogenetic. Analyses of the phylogenetic structure of large-scale assemblages provides a natural link between these two research programmes. One way of developing this link further would be to analyse distributions of ecologically important species-level traits in the context of phylogenetic assemblage structure, as has been done at the local scale (e.g. [53–55]). Another approach would be to simultaneously test pairwise patterns of species co-occurrence, ecological similarity and phylogenetic relatedness [13].
Acknowledgements
I thank Kate Jones and Kamran Safi for inviting me to contribute to this special issue, and Lindell Bromham and Matthew Phillips for comments on the manuscript. I am supported by an Australian Research Council QEII Fellowship and the Research School of Biology, Australian National University.
References
- 1.Webb C. O. 2000. Exploring the phylogenetic structure of ecological communities: an example for rain forest trees. Am. Nat. 156, 145–155 10.1086/303378 (doi:10.1086/303378) [DOI] [PubMed] [Google Scholar]
- 2.Emerson B. C., Gillespie R. G. 2008. Phylogenetic analysis of community assembly and structure over space and time. Trends Ecol. Evol. 23, 619–630 10.1016/j.tree.2008.07.005 (doi:10.1016/j.tree.2008.07.005) [DOI] [PubMed] [Google Scholar]
- 3.Vamosi S. M., Heard S. B., Vamosi J. C., Webb C. O. 2009. Emerging patterns in the comparative analysis of phylogenetic community structure. Mol. Ecol. 18, 572–592 10.1111/j.1365-294X.2008.04001.x (doi:10.1111/j.1365-294X.2008.04001.x) [DOI] [PubMed] [Google Scholar]
- 4.Webb C. O. 2006. Integrating phylogenies into community ecology. Ecology 87, S1–S2 10.1890/0012-9658(2006)87[1:IPICE]2.0.CO;2 (doi:10.1890/0012-9658(2006)87[1:IPICE]2.0.CO;2) [DOI] [Google Scholar]
- 5.Webb C. O., Ackerly D. D., McPeek M. A., Donoghue M. J. 2002. Phylogenies and community ecology. Annu. Rev. Ecol. Syst. 33, 475–505 10.1146/annurev.ecolsys.33.010802.150448 (doi:10.1146/annurev.ecolsys.33.010802.150448) [DOI] [Google Scholar]
- 6.Gotelli N. J., Graves G. R. 1996. Null models in ecology. Washington, DC: Smithsonian Institution Press [Google Scholar]
- 7.Gause G. F. 1934. The struggle for existence. Baltimore, MD: Williams & Wilkins [Google Scholar]
- 8.Darwin C. 1859. On the origin of species. London: John Murray [Google Scholar]
- 9.Elton C. S. 1946. Competition and the structure of animal communities. J. Anim. Ecol. 15, 54–68 10.2307/1625 (doi:10.2307/1625) [DOI] [Google Scholar]
- 10.Simberloff D. S. 1970. Taxonomic diversity of island biotas. Evolution 24, 23–47 10.2307/2406712 (doi:10.2307/2406712) [DOI] [PubMed] [Google Scholar]
- 11.Haydon D., Radtkey R. R., Pianka E. R. 1993. Experimental biogeography: interactions between stochastic, historical, and ecological processes in a model archipelago. In Species diversity in ecological communities (eds Ricklefs R. E., Schluter D.), pp. 267–280 Chicago, IL: University of Chicago Press [Google Scholar]
- 12.Cardillo M., Gittleman J. L., Purvis A. 2008. Global patterns in the phylogenetic structure of island mammal assemblages. Proc. R. Soc. B 275, 1549–1556 10.1098/rspb.2008.0262 (doi:10.1098/rspb.2008.0262) [DOI] [PMC free article] [PubMed] [Google Scholar]
- 13.Cardillo M., Meijaard E. 2010. Phylogeny and co-occurrence of mammal species on southeast Asian islands. Glob. Ecol. Biogeogr. 19, 465–474 10.1111/j.1466-8238.2010.00537.x (doi:10.1111/j.1466-8238.2010.00537.x) [DOI] [Google Scholar]
- 14.Slingsby J. A., Verboom G. A. 2006. Phylogenetic relatedness limits co-occurrence at fine spatial scales: evidence from the schoenoid sedges (Cyperaceae: Schoeneae) of the Cape Floristic Region, South Africa. Am. Nat. 168, 14–27 10.1086/505158 (doi:10.1086/505158) [DOI] [PubMed] [Google Scholar]
- 15.Brown J. H. 1995. Macroecology Chicago, IL: University of Chicago Press [Google Scholar]
- 16.Gaston K. J., Blackburn T. M. 2000. Pattern and process in macroecology. Oxford, UK: Blackwell Scientific [Google Scholar]
- 17.Colwell R. K., Winkler D. W. 1984. A null model for null models in biogeography. In Ecological communities: conceptual issues and the evidence (eds Strong D. R., Simberloff D., Abeley L., Thistle A. B.), pp. 344–359 Princeton, NJ: Princeton University Press [Google Scholar]
- 18.Weir J. T., Schluter D. 2007. The latitudinal gradient in recent speciation and extinction rates of birds and mammals. Science 315, 1574–1576 10.1126/science.1135590 (doi:10.1126/science.1135590) [DOI] [PubMed] [Google Scholar]
- 19.Cardillo M., Huxtable J. S., Bromham L. 2003. Geographic range size, life history and rates of diversification in Australian mammals. J. Evol. Biol. 16, 282–288 10.1046/j.1420-9101.2003.00513.x (doi:10.1046/j.1420-9101.2003.00513.x) [DOI] [PubMed] [Google Scholar]
- 20.Isaac N. J. B., Jones K. E., Gittleman J. L., Purvis A. 2005. Correlates of species richness in mammals: body size, life history, and ecology. Am. Nat. 165, 600–607 10.1086/429148 (doi:10.1086/429148) [DOI] [PubMed] [Google Scholar]
- 21.Grenyer R., et al. 2006. Global distribution and conservation of rare and threatened vertebrates. Nature 444, 93–96 10.1038/nature05237 (doi:10.1038/nature05237) [DOI] [PubMed] [Google Scholar]
- 22.Lamoreux J. F., Morrison J. C., Ricketts T. H., Olson D. M., Dinerstein E., McKnight M. W., Shugart H. H. 2006. Global tests of biodiversity concordance and the importance of endemism. Nature 440, 212–214 10.1038/nature04291 (doi:10.1038/nature04291) [DOI] [PubMed] [Google Scholar]
- 23.Cardillo M., Orme C. D. L., Owens I. P. F. 2005. Testing for latitudinal bias in diversification rates: an example using New World birds. Ecology 86, 2278–2287 10.1890/05-0112 (doi:10.1890/05-0112) [DOI] [Google Scholar]
- 24.Mittelbach G. G., et al. 2007. Evolution and the latitudinal diversity gradient: speciation, extinction and biogeography. Ecol. Lett. 10, 315–331 10.1111/j.1461-0248.2007.01020.x (doi:10.1111/j.1461-0248.2007.01020.x) [DOI] [PubMed] [Google Scholar]
- 25.Phillimore A. B., Price T. D. 2008. Density-dependent cladogenesis in birds. Plos Biol. 6, 483–489 10.1371/journal.pbio.0060071 (doi:10.1371/journal.pbio.0060071) [DOI] [PMC free article] [PubMed] [Google Scholar]
- 26.Purvis A., Fritz S., Rodríguez J., Harvey P., Grenyer R. 2011. The shape of mammalian phylogeny: patterns, processes, and scales. Phil. Trans. R. Soc. B 366, 2462–2477 10.1098/rstb.2011.0025 (doi:10.1098/rstb.2011.0025). [DOI] [PMC free article] [PubMed] [Google Scholar]
- 27.Rabosky D. L. 2009. Ecological limits on clade diversification in higher taxa. Am. Nat. 173, 662–674 10.1086/597378 (doi:10.1086/597378) [DOI] [PubMed] [Google Scholar]
- 28.Rabosky D. L. 2009. Ecological limits and diversification rate: alternative paradigms to explain the variation in species richness among clades and regions. Ecol. Lett. 12, 735–743 10.1111/j.1461-0248.2009.01333.x (doi:10.1111/j.1461-0248.2009.01333.x) [DOI] [PubMed] [Google Scholar]
- 29.Gaston K. J., Blackburn T. M. 1996. The tropics as a museum of biological diversity: an analysis of the New World avifauna. Proc. R. Soc. Lond. B 263, 63–68 10.1098/rspb.1996.0011 (doi:10.1098/rspb.1996.0011) [DOI] [Google Scholar]
- 30.FAUNMAP Working Group. 1996. Spatial response of mammals to late Quaternary environmental fluctuations. Science 272, 1601–1606 10.1126/science.272.5268.1601 (doi:10.1126/science.272.5268.1601) [DOI] [PubMed] [Google Scholar]
- 31.Lyons S. K. 2003. A quantitative assessment of the range shifts of Pleistocene mammals. J. Mammal. 84, 385–402 (doi:10.1644/1545-1542(2003)084<0385:AQAOTR>2.0.CO;2) [DOI] [Google Scholar]
- 32.Case T. J., Holt R. D., McPeek M. A., Keitt T. H. 2005. The community context of species' borders: ecological and evolutionary perspectives. Oikos 108, 28–46 10.1111/j.0030-1299.2005.13148.x (doi:10.1111/j.0030-1299.2005.13148.x) [DOI] [Google Scholar]
- 33.Bertolino S. 2008. Introduction of the American grey squirrel (Sciurus carolinensis) in Europe: a case study in biological invasion. Curr. Sci. 95, 903–906 [Google Scholar]
- 34.Brown J. H., Fox B. J., Kelt D. A. 2000. Assembly rules: desert rodent communities are structured at scales from local to continental. Am. Nat. 156, 314–321 10.1086/303385 (doi:10.1086/303385) [DOI] [PubMed] [Google Scholar]
- 35.Glen A. S., Dickman C. R. 2005. Complex interactions among mammalian carnivores in Australia, and their implications for wildlife management. Biol. Rev. 80, 387–401 10.1017/S1464793105006718 (doi:10.1017/S1464793105006718) [DOI] [PubMed] [Google Scholar]
- 36.Gotelli N. J., Graves G. R., Rahbek C. 2010. Macroecological signals of species interactions in the Danish avifauna. Proc. Natl Acad. Sci. USA 107, 5030–5035 10.1073/pnas.0914089107 (doi:10.1073/pnas.0914089107) [DOI] [PMC free article] [PubMed] [Google Scholar]
- 37.Price T. D., Kirkpatrick M. 2009. Evolutionarily stable range limits set by interspecific competition. Proc. R. Soc. B 276, 1429–1434 10.1098/rspb.2008.1199 (doi:10.1098/rspb.2008.1199) [DOI] [PMC free article] [PubMed] [Google Scholar]
- 38.Hersteinsson P., Macdonald D. W. 1992. Interspecific competition and the geographical distribution of red and arctic foxes Vulpes vulpes and Alopex lagopus. Oikos 64, 505–515 10.2307/3545168 (doi:10.2307/3545168) [DOI] [Google Scholar]
- 39.Berger K. M., Gese E. M. 2007. Does interference competition with wolves limit the distribution and abundance of coyotes? J. Anim. Ecol. 76, 1075–1085 10.1111/j.1365-2656.2007.01287.x (doi:10.1111/j.1365-2656.2007.01287.x) [DOI] [PubMed] [Google Scholar]
- 40.Bryce J., Johnson P. J., Macdonald D. W. 2002. Can niche use in red and grey squirrels offer clues for their apparent coexistence? J. Appl. Ecol. 39, 875–887 10.1046/j.1365-2664.2002.00765.x (doi:10.1046/j.1365-2664.2002.00765.x) [DOI] [Google Scholar]
- 41.Letcher A. J., Purvis A., Nee S., Harvey P. H. 1994. Patterns of overlap in the geographic ranges of palearctic and British mammals. J. Anim. Ecol. 63, 871–879 10.2307/5264 (doi:10.2307/5264) [DOI] [Google Scholar]
- 42.Bowers M. A., Brown J. H. 1982. Body size and coexistence in desert rodents: chance or community structure? Ecology 63, 391–400 10.2307/1938957 (doi:10.2307/1938957) [DOI] [Google Scholar]
- 43.Davies T. J., Meiri S., Barraclough T. G., Gittleman J. L. 2007. Species co-existence and character divergence across carnivores. Ecol. Lett. 10, 146–152 10.1111/j.1461-0248.2006.01005.x (doi:10.1111/j.1461-0248.2006.01005.x) [DOI] [PubMed] [Google Scholar]
- 44.Bininda-Emonds O. R. P., et al. 2007. The delayed rise of present-day mammals. Nature 446, 507–512 10.1038/nature05634 (doi:10.1038/nature05634) [DOI] [PubMed] [Google Scholar]
- 45.Olson D. M., et al. 2001. Terrestrial ecoregions of the worlds: a new map of life on Earth. Bioscience 51, 933–938 10.1641/0006-3568(2001)051[0933:TEOTWA]2.0.CO;2 (doi:10.1641/0006-3568(2001)051[0933:TEOTWA]2.0.CO;2) [DOI] [Google Scholar]
- 46.Schipper J., et al. 2008. The status of the world's land and marine mammals: diversity, threat, and knowledge. Science 322, 225–230 10.1126/science.1165115 (doi:10.1126/science.1165115) [DOI] [PubMed] [Google Scholar]
- 47.Kembel S. W., Cowan P. D., Helmus M. R., Cornwell W. K., Morlon H., Ackerly D. D., Blomberg S. P., Webb C. O. 2010. Picante: R tools for integrating phylogenies and ecology. Bioinformatics 26, 1463–1464 10.1093/bioinformatics/btq166 (doi:10.1093/bioinformatics/btq166) [DOI] [PubMed] [Google Scholar]
- 48.Kisel Y., Barraclough T. G. 2010. Speciation has a spatial scale that depends on levels of gene flow. Am. Nat. 175, 316–334 10.1086/650369 (doi:10.1086/650369) [DOI] [PubMed] [Google Scholar]
- 49.Losos J. B., Schluter D. 2000. Analysis of an evolutionary species-area relationship. Nature 408, 847–850 10.1038/35048558 (doi:10.1038/35048558) [DOI] [PubMed] [Google Scholar]
- 50.Rosenzweig M. L. 1975. On continental steady states of species diversity. In Ecology and evolution of communities (eds Cody M. L., Diamond J. M.), pp. 121–140 Cambridge, MA: The Belknap Press [Google Scholar]
- 51.Purvis A., Cardillo M., Grenyer R., Collen B. 2005. Correlates of extinction risk: phylogeny, biology, threat and scale. In Phylogeny and conservation (eds Purvis A., Gittleman J. L., Brooks T.), pp. 295–316 Cambridge, MA: Cambridge University Press [Google Scholar]
- 52.Linder H. P. 2008. Plant species radiations: where, when, why? Phil. Trans. R. Soc. B 363, 3097–3105 10.1098/rstb.2008.0075 (doi:10.1098/rstb.2008.0075) [DOI] [PMC free article] [PubMed] [Google Scholar]
- 53.Cavender-Bares J., Keen A., Miles B. 2006. Phylogenetic structure of floridian plant communities depends on taxonomic and spatial scale. Ecology 87, S109–S122 10.1890/0012-9658(2006)87[109:PSOFPC]2.0.CO;2 (doi:10.1890/0012-9658(2006)87[109:PSOFPC]2.0.CO;2) [DOI] [PubMed] [Google Scholar]
- 54.Lovette I. J., Hochachka W. M. 2006. Simultaneous effects of phylogenetic niche conservatism and competition on avian community structure. Ecology 87, S14–S28 10.1890/0012-9658(2006)87[14:SEOPNC]2.0.CO;2 (doi:10.1890/0012-9658(2006)87[14:SEOPNC]2.0.CO;2) [DOI] [PubMed] [Google Scholar]
- 55.Prinzing A., Reiffers R., Braakhekke W. G., Hennekens S. M., Tackenberg O., Ozinga W. A., Schamine J. H. J., van Groenendael J. M. 2008. Less lineages—more trait variation: phylogenetically clustered plant communities are functionally more diverse. Ecol. Lett. 11, 809–819 10.1111/j.1461-0248.2008.01189.x (doi:10.1111/j.1461-0248.2008.01189.x) [DOI] [PubMed] [Google Scholar]